DP Alert: Dollar (UUP) ST Trend Model BUY Signal By Erin Heim | June 20, 2017
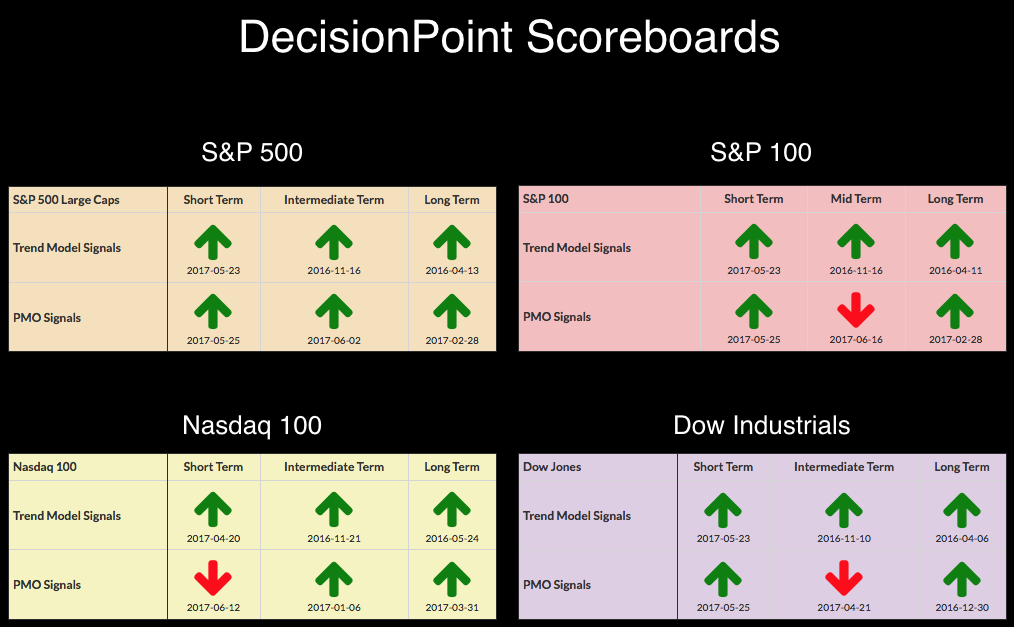
No new signals yet on the DecisionPoint Scoreboards, but with index PMOs in decline, I suspect we will see some more if the bulls can't get a rally to stick. Last Friday, the OEX weekly PMO had a negative crossover SELL signal.
SIGNALS: Here we include charts of any important signal changes triggered today by our Intermediate-Term Trend Model.
NO NEW SIGNALS TO REPORT.
STOCKS
IT Trend Model: BUY as of 11/15/2016
LT Trend Model: BUY as of 4/1/2016
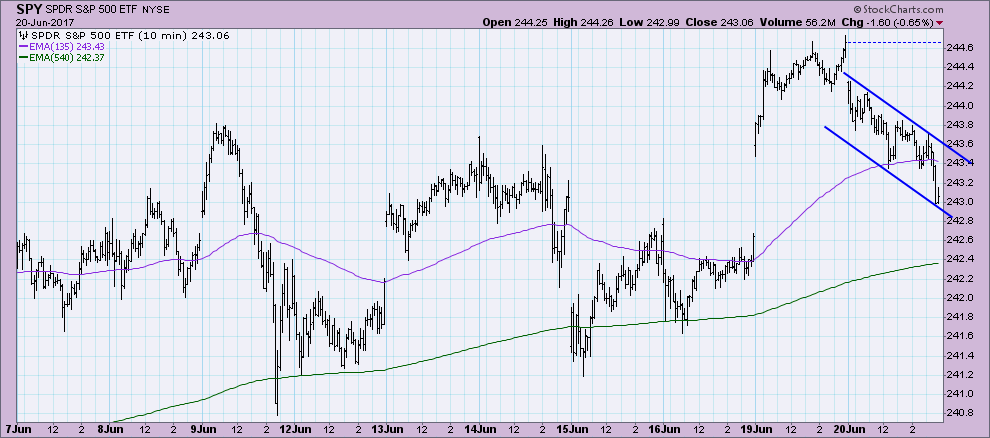
Yesterday saw an encouraging rally that ended at all-time highs. Today a smaller gap down and steep declining trend channel nearly erased all profit as the original gap up began to close.
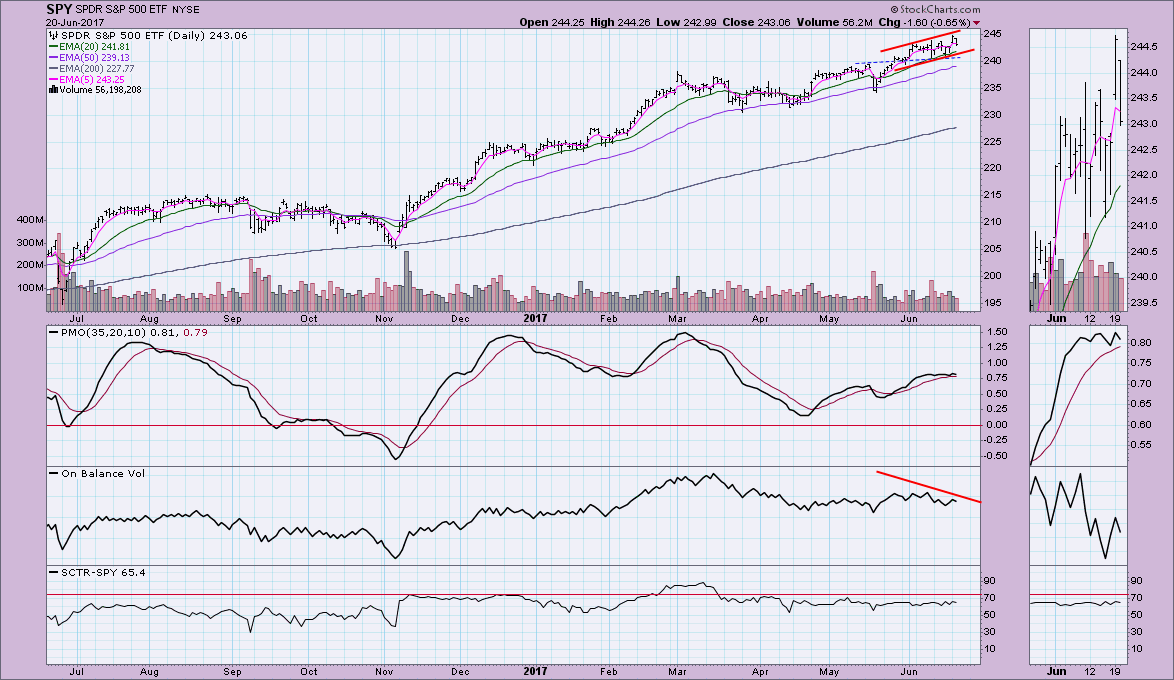
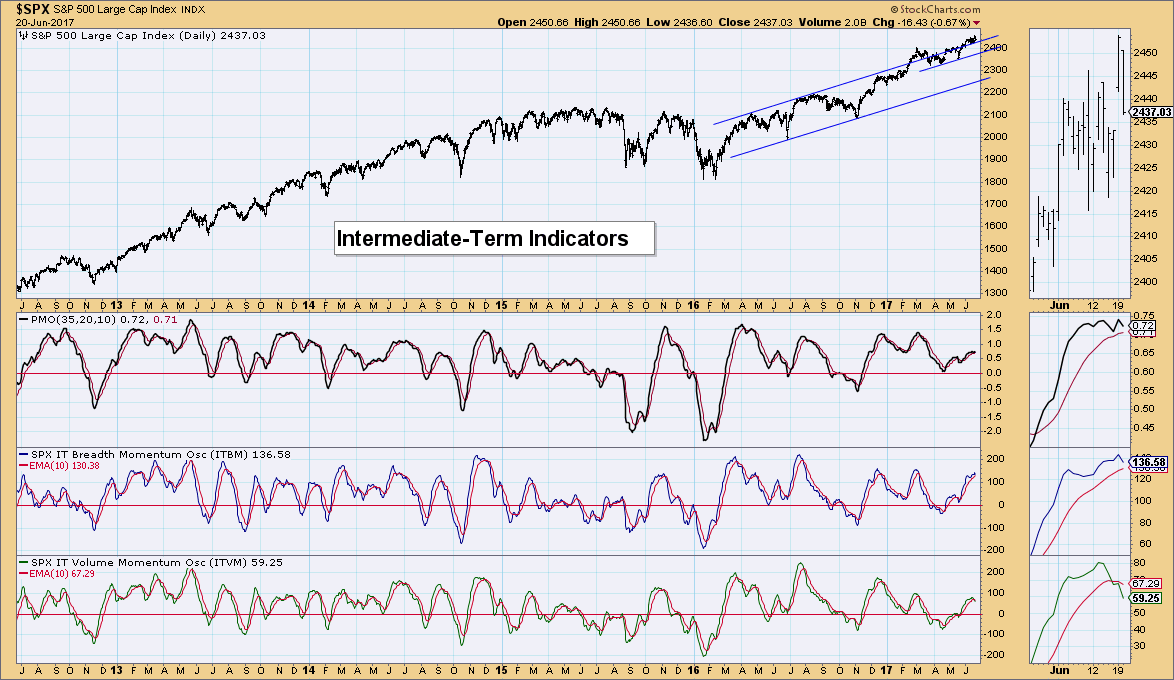
A gently rising trend channel is visible on the SPY, but we do note the indecisive PMO. The PMO will travel sideways when acceleration in one direction or the other doesn't change much. The OBV has a very negative divergence set up between price tops and OBV tops. The SCTR remains healthy.
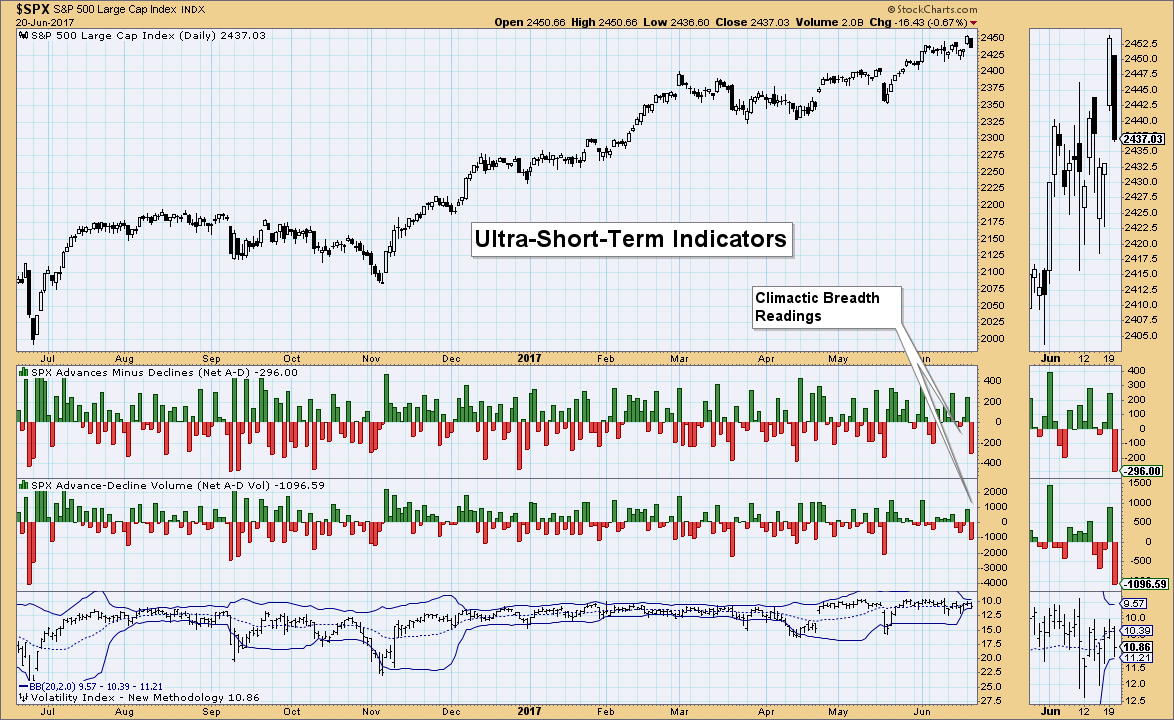
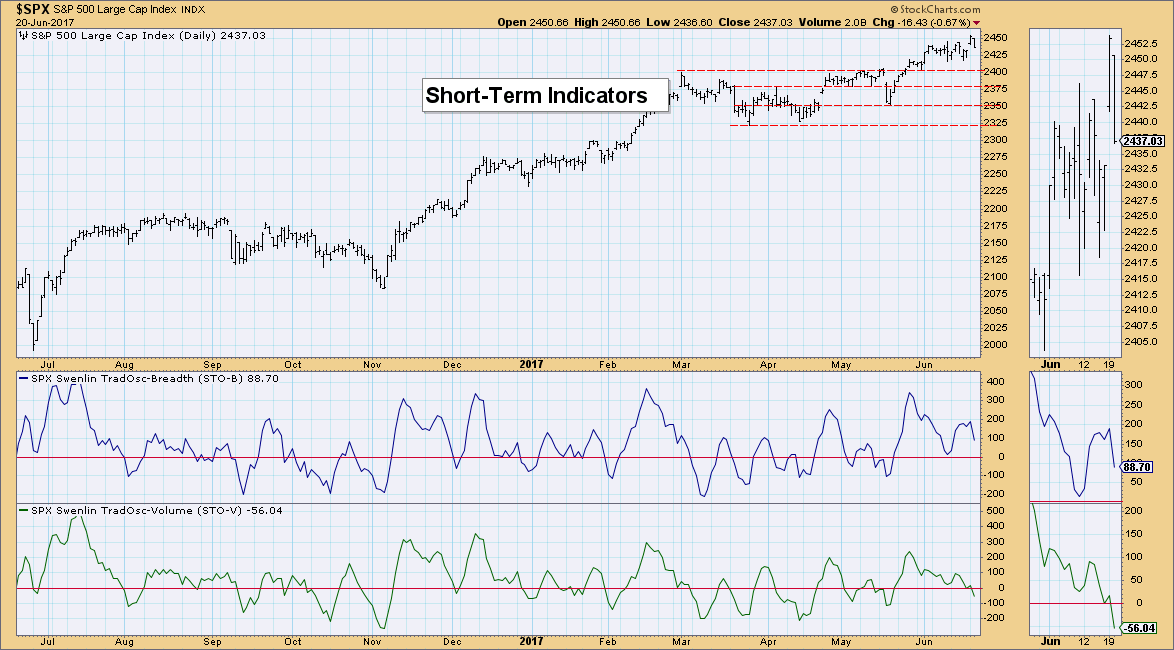
Ultra-Short-Term Indicators: We saw climatic readings on Net Advances-Declines and Net Advancing Volume-Declining Volume. Given this is the first black candle after three white, I would see this as an initiation to lower prices in the very short term. The VIX is no help as it has flattened and Bollinger Bands have shrunk to nothing.
Short-Term Indicators: Since the last overbought top on these indicators, they have spent most of the time unwinding as price consolidated. The STO-V is getting oversold, but not the STO-B. These declining indicators suggest downside or at least consolidation in the short term.
Intermediate-Term Indicators: The ITVM has had a negative crossover, but not the ITBM. While I'm concerned that these indicators are topping, the rising trend on both hasn't been broken yet. The ITBM is near-term overbought, so a decline wouldn't be out of the ordinary in this space. That's what concerns me, a vulnerable ITBM. I'm reading these indicators as cautionary right now, but if we get a negative crossover on the ITBM, it will be time to get bearish in the intermediate term.
Conclusion: Short-term indicators are bearish and intermediate-term indicators are starting to get bearish. I would expect a minimum of more consolidation out of the S&P 500. Similar negative indicator activity has been occurring since last November and each time we've seen minimal pullbacks and mostly consolidation. If the intermediate-term indicators get more bearish, then I'll expect at least a pullback to the 2400 level. . .
Information posted to this board is not meant to suggest any specific action, but to point out the technical signs that can help our readers make their own specific decisions. Your Due Dilegence is a must! • DiscoverGold
Register for free to join our community of investors and share your ideas. You will also get access to streaming quotes, interactive charts, trades, portfolio, live options flow and more tools.


 News
News  Market Data
  Discover