


Saturday, June 17, 2017 2:05:26 PM
Yesterday I noted { ... We both exited short-term consolidation and challenged the $0.72 resistance. The behavior subsequent to that challenge was not such that I read strong negative sentiment into the rejection at that level. Then the conventional TA is still positive, but showing early weakening signs again, while my unconventional stuff had to be discounted, an unusual occurrence (explanation at the end).
That discounting of certain of my unconventional stuff resolved a conflict in a positive direction.
My near-term call is more positive movement is most likely near-term, but with some early signs that weakening may appear. }
Only one change is needed - the early signs that weakening may appear have been obliterated. Near-term most likely seems to be continued upward movement and likely with a continued increase in volume.
There were no pre-market trades.
B/a just before open was 1.1K:530 $0.66/$0.75.
09:30-09:49 opened the day with a 4,473 buy for $0.72 & $0.71 x 2K, $0.72 x800, x 1,361, x 3K, $0.70 x 10K blk. B/a just after open was 20K:6.7K $0.69/$0.72. Then came 9:32's 3.3K $0.7050 (500)/$0.7150 (1.7K)/$0.70 (1.2K), 9:33's b/a 480:6.6K $0.6901/$0.72, 10:47's b/a 11K:6.6K $0.70/2, 9:47's 19.2K $0.7058 (7.1K)/01 (2.3K)/$0.71 (9.8K)/64 (250), 9:49's 1K $0.7153, 9:50's $0.72 (301 (2.3K)/$0.71 (9.8K)/64 (250), and the period ended on 9:49's 1K $0.7153
09:50-10:21 began medium/high-volume, through 10:13, $0.7199/$0.7299, with rising lows and falling highs, on 9:50's $0.72 (3.2K)/$0.7199. B/a at 9:51 was 2.7K:657 $0.7151/99 (bids rising), 9:54 1.6K:700 $0.7200/69 (bids rising), 9:58 100:700 $0.7200/69, 10:04 200:1.8K $0.7210/70 (offers rising). The period ended on 10:21's 2.5K $0.7249 (300)/50.
10:22-10:35, after two no-trades minutes, did a drop and then recovery on 10:24's 1.5K $0.7218/17/10/00 (1K)/$0.7180/$0.7022, 10:26's 13.1K $0.7189 (3.5K)/$0.7250 (3K)/00 (2.7K)/50 (1.6K)/00/50, and then a low-volume movement of the lows up while the highs held steady at $0.725. B/a at 10:32 was 4.8K:678 $0.7150/$0.7250. The period ended on 10:35's 4.3K $0.7249 (3K))/$0.7179 (700)/$0.7250/00.
10:36-11:22 during the initial four no-trades minutes had b/a at 10:36 of 4.8K:378 $0.7150/$0.7250. Trade began extremely low/no-volume $0.7150/$0.7249 on 10:40's 564 $0.7231. B/a at 10:47 was 4.8K:3K $0.7150/$0.7245 (bids rising). Volume was interrupted by 10:51's 8K $0.7244 (4K)/06, 10:52's 4K $0.7244, 10:54's 4K $0.7209, and 10:55's 10.3K $0.7211 (4K)/45 (2.9K)/49 (3,3K). B/a at 11:02 was 700:600 $0.7160/$0.7249 (bids rising). Volume was interrupted by 11:02's 3.5K $0.7162 (2.2K/01/50 and 11:03's 5.2K $0.7151 (5K)/$0.7201. B/a at 11:16 was 500:100 $0.72/48. The period ended on 11:22's 40.5K $0.72 (500)/$0.7150 (9.5K)/$0.7248/49 (600)/50 (3.4K)/70 (3.8K).
11:23-12:32, during the initial eight no-trades minutes had b/a at 11:32 of 2K:1K $0.7200/49 and 11:35's 1K:600 $0.7200/49. Trade began an extremely low/no-volume rise and fall, on 11:41's 2.5K $0.7249 and 11:43's and 11:43's 13K $0.7249 (500)/50 (10.5K)/70 (569)/95 (1K)/50 (400). That began the [extremely low/no-volume slow decline. B/a at 11:47 was 2.1K:2K $0.7250/$0.73, 12:02 2.1K:900 $0.7200/99. Volume was interrupted by 12:05's 7.2K $0.7200/49 (100)/00/$0.7150 (2.7K). B/a at 12:20 310:300 $0.7130/49. 12:27's 588 moved the low to down $0.7130. The period ended on 12:32's 4.2K did $0.7230 (2.4K)/$0.7130 (1.6K)/29/$0.7230.
12:33-13:14 during the initial two no-trades minutes had b/a at 12:32 of 2.2K:11K $0.71/$0.7230. Trade began extremely low/no-volume $0.7200/30 (one minute - most highs $0.7201). B/a at 12:47 was 5.2K:800 $0.7200/1. Volume was interrupted by 12:54's 10.5K $0.7201/00 (30 ea.)/28 (2.7K)/30/10 (2K)/00 5.1K). B/a at 13:02 was 300:2.9K $0.7156/$0.72. The period ended on 13:14's 100 $0.72.
13:15-15:04 began extremely low/no-volume $0.7152/$0.7230, with lows moving quickly to $0.7175 and slowly continuing to rise, after 13:15's 2K $0.7150/2. B/a at 13:17 was 19.1K:2.5K $0.7150/$0.27. Volume was interrupted by 13:21's 5.3K $0.7199 (1.9K)/$0.23 (2.5K)/$0.7197 (900). B/a at 13:32 was 50K:9.7K $0.7200/30. Volume was interrupted by 13:32's 4.1K $0.7230, 13:34's 1.1K $0.7230 and 13:38's 7.6K $0.7152 (2K)/$0.7175 (5K)/$0.7230 (600). B/a at 13:40 was 400:9K $0.7230 (bids jiggling 50K $0.72), 13:47 100:8.9K $0.7204/30, 14:02 400:8.7K $0.7205/30. Volume was interrupted by 14:16's 5.1K $0.7211/30. B/a at 14:17 was 500:4.4K $0.7201/30, 14:32 13K:3.4K $0.7202/30. Volume was interrupted by 14:45's 5K $0.7217. B/a at 14:48 was 100:1.5K $0.7218/30, 15:02 1.5K:300 $0.7220/29. The period ended on 15:04's 1K $0.7220.
15:05-15:41, after four no-trades minutes began an initial low/medium/high/no-volume pop up on 15:09's 2.1K $0.7248 (600)/49 (1.5K), and did 15:11's 4K $0.7249 (3K)/42, 15:12's 7.7K $0.7249, 15:18's 600 $0.7300 (100)/48. B/a at 15:17 was 367:2K $0.7252/$0.7350. A small re-trace was done on 15:20's 1K $0.7302, 15:21's 1.1K $0.$0.7299, and 15:22's 1.7K $0.7299 (700)/$0.7334/14 (100). That began highly variable volume $0.7264/$0.73. B/a at 15:34 was 165:200 $0.7299/$0.73. The period ended on 15:41's 300 $0.7278.
15:42-16:00, after three no-trades minutes, began the normal EOD highly-variable volume and price range $0.723/$0.73 on 15:45's 2.1K $0.7230 (1.4K)/$0.7270/$0.73/$0.7270. B/a at 15:49 was 1.5K:500 $0.7220/99. The period and day ended on 15:59's 8.6K $0.73 (1.2K)/$0.7299 (1.2K)/$0.73/$0.7299/ ... $0.73/$0.7299 and 16:00's 112 sell for $0.7220.
There were eight AH trades totaling ~1.37K: $0.73 x 300, $0.74 x 200, $0.75 x 869.
Excluding the opening and closing trades (didn't qualify), there were 26 larger trades (>=5K & 6 4K+) totaling 173,821, 43.72% of day's volume, with a $0.7202 VWAP. For the day's volume the count seems reasonable but the percentage of day's volume is high. It looks like some larger orders had to be broken up to get filled. The VWAP was above the day's VWAP of $0.7214. All this makes me think some bullish 9nvestors, likely a lot of retail(?), took a lot of the volume.
Most impressive, to me, is the distribution of larger trades throughout the day along with the buy percentage and VWAP remaining so relatively stable at an elevated level. Even considering my belief in the manipulation, I have to consider that this is evidence of real bullishness regardless. Adding in a volume rise of 52.44% and we have evidence of strength in the upward move. yesterday it looked like selling into strength, but not so today - buyers are sopping up all the sellers will release at slowly levitating intra-day price ranges.Ending Period Period Period __Per. Trade_ Period_ % Day_ Per. End
Period Volume Low High _Dollar Val._ VWAP___ Volume Buy ~%
09:49 45974 $0.7000 $0.7200 $32,593.24 $0.7089 11.56% 29.53% Incl 09:30 $0.7000 10,000 09:47 $0.7058 6,690
09:47 $0.7100 9,750
10:21 73536 $0.7199 $0.7299 $53,231.11 $0.7239 18.49% 62.54% Incl 09:52 $0.7200 6,100 09:57 $0.7235 10,000
09:59 $0.7268 5,000 10:00 $0.7269 10,000
10:03 $0.7270 5,000 10:11 $0.7247 5,000
10:35 32245 $0.7022 $0.7250 $23,170.82 $0.7186 8.11% 61.71% Incl 10:29 $0.7142 4,800 10:32 $0.7150 5,200
11:22 55191 $0.7150 $0.7270 $39,774.78 $0.7207 13.88% 62.49% Incl 4,000 $0.7244 10:51 10:52 10:54 $0.7209
10:55 $0.7211 4,000 11:03 $0.7151 5,000
11:22 $0.7150 9,500
12:32 37453 $0.7129 $0.7350 $26,994.60 $0.7208 9.42% 63.25% Incl 11:43 $0.7250 8,501
13:14 13550 $0.7200 $0.7230 $9,767.15 $0.7208 3.41% 61.92% Incl 12:54 $0.7200 4,900
15:04 49681 $0.7150 $0.7230 $35,826.87 $0.7211 12.50% 61.89% Incl 5,000 13:38 $0.7175 14:45 $0.7217
15:04 $0.7230 7,000
15:41 45662 $0.7242 $0.7348 $33,265.01 $0.7285 11.48% 64.07% Incl 15:12 $0.7249 5,000 15:36 $0.7300 10,380
16:00 40321 $0.7220 $0.7300 $29,313.77 $0.7270 10.14% 63.90% Incl 15:50 $0.7230 10,000 15:58 $0.7299 10,000
17:06 1369 $0.7300 $0.7500 $1,018.75 $0.7442 0.34% 63.91%
Interesting is that although we penetrated far above the known $0.70/2 resistance all the periods but for AH stayed right around $0.72, as did the day;s VWAP. That does suggest there were lots of sellers to meet the buyers, suggesting this strength may not be as strong as suggested.
As before, this seems to be a combination of the manipulation and the formerly common run up into earnings.
For the third day I noted early large buy imbalances in the b/a quantities. Today it appeared again relatively late in the day. That again raises the question of whether the behavior was affected by price being supported and pushed higher, possibly to support $CPST ATM use.
On the traditional TA front, movements were:
Volume continued rising for the third consecutive day and four of the last six (one of which was a Friday with a lower volume, quite common).__Open_ ___Low_ __High_ _Close_ Volume_
Today 4.41% 2.91% 2.08% 4.64% 52.44%
Prior 2.93% 4.63% 4.35% 0.83% 36.36%
Noting that we plowed up into the $0.70/2 expected resistance, yesterday I said { Now will come the test whether there's enough bullishness to break through the resistance. So far everything is looking like it could keep going. } I also said { This makes the move above seem less likely near-term. The sellers will have to get exhausted first I think. }
Well, either I was just flat wrong or right and the sellers got exhausted (unlikely IMO). Price achieved a high of $0.735 and closed at $0.722, just enough for me to declare victory. I do think with the [/]apparent manipulation and apparent run up into earnings occurring, based on the volume seen, a confirmation of breakout is likely tomorrow on again rising volume.
On my minimal chart the most significant thing is that the range was at and above the $0.70/2 known resistance (horizontal red line) and the close was above it. So along with yesterday's confirmation of a breakout above the long-term descending resistance, we have an apparent breakout above the next resistance, needing only a confirmation of that one tomorrow. On rising volume today I suspect we just keep going up. The last few days I have been saying we should have more upside left and I think that's still the case.
Trade range was again almost completely at and above the rising fast EMA's $0.70114, which is above the rising slow EMA's $0.6693.
We are still pushing the experimental 13-period Bollinger band upper limit - for the sixth day now. I'm still not concerned, manipulation, run up to earnings and all.
As with the last two days, { Today we have a well-formed volume-bar "cupping pattern" accompanying a rising price. This indicates there should be some more upside available. } Today the "cup" is tilted up on the right side. Nothing significant in that other than apparent strength in the move up is still rising.
I also again hold with the last two day's { ... well, today the volume is more supportive of that (bullish sentiment) even if manipulation has been occurring. }
On my one-year chart, for the second consecutive day we traded completely above the rising 10 and 20-day SMAs. Today about 75% of our trading range was above the 50-day. That and the 200-day are still falling.
Yesterday the oscillators I watch had weakening in accumulation/distribution (back to normal), Williams %R (exited overbought), full stochastic (still overbought, barely), Improvement occurred in RSI, MFI (just below overbought and untrusted by me), momentum (above neutral), and ADX-related.
Today had improvement in accumulation/distribution, RSI, MFI (untrusted by me), Williams %R and full stochastic. Eash is in overbought territory. Improvement also occurred in momentum and ADX-related and the former is above neutral while the latter is approaching getting above neutral.
This put to rest yesterday's concern with a couple oscillators weakening, as I suggested might happen. For the moment I don't see anything here that suggests they should weaken noticeably.
The experimental 13-period Bollinger limits, $0.5941 and $0.7181 ($0.6016 and $0.6995 yesterday), continued diverging with a falling lower limit and faster-rising upper limit, yielding a rising mid-point.
All in, for the fourth consecutive day I have to read as suggesting more near-term positive regardless of "Market management", "ATM", and "TFH" concerns. Just as yesterday's volume increase correctly countered the weakening oscillators' hint of losing steam, today's volume increase supports the other indications that there's stream left in the move upward.
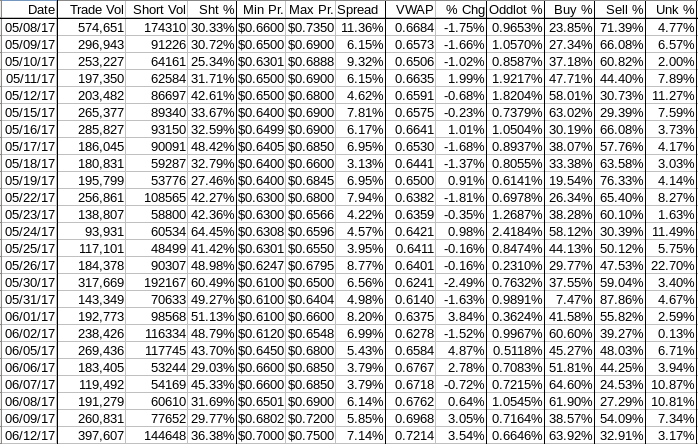
Percentages for daily short sales and buys moved in the same direction, good, and short percentage is right at the low end of my desired range (needs re-check) while buy percentage is into a very positive range for the third time in five days with another day mildly positive. If we expand to seven days add a negative and positive. We certainly have a trend.
The spread, which yesterday shrank a bit but was still in a range suggesting likely movement, expanded today and is strongly suggestive of more near-term movement. With all the positives above, upward seems most likely.
The VWAP's rolling average of the last twenty-four movements improved for the third consecutive day, going to 14 negatives and 10 positives from 15 and 9 respectively. Change since 05/08 is $0.0530, 7.93%, and the averages of the rolling 24-day period seen in the last few days (latest first) are now 0.3385%,0.1182% and -0.0514%, -0.2146%, -0.2079%, -0.3689%, -0.6415%, -0.7567%, -0.8905%, and -0.7494%. The positive trend is still in place for now.
All in, yesterday I said { ... we have exited the short-term consolidation, we made our first test of $0.72 and got rejected and with rising volume I suspect that $0.72 resistance will be broached, and confirmed in relatively short order. } We got the broach today and just need confirmation now. Everything I see today suggests we'll get confirmation.
Bill
Join the InvestorsHub Community
Register for free to join our community of investors and share your ideas. You will also get access to streaming quotes, interactive charts, trades, portfolio, live options flow and more tools.

