Market Pops, Vol Drops -Russell 2000 Outperforms -Financials Rally By Tushar Chande | April 24, 2017
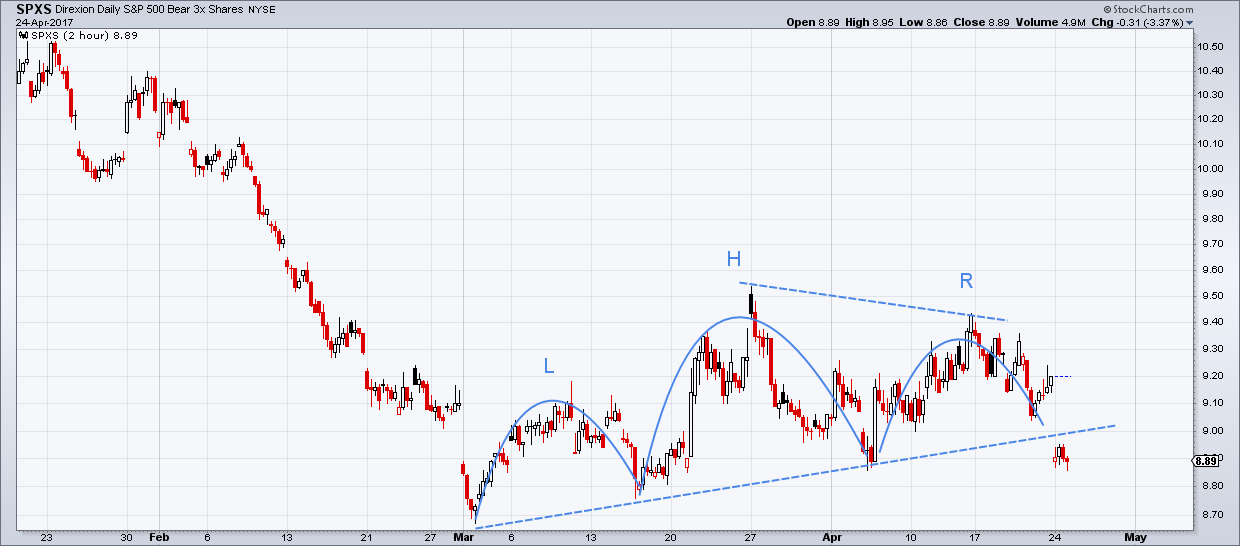
The market's rallied sharply on French election results, and confirmed the change in sentiment we had detected last Monday. The Direxion Daily S&P 500 Bear (3x) ETF (SPXS), which reflects bearish bets on the market, crashed through the neckline of a head-and-shoulders formation we showed in that post. This simply meant a big rally in the SPX, which was accompanied by new highs in the QQQ. More importantly, the Russell 2000 index outperformed both the senior indexes, helped by the very same Financials we identified last Monday has having displayed a positive divergence.
Chart 1: The Direxion Daily S&P 500 Bear 3x ETF crashed through the neckline this morning, after the SPX gapped higher at the open. We had identified this pattern last Monday, in plenty of time to take advantage of the moves.
Market Pops, Vol Drops
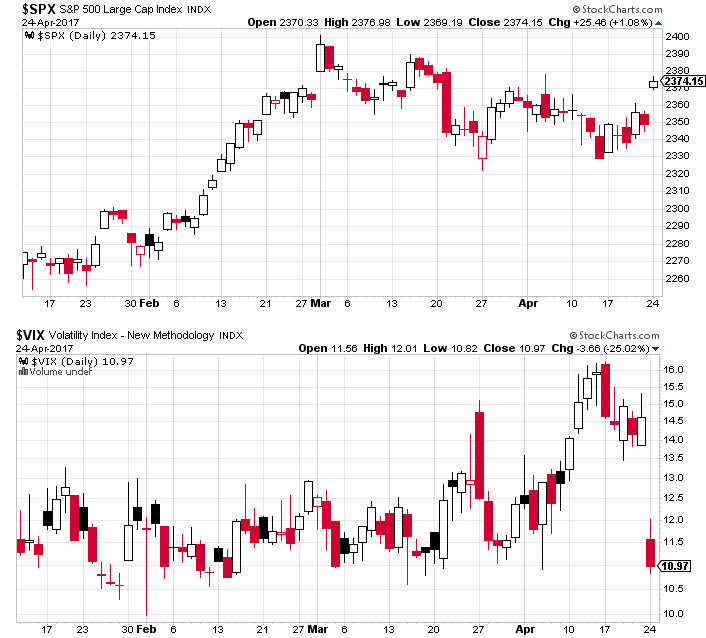
The rally began overnight, with a large gap at the opening of the futures markets, that lasted until the cash markets open. The $VIX index crashed through the 11 handle, breaking its trend from last February.
Chart 2: Note the dramatic drop in the $VIX index, to below 11, and the trend-line since February. We got a clue about this break last Monday, when the $VIX closed below its two previous lows as we noted in our post.
Risk-off Cookies Got Crushed
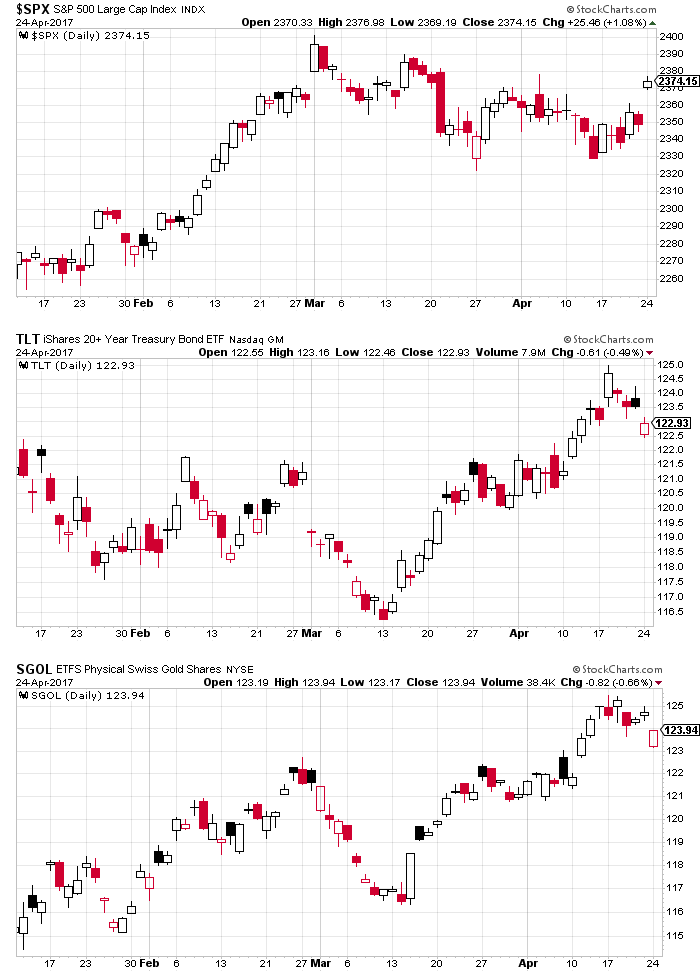
As I showed in my last post, Bonds and Gold provide traders sweet relief during risk-off periods. However, they get crushed during risk-on moves (see Chart 3).
Chart 3: The pop-up in the SPX pushed down Bonds (via the TLT ETF) and Gold (via SGOL ETF). Both opened with large gaps at the start of futures trading on Sunday night.
S&P 500 Rises Into Resistance
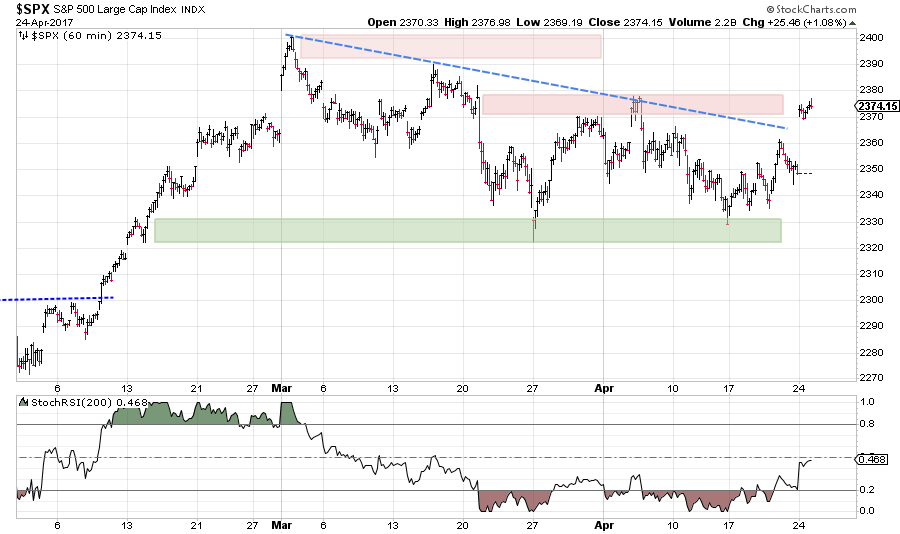
Monday's rally was an important breakout. First, the S&P 500 rose above its down-trend channel and into resistance (see Chart 4). Then, the QQQ push to new highs, accompanied by many of its components and tech heavy-weights. Thirdly, the Russell 2000 index, which had lead the weakness, pushed through its March-April highs, outperforming the SPX in the process (+1.31% vs +1.08%). The $RUT rally was helped in no small part by a rally in the Financials sector (which forms a big part of the Russell 2000 index).
Chart 4: The S&P 500 rose above its recent down-trend channel, but into overhead resistance. The 200-period StochRSI in the lower panel is still below 0.80 typical of new up-trends.
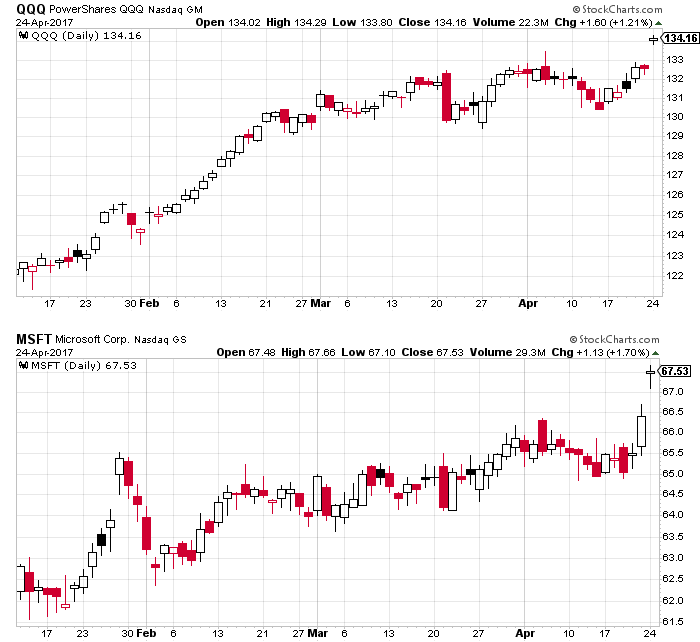
Chart 5: The QQQ rose to new highs, accompanied by stalwarts such as Microsoft (see lower panel). This is an encouraging sign for the continuation of this move. [img] d.stockcharts.com/img/articles/2017/04/1493083206056540092467.png[/img]
Chart 6: The $RUT (Russell 2000 index) moved above its March-April resistance (lower-panel), helped in large part by strong moves in the financials sector (upper panel). We had observed a positive divergence in the XLF last Monday. Since the $RUT was weak going into this downturn, its strength now may help us come out of it even stronger.
Short-term Models Change Trend for SPX
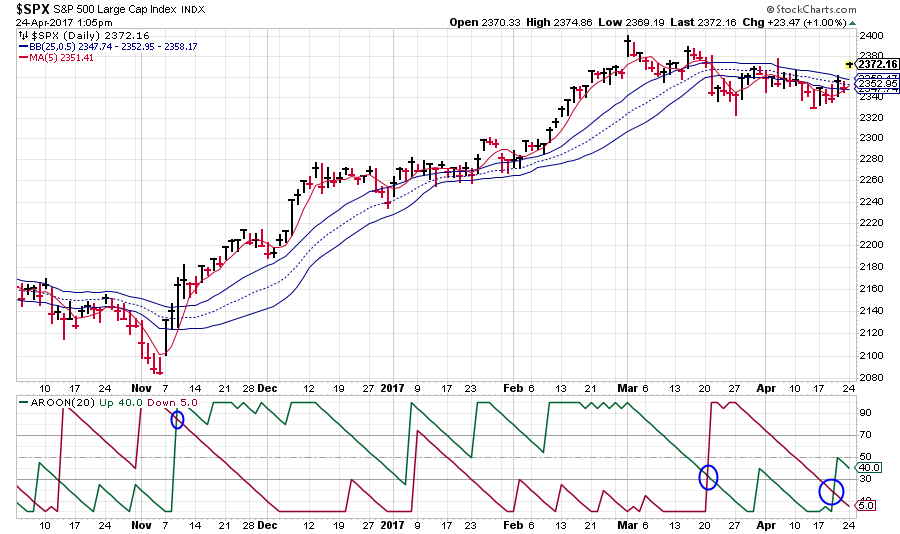
The rally today took the SPX above its upper-band in the short-term model. The 5-day simple moving average, the signal line, is between the bands, the model has changed from short to flat. If the SPX overcomes the resistance in Chart 4, then we can expect a change in trend again (see Chart 7). The trend check carpet shows the Russell 2000 now turning bullish in the short-term (see Chart 8). The improvement in the market's tenor is visible clearly in the market environment (see Chart 9) in which the short-term path of least resistance is almost turned positive.
Chart 7: The cross-over in the Aroon indicator last week was followed by a sharp move above the upper band. The 5-day SMA signal line is between the bands, so the current trend is neutral, moving up from trending down.
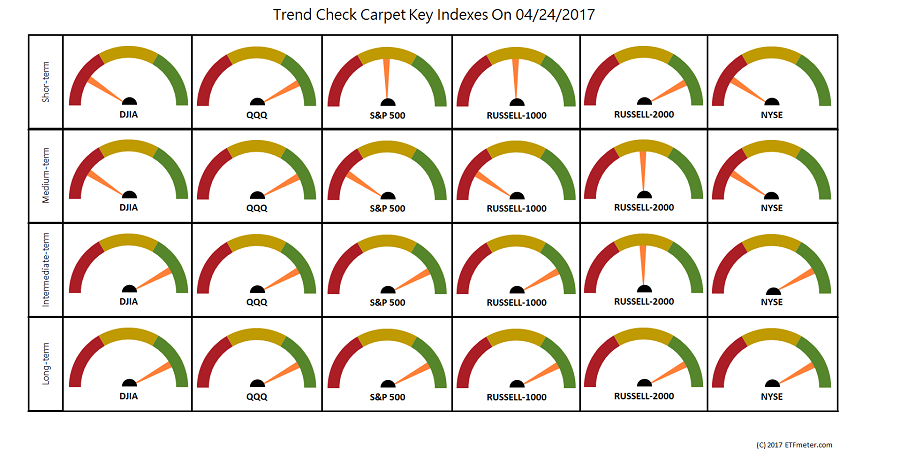
Chart 8: The Trend Check carpet shows two significant changes in the short-term (top row). The SPX is now neutral, and the Russell 2000 index is now bullish. The degree of smoothing increases from top to bottom and the market breadth increases from left to right.
Chart 9: The short-term environment has improved a lot today, and is now about to turn positive after the sharp rally. The intermediate-term outlook has also improved. The long-term trend has remained higher throughout this downturn. . .
Information posted to this board is not meant to suggest any specific action, but to point out the technical signs that can help our readers make their own specific decisions. Your Due Dilegence is a must! • DiscoverGold
Register for free to join our community of investors and share your ideas. You will also get access to streaming quotes, interactive charts, trades, portfolio, live options flow and more tools.


 News
News  Market Data
  Discover