:::: S&P 500 DecisionPoint Weekly Wrap - Correction Over? :::: By Carl Swenlin | April 22, 2017
Last week I wrote, "The first necessary signal that the correction is over would be for the daily PMO (Price Momentum Oscillator) to turn up." That happened on Thursday, but there was no follow through on Friday due to, I believe, it being options expiration day, which tends to dampen volatility and keep prices steady. The slight decline caused the PMO to turn down again, but the direction is basically sideways. Let's see if a deeper analysis will clarify the situation for us.
The DecisionPoint Weekly Wrap presents an end-of-week assessment of the trend and condition of the stock market (S&P 500), the U.S. Dollar, Gold, Crude Oil, and Bonds.
STOCKS
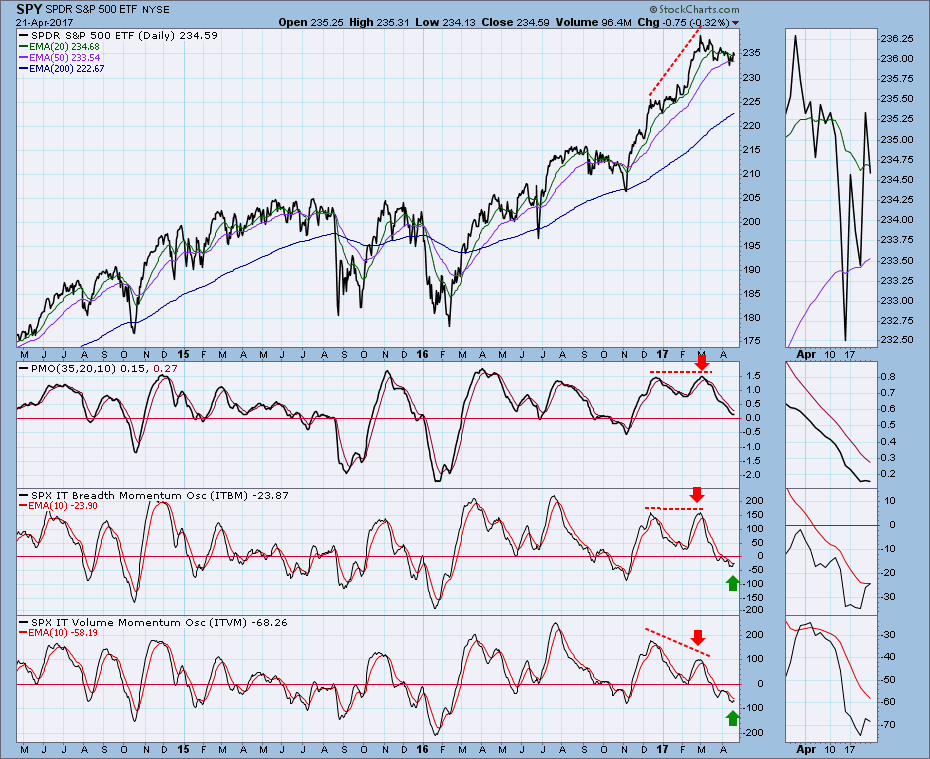
IT Trend Model: BUY as of 11/15/2016
LT Trend Model: BUY as of 4/1/2016
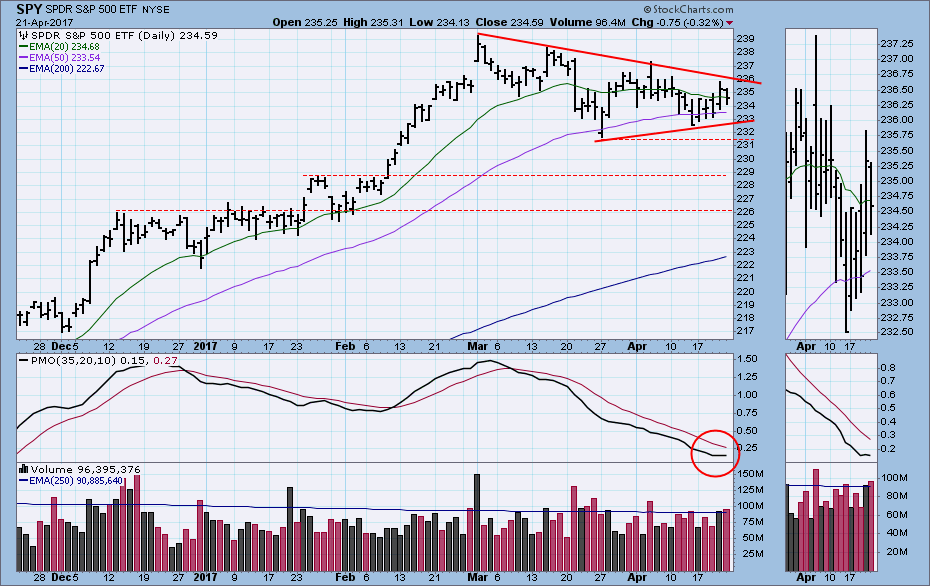
The expansion of volume on Friday was due to options expiration, so I don't think it serves to emphasize the decline on that day. The PMO is indecisive. The triangle formation defines the current correction, and a breakout from that triangle will probably mark the correction's end.
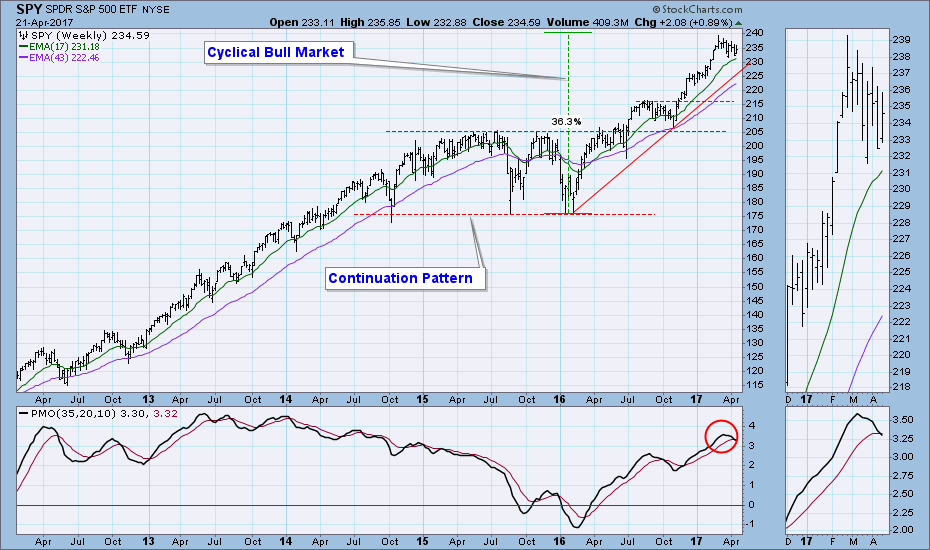
The weekly PMO has topped and dropped below its signal line. That is a SELL signal, but I'm thinking it will probably not be any more serious than the one generated in the fall of 2016 -- price can correct further before the rising trend line is encountered.
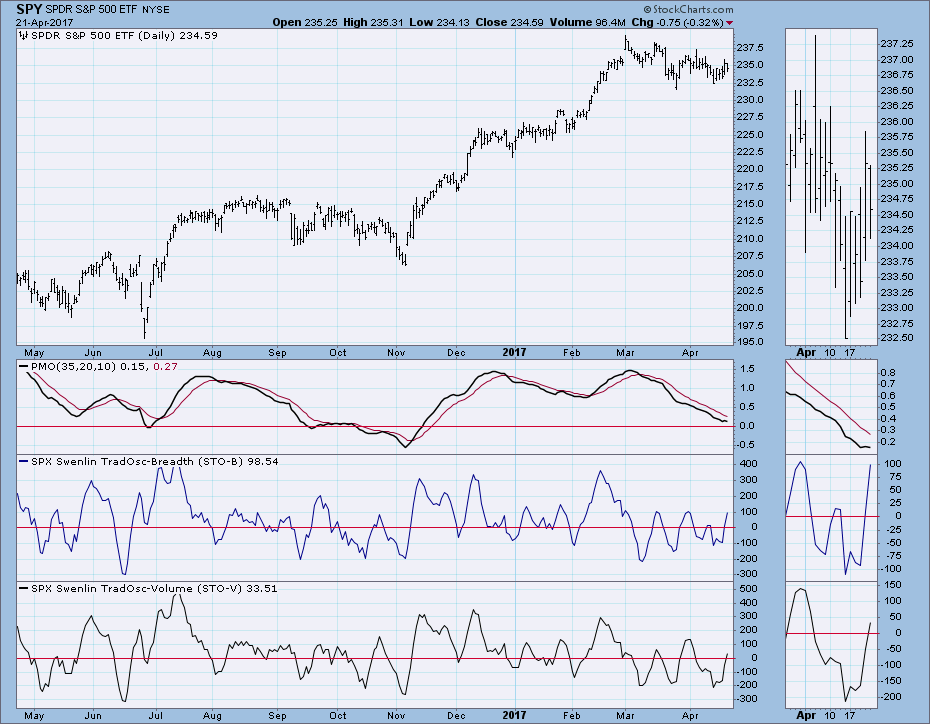
Short-Term Indicators: Internals are neutral in this time frame.
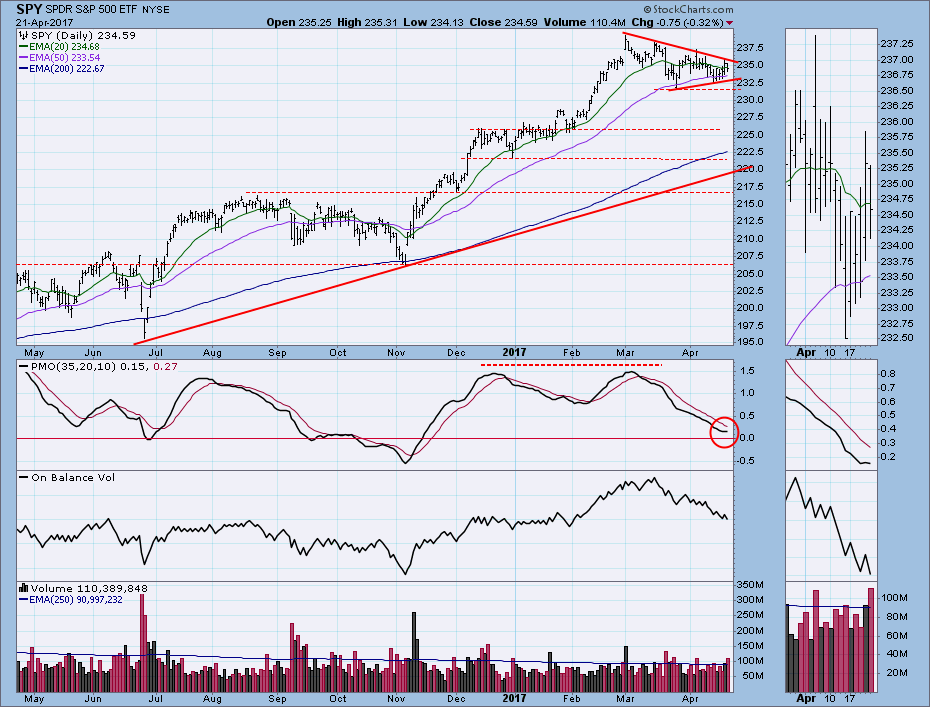
Intermediate-Term Indicators: All these indicators seem to be trying to bottom at a level that could be sufficiently oversold for a bull market.
Conclusion: Is the correction over? Well, no, but it may be very soon. Objectively speaking, intermediate-term internals have declined to levels that could justify another leg up, and they are doing their best to bottom. The market has been correcting for seven weeks, which is sufficient, if not conclusive. We have IT and LT BUY signals, so my bias has to be weighted toward the bull. My posture is to look for an up move next week, and as last week, a daily PMO bottom will be the first, if not infallible, clue that the market is done correcting. If an upside breakout follows, I will believe it.
DOLLAR
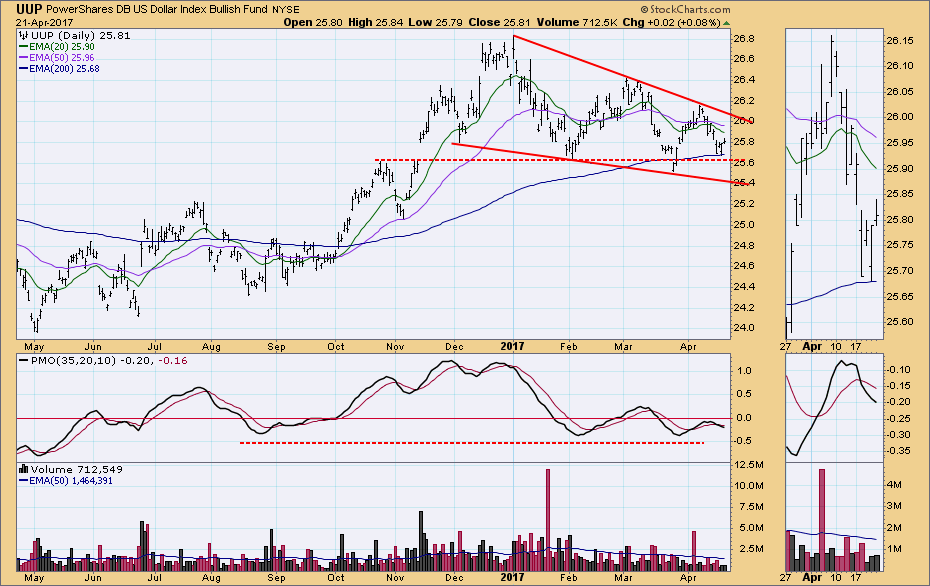
IT Trend Model: NEUTRAL as of 3/21/2016
LT Trend Model: BUY as of 10/17/2016
UUP found support on the 200EMA and has begun a small bounce. The dominant feature on this chart is the falling wedge formation. Since UUP is in a bull market (50EMA is above the 200EMA), an upside breakout from the wedge is the likely resolution.
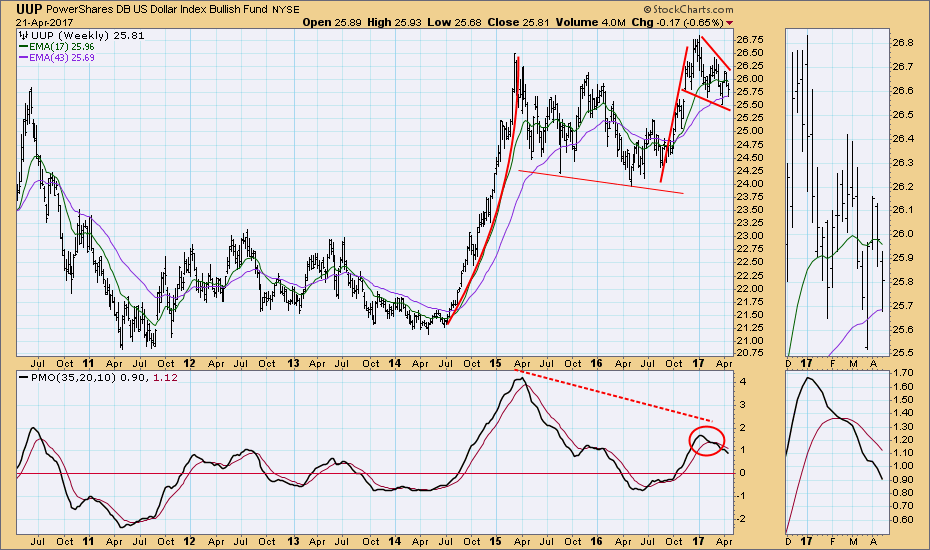
There is a bullish flag formation on the weekly chart, which has caused the PMO to decline. If the flag resolves bullishly, as expected, the PMO will rise in confirmation of the move. . .
Click on "In reply to", for Authors past commentaries
Information posted to this board is not meant to suggest any specific action, but to point out the technical signs that can help our readers make their own specific decisions. Your Due Dilegence is a must! • DiscoverGold
Register for free to join our community of investors and share your ideas. You will also get access to streaming quotes, interactive charts, trades, portfolio, live options flow and more tools.


 News
News  Market Data
  Discover