Peek Into Future Through Futures By Hedgopia | April 22, 2017
Following futures positions of non-commercials are as of April 18, 2017.
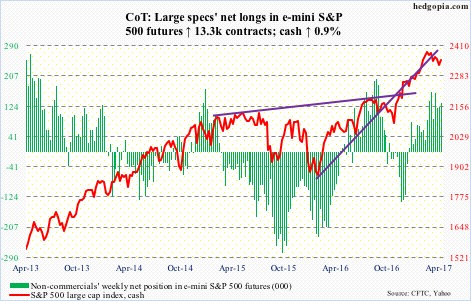
E-mini S&P 500:Currently net long 134.2k, up 13.3k.
Although the cash has remained under the 50-day moving average for seven straight sessions, it never undercut the March low of 2322.25. The average also coincides with a declining trend line from March 1 when the index rallied to an intraday high of 2400.98.
A takeout of this resistance will make way for another test – 2370, which goes back a couple of months and which is where the daily upper Bollinger band rests.
At least until Wednesday, flows into SPY, the SPDR S&P 500 ETF, were not cooperating – down $747 million in that week (courtesy of ETF.com).
In the same week, U.S.-based equity funds attracted $866 million (courtesy of Lipper).
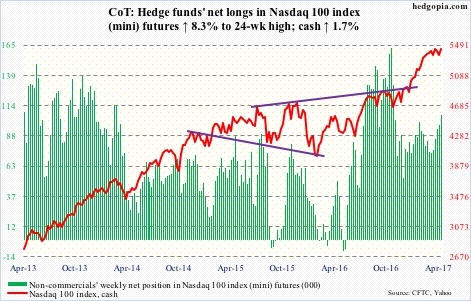
Nasdaq 100 index (mini):Currently net long 105.8k, up 8.1k.
Last week, for the first time this year the still-rising 50-day moving average on the cash was tested, and defended. The index once again is testing one-plus month resistance. Non-commercials have been adding as if it is only a matter of time it gave way.
Flows continue to play hide and seek.
In the week ended Wednesday, QQQ, the PowerShares Nasdaq 100 ETF, lost $358 million. This followed inflows of $409 million in the prior week (courtesy of ETF.com).
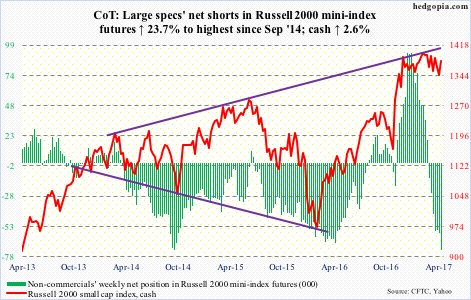
Russell 2000 mini-index:Currently net short 72.2k, up 13.8k.
After getting rejected at the 50-day moving average in three straight sessions last week, the cash then dropped to the bottom of a nearly five-month range.
The subsequent bounce off of that support not only broke past that average but also a declining trend line from the all-time high on March 1 (1414.82).
The top of the range is merely 0.9 percent away, where shorts can get active. Until proven otherwise, shorting range resistance and buying support has worked like a charm.
In the week ended Wednesday, IWM, the iShares Russell 2000 ETF, lost $340 million. This was the fourth straight weekly loss during which $3.1 billion left (courtesy of ETF.com).
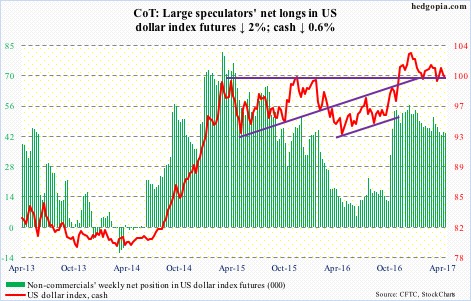
US Dollar Index:Currently net long 43.4k, down 898.
The neckline of a head-and-shoulders formation on the cash was just about tested Thursday when it hit 99.29. The index has been under pressure since rallying to 101.27 to kiss the upper Bollinger band eight sessions ago.
In the days ahead, worse, the dollar index drops to test the 200-day moving average (98.91), which also approximates the aforementioned neckline – a must-hold, and likely does not give way. Daily conditions are oversold.
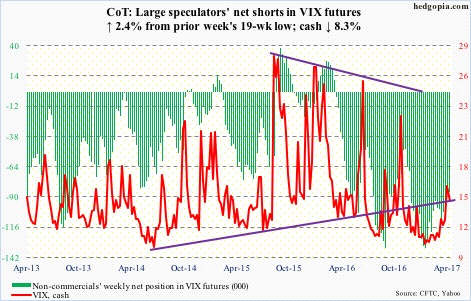
VIX:Currently net short 85.6k, up 2k.
The week started with a large reversal candle on the cash. This preceded a 49-percent rally in eight sessions (from intraday low to high). The resulting overbought conditions are being unwound, but volatility bulls are not giving up easy.
Real test lies ahead. The 200-day moving average (13.05) is 1.58 points away. After that comes the rising 50-day (12.40). In the weeks ahead, there likely is a golden cross in the making – potentially bullish for volatility.
Inability to save these two averages opens the door for a drop to the bottom of the multi-year range the cash has been in.
In this scenario, the VIX-to-VXV ratio continues to unwind its overbought conditions. Last week, it closed at 1.01, dropping to .99 this week. Prior to the recent jump, the ratio lingered in high-.70s/low-.80s for weeks.
Click on "In reply to", for Authors past commentaries
Information posted to this board is not meant to suggest any specific action, but to point out the technical signs that can help our readers make their own specific decisions. Your Due Dilegence is a must! • DiscoverGold
Register for free to join our community of investors and share your ideas. You will also get access to streaming quotes, interactive charts, trades, portfolio, live options flow and more tools.


 News
News  Market Data
  Discover