| Followers | 689 |
| Posts | 143817 |
| Boards Moderated | 35 |
| Alias Born | 03/10/2004 |
Wednesday, April 12, 2017 10:20:07 AM
* April 11, 2017
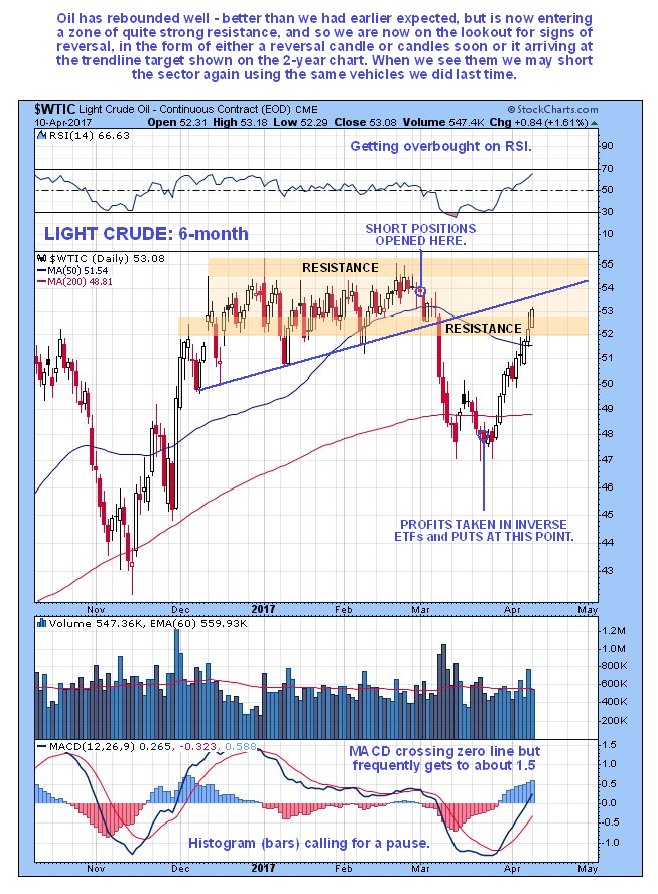
There has been a quite sizeable rally in the oil sector since we offloaded our oil inverse ETFs and Puts for a profit at the exact bottom over 2 weeks ago. The Puts in USO we sold at 5 times what we paid for them, which feels even better given that they are now almost worthless.
It has to be said that the oil rally of the past two weeks has been bigger than we expected and was given a boost late last week by the cruise missile strike. As you may recall, our plan was to get back into the inverse ETFs and Puts on a more feeble rally, but as the rally progressed, we held off as it looked like it would reach higher levels than we at first thought, and such has proved to be the case – and it may continue a little longer before it’s done.
On the 6-month chart for Light Crude below we can see our nearly perfectly timed entry and exit points for the short trade, although in retrospect we can now see that we should have reversed to long at the bottom two weeks ago and ridden it back up which would have been even better, but as mentioned above, at the time we didn’t expect the rally to get this far.

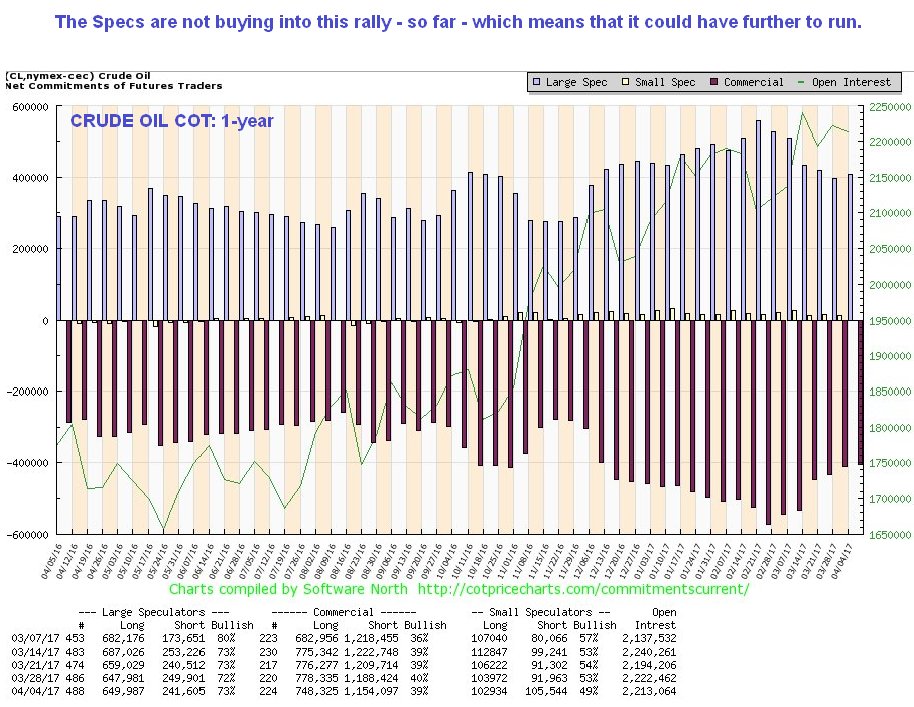
Now what? – with crude rising up into a zone of quite strong resistance it could turn lower again at any time. However, there are a number of factors suggesting that the rally may have a little further to run. First the MACD indicator has only just crossed through the zero line, and it has a tendency in the case of oil to keep on going until it gets to the 1.5 area. Second, the bulls have definitely gotten control of the ball again and we would be wise to keep out of their way until we see definite signs that they are losing control, like a large reversal candle, or we are able to pre-empt the turn when oil arrives at a trendline target. Another factor suggesting that the rally has a little way further to run is the latest oil COTs shown below, which reveal that the Specs don’t believe in this rally - we need them to start piling in again so that we can be more confident that the rally is about done.

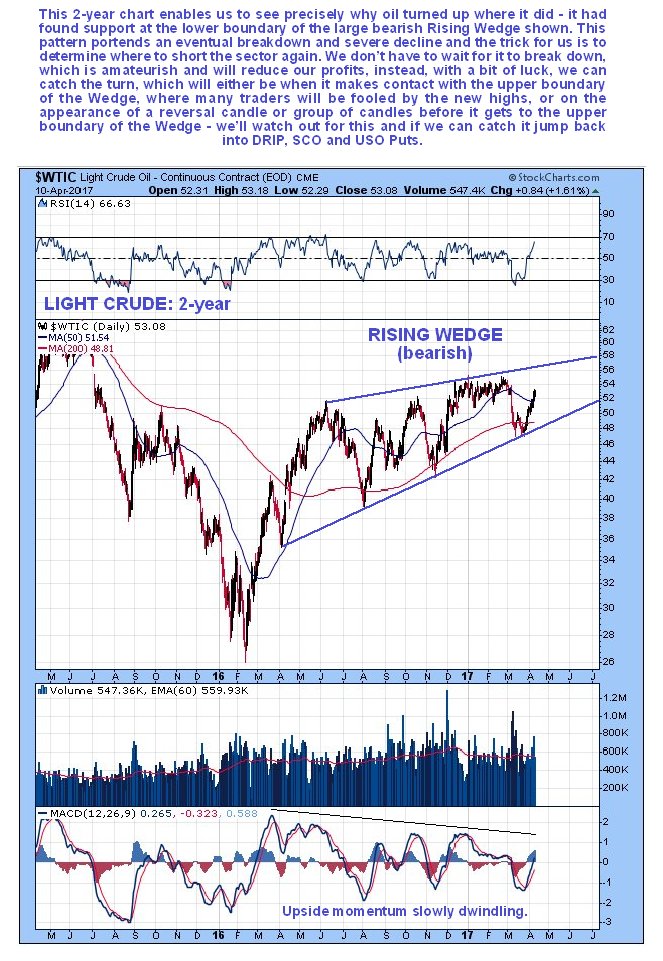
Bearing in mind that the MACD may run to about 1.5 overbought before this rally is done, the 2-year chart for Light Crude is helpful as it enables us to delineate a target for the rally, which as we can see, is at the top of the converging channel shown at about $56. This converging channel is thought to be a bearish Rising Wedge, which bodes ill for the oil price, and the real downside fireworks would start of course when the price breaks down from it, but we don’t have to wait for that – we can take much more optimal bear positions by shorting it either when it makes contact with the upper boundary of the channel, or if a reversal candle or candles appear in the near future before it gets to the top of the channel. We will therefore bide our time and wait for either of these developments to manifest before reopening short positions (inverse ETFs and Puts again). We have already figured that gold and silver look set to drop back, which implies a dollar rally, and if the dollar rallies, gold, silver and oil (and copper) are likely to drop together.

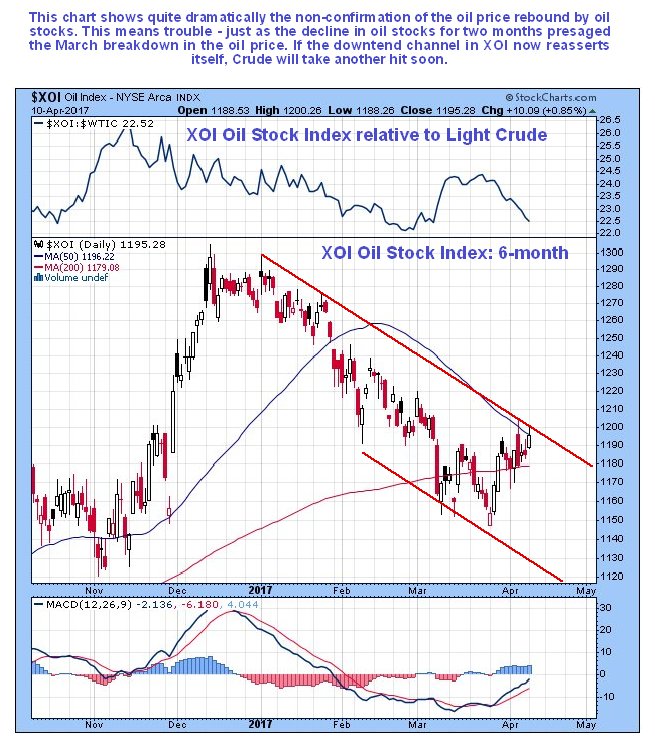
Oil stocks remain weak and have barely moved on this oil rally so far. If this oil rally had legs oil stocks would look a lot better than this. This weakness in oil stocks is another factor suggesting that oil will reverse to the downside again before much longer…

https://www.clivemaund.com/free.php?id=69
• DiscoverGold
Click on "In reply to", for Authors past commentaries
Information posted to this board is not meant to suggest any specific action, but to point out the technical signs that can help our readers make their own specific decisions. Your Due Dilegence is a must!
• DiscoverGold
VHAI - Vocodia Partners with Leading Political Super PACs to Revolutionize Fundraising Efforts • VHAI • Sep 19, 2024 11:48 AM
Dear Cashmere Group Holding Co. AKA Swifty Global Signs Binding Letter of Intent to be Acquired by Signing Day Sports • DRCR • Sep 19, 2024 10:26 AM
HealthLynked Launches Virtual Urgent Care Through Partnership with Lyric Health. • HLYK • Sep 19, 2024 8:00 AM
Element79 Gold Corp. Appoints Kevin Arias as Advisor to the Board of Directors, Strengthening Strategic Leadership • ELMGF • Sep 18, 2024 10:29 AM
Mawson Finland Limited Further Expands the Known Mineralized Zones at Rajapalot: Palokas step-out drills 7 metres @ 9.1 g/t gold & 706 ppm cobalt • MFL • Sep 17, 2024 9:02 AM
PickleJar Announces Integration With OptCulture to Deliver Holistic Fan Experiences at Venue Point of Sale • PKLE • Sep 17, 2024 8:00 AM


