


| Followers | 689 |
| Posts | 143817 |
| Boards Moderated | 35 |
| Alias Born | 03/10/2004 |
Monday, February 20, 2017 7:43:50 PM
* February 20, 2017
The last Oil Market update posted on 1st January highlighted a number of contradictory indications for oil, and what has happened since is mostly nothing – a standoff. The purpose of this update is chiefly to point out that oil’s latest COT readings have risen to record bearish extremes, which does not bode well for the oil price at all, especially as, in contrast to oil itself, oil stocks have retreated significantly so far this year, which is another bearish omen for oil.
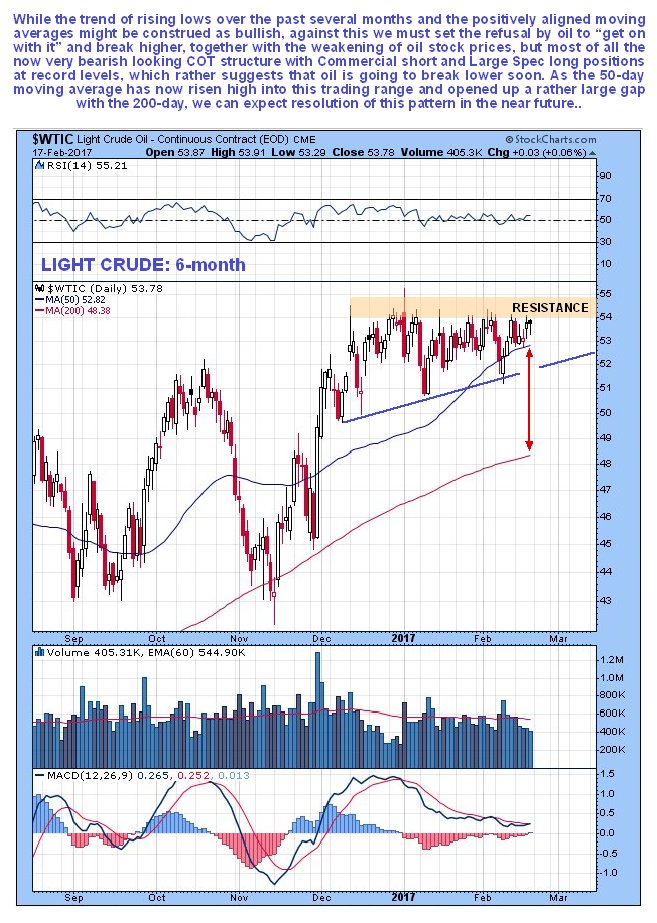
On the 6-month chart for Light Crude we can see that it has barely moved since the start of the year, and is actually little changed from its price at the start of December. So this standoff has been going on for quite a while. With a trend of higher lows and moving averages in bullish alignment, it looks at first sight like the price will soon break to the upside, but oil stock prices and the COTs are telling a different story.
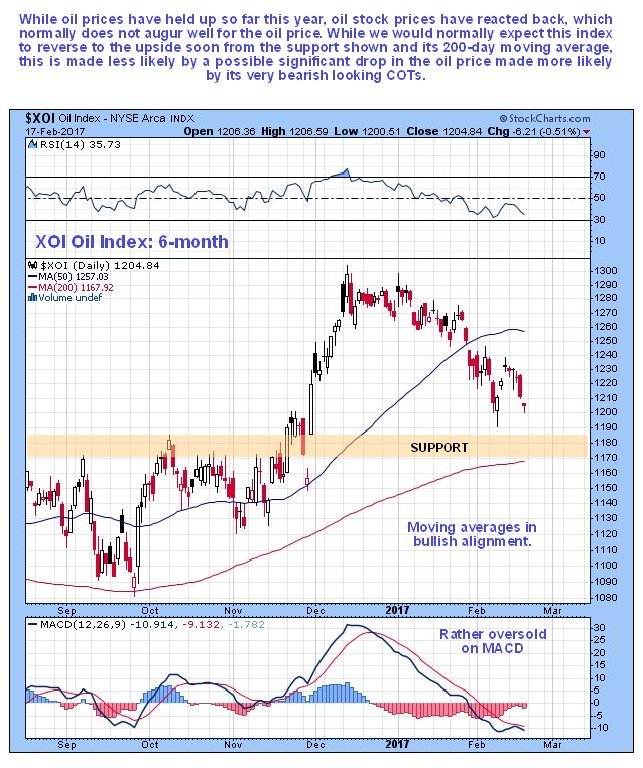
Oil stock prices have generally been weakening since the start of the year as the 6-month chart for the XOI oil index makes plain, which normally leads to weakening oil prices.
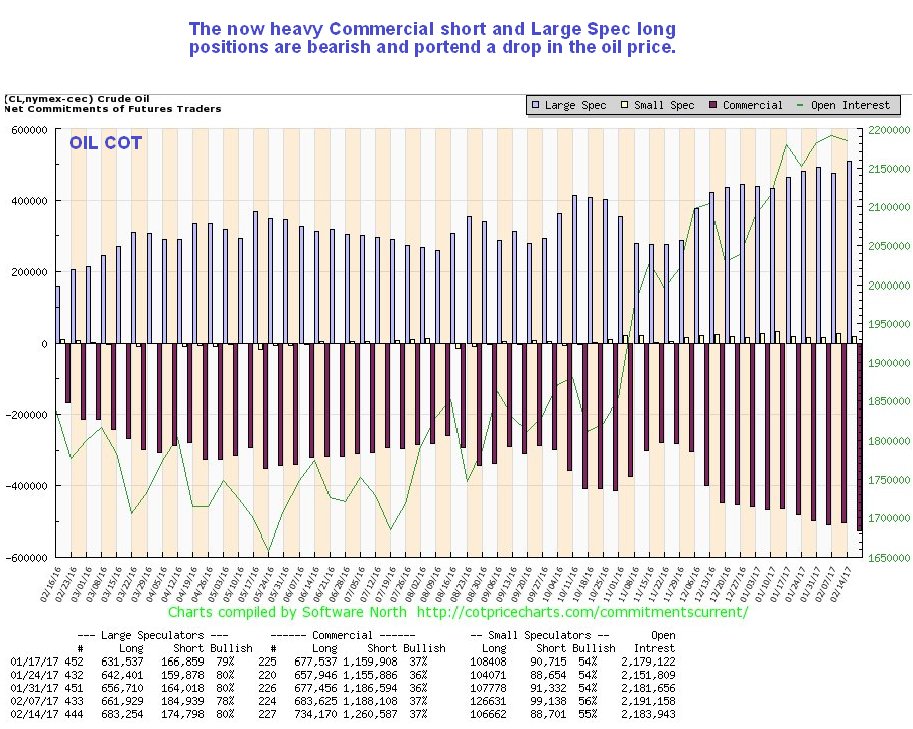
Considerably more serious is the trend to bigger and bigger Commercial short and Large Spec long positions on the COT charts, and since the Large Specs almost always end up on the wrong side of the trade, this is viewed as portending a break to the downside by oil…
But it is the long-term Oil Hedgers chart that looks really scary. On this chart going way back to the 90’s we see that the current extremely negative readings exceed even those of 2014 – right before the oil price plummeted, although the other occasion in recent years when a somewhat less extreme condition existed, early in 2011, did not lead to a particularly serious drop. Nevertheless, it is considered foolhardy to go against this now very extreme reading, which is viewed as having the potential to trigger a potentially big drop in the oil price.
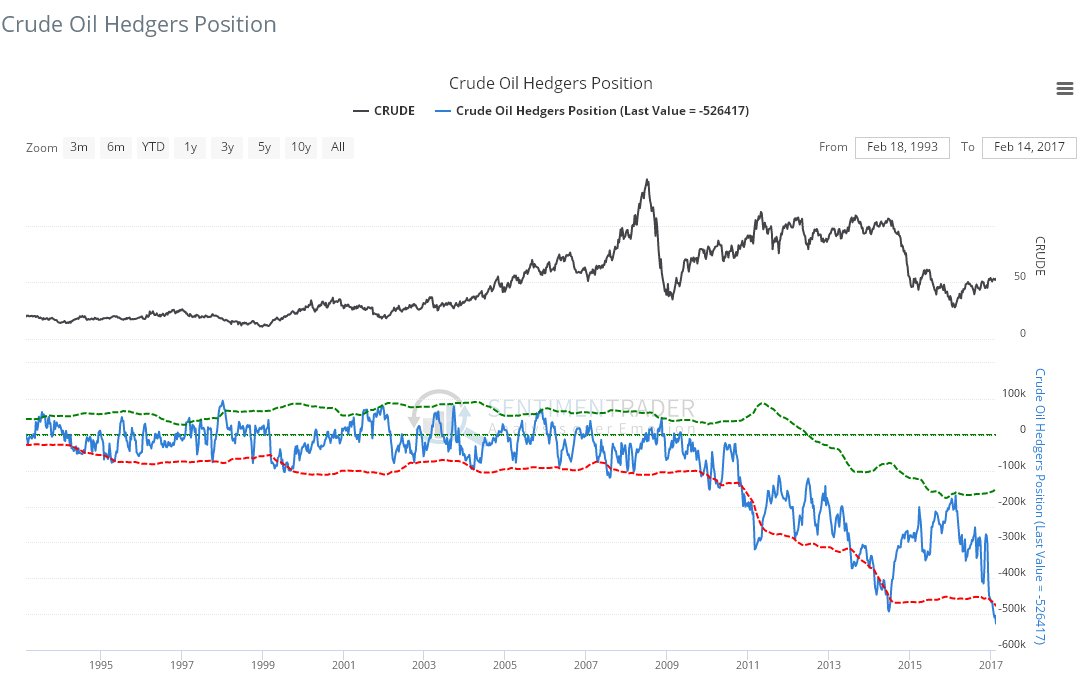
Chart courtesy of www.sentimentrader.com
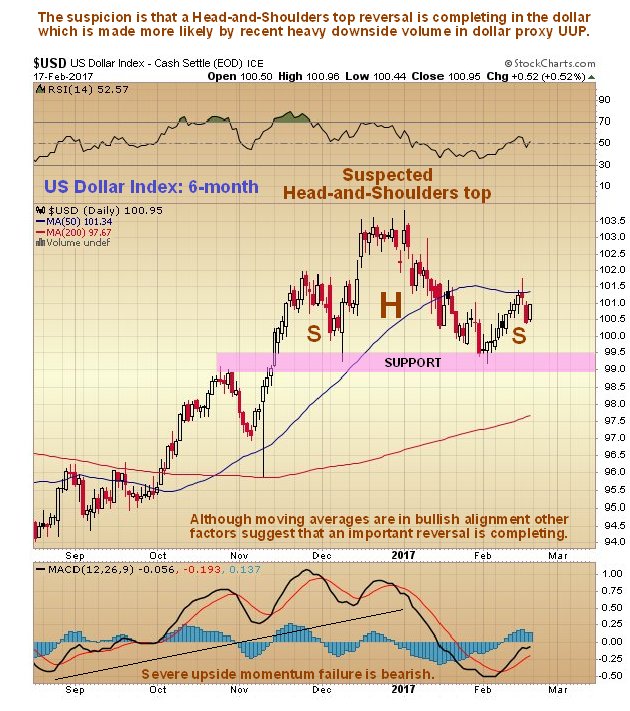
Since it would be unlikely that oil would drop hard if the dollar dropped also, a corollary of what we are seeing here is that it may imply that the Head-and-Shoulders top that we are seeing approach completion in the dollar index may abort, although we cannot rule out entirely that they might drop in unison. Certainly the chart below for the dollar index does not look positive, and it is known that Trump wants to eliminate the competitive advantage afforded to other nations by a strong dollar.
Finally, it is worth mentioning that while a drop in the oil price is likely to adversely affect the prices of oil stocks generally, two of our oil stocks, Jericho Oil and Torchlight Energy, are special situations which have a good chance of escaping collateral damage from a falling oil price and could even rally despite it.
https://www.clivemaund.com/free.php?id=69
• DiscoverGold
Click on "In reply to", for Authors past commentaries
Information posted to this board is not meant to suggest any specific action, but to point out the technical signs that can help our readers make their own specific decisions. Your Due Dilegence is a must!
• DiscoverGold
VHAI - Vocodia Partners with Leading Political Super PACs to Revolutionize Fundraising Efforts • VHAI • Sep 19, 2024 11:48 AM
Dear Cashmere Group Holding Co. AKA Swifty Global Signs Binding Letter of Intent to be Acquired by Signing Day Sports • DRCR • Sep 19, 2024 10:26 AM
HealthLynked Launches Virtual Urgent Care Through Partnership with Lyric Health. • HLYK • Sep 19, 2024 8:00 AM
Element79 Gold Corp. Appoints Kevin Arias as Advisor to the Board of Directors, Strengthening Strategic Leadership • ELMGF • Sep 18, 2024 10:29 AM
Mawson Finland Limited Further Expands the Known Mineralized Zones at Rajapalot: Palokas step-out drills 7 metres @ 9.1 g/t gold & 706 ppm cobalt • MFL • Sep 17, 2024 9:02 AM
PickleJar Announces Integration With OptCulture to Deliver Holistic Fan Experiences at Venue Point of Sale • PKLE • Sep 17, 2024 8:00 AM

