


Friday, March 24, 2017 9:15:43 AM
There were no pre-market trades.
B/a just before open was 100:1.4K $0.7499/$0.85.
09:30-11:20 opened the day with a 250 sell for $0.7644. B/a just after open was 600:1 $0.75/$0.80 (offers backed by presented 1.1K $0.8150). Then came 9:34's 300 $0.8028, 9:37's b/a 100:1 $0.75/$0.80 (offers backed by presented 700 $0.8149), 9:40's b/a 100:400 $0.7499/$0.7998, 9:43's 5.8K $0.75/$0.7679/$0.7499/03, 9:45's 1.1K $0.7773 (1K)/$0.7410, 9:50's b/a 700:300 $0.745/$0.7797, 9:55's 300 $0.7451, 9:58's b/a 4.7K:300 $0.7450/$0.7797, 10:00's 200 $0.75, 10:02's 250 $0.7523, 10:05's b/a 450:400 $0.75/$0.7797, 10:08's 805 $0.7798 (705)/01, 10:09's 200 $0.7797/$0.7501, 10:10's 175 $0.7538, 10:12's b/a 250:500 $0.75/$0.7797, 10:16's 200 $0.7501, 10:20's b/a 450:400 $0.7510/$0.7797, 10:28's 545 $0.7692 (545)/$00, 10:36's 100 $0.76, 10:38's b/a 100:500 $0.76/$0.7797, 10:42's 250 $0.7601, 10:50's b/a 100:1.9K $0.7600/99.
Having reached 10.8K shares traded, that then kicked off a continuation of the extremely low/no-volume, but in a compressed $0.7600/99 (almost all $0.760x) range. B/a at 11:02 was 250:500 $0.75/$0.7699, 11:17 250:500 $0.75/$0.7699. The period ended on 11:20's 100 $0.7699.
11:21-13:03, after two no-trades minutes, began extremely low/no-volume $0.7450/$0.75, with declining range, on 11:23's 800 $0.7678/$0.75. B/a at 11:34 was 650:400 $0.75/$0.7699, 11:47 550:2.8K $0.7500/54, 12:06 4.4K:400 $0.7450/54 (bids & offers falling). Volume was interrupted by 12:11's 3.2K $0.7450/47/48/20. B/a at 12:21 was 6.6K:400 $0.7420/1, 12:33 6.8K:200 $0.7420/1, 6.8K:200 $0.7420/1, 13:02 6.7K:300 $0.7420/1. The period ended on 13:03's 900 $0.7421/0 (100)/1
13:04-14:59, after four no-trades minutes, began our oh-so-common late-day low-volume push higher doing extremely low/no-volume of course, on 13:08's 100 $0.7590. But it failed miserably as enough movement in the b/a couldn't be generated to keep moving up. B/a at 13:17 was 100:200 $0.7561/90, 13:33 6.8K:300 $0.7420/$0.76, 13:47 300:200 $0.7450/$0.76, 14:02 300:200 $0.7450/$0.76, 14:17 400:900 $0.7450/$0.7588, 14:32 400:800 $0.7450/$0.7579, 14:47 200:500 $0.7450/$0.7575. The period ended on 14:59's 100 $0.7450.
15:00-16:00, after one no-trades minute, did 15:01's 300 $0.7421 and no more trades through 15:16. B/a at 15:02 was 6.7K:400 $0.7420/$0.76, 15:17 100:1.4K $0.7500/86 (offers falling). 15:17-:25 did 5K $0.7500/$0.7429/20/$0.7561/00/61/42/61/42/61, with a $0.7511 VWAP, and then 15:29 did 666 $0.7421. Was this an MM signal? B/a at 15:32 was 104:800 $0.7500/97. 15:42 did 100 $0.7584. B/a at 15:47 was 104:300 $0.7500/95 (offers moving around up/dn) and 15:50 did 100 $0.7576. B/a at 15:56 was 6.6K:400 $0.7420/$0.76. Some steady trade began when 15:56-:59 did ~3K $0.742/$0.76 and the period and day ended on 16:00's 209 $0.77, above 15:59's last trade of $0.7420 by 3.77% and above 15:59's high of $0.76 by 1.32%. That gave us a chart-pleasing up day! Good work MM!
There were no AH trades.
There were no larger trades (>=5K) today - highly unusual, but fitting with the day's volume and price behavior.
With today's volume the only thing worth noting is that when the typical low-volume push up was attempted, it failed miserably and "they" had to revert to the MMs manipulation (see 16:00 above) to get a green day.Ending Period Period Period __Per. Trade_ Period_ % Day_ Per. End
Period Volume Low High _Dollar Val._ VWAP___ Volume Buy ~%
11:20 10775 $0.7403 $0.8026 $8,252.09 $0.7659 30.19% 21.79%
13:03 11514 $0.7420 $0.7678 $8,581.63 $0.7453 32.26% 33.54%
14:59 3100 $0.7450 $0.7680 $2,348.92 $0.7577 8.69% 38.63%
16:00 9646 $0.7420 $0.7700 $7,221.25 $0.7486 27.03% 30.90%
On the traditional TA front, movements were:
Yesterday I said { The key for me here is the greatly reduced volume, which suggests little strength for further down moves. Can't say it's the bottom yet, but looks like it could be in the next couple days (ignoring possible "Friday effect"). }. With only the open being down, this is looking to have a decent chance of being right. However, the excessively low volume, ~36K, leaves room for wild fluctuations. Steadily declining volume is one of the signs that bottoming is occurring but what we have is a drop from a rise to ~326K dropping to ~201K to ~36, which is not a steady decline. So right now I think today's low volume is less certainly an indicator of a bottom, although it still may be such.__Open_ ___Low_ __High_ _Close_ Volume_
Today -2.00% 1.41% 2.90% 1.32% -82.33%
Prior -2.61% -2.67% -5.11% -3.80% -42.76%
On my minimal chart, yesterday I noted { ... we bottomed right on the descending support (falling red line, former resistance) early and immediately began moving up - yes manipulated up, but up ... Today's "another lower low" would suggest we are at risk of breaking below. The falling, and quite low, volume argues against that though. } Looks like the falling volume spoke the truth, at least temporarily, as today our low was well above that descending support. The low moved up and away from where support resides today, ~$0.73. Tomorrow being Friday I suspect a low-volume flattish day will appear and that likely means we'll not go down to challenge that line again, unless the MM or shorters decide it's a good opportunity for them. Certain behaviors are easier with low volume.
The fast and slow EMS, which yesterday saw the fast EMA decline and the slow EMA's rate of rise decline, continued that behavior. The fast EMA is down from $0.0170 to $0.0143 above the slow EMA.
The day's range was almost completely above the mid-point of the experimental 13-period Bollinger band, which has a mid-point that flat now at $0.7417. Note that we didn't get far below the mid-point, hitting on $0.7403.
Ignoring the volume for the moment, the chart pattern's higher high and low moved range up to begin "pushing" the experimental 13-period Bollinger upper limit, $0.8046 (our high was $0.8026). In the past about half the time this would give us a small continued rise for a few days but the rises generally began on higher volume, which we don't have today.
On my one-year chart the 200-day SMA continued falling. The 50-day SMA has now been rising steadily for four consecutive days, matching my belief from a few days back of { ... if we get the behavior I expect, I expect the rise to be more sustained. }
Yesterday there was only 16/100ths of a penny down to the 20-day SMA. Today it's 23/100ths as the 20-day SMA dropped a bit. A cross of the 10 and 20-day SMAs above the 50 would be a pretty bullish indication (think MACD going bullish).
If we hold here we'll get 6 days (was 5) of rising 10-day SMA. The 20-day would have 4 (was 1 decline) days of rise, 1 day of flat, and 11 (was 4) days of rise. The 50 will go flat 1 (was rise 2) day, and begin the up/down waves with a rise of 11 (was 10) days. The 200-day would fall ~106 days and then rise about 22 (was 30) days. As always, of course we won't just "hold here - we'll be doing normal up/down waves due to various types of traders, shorters and MMs affecting the market, along with any news about the company or it's fundamentals.
Yesterday the oscillators I watch had improvement in accumulation/distribution (2nd day - unusual) and deterioration again in all others. Above neutral were RSI, MFI (untrusted by me), momentum, and full stochastic. Williams %R and ADX-related were at neutral.
Today had deterioration in accumulation/distribution (after 2 days of unusual improvement), MFI (untrusted by me), momentum, and full stochastic. Improvement occurred in RSI, Williams %R and ADX-related. Everything but accumulation/distribution and ADX-related are above neutral. Those two are both below neutral.
The experimental 13-period Bollinger limits, $0.6816 and $0.8046 ($0.6819 and $0.8027 yesterday), resumed diverging with a rising mid-point as the upper limit rose more quickly than the lower limit fell.
All in, but for the declining, and extremely low, volume, I read the conventional TA stuff (SMAs, oscillators, ...) as showing marginal improvement. The intra-day breakdown is negative in appearance due to buy percentage and VWAP behavior but could be an artifact of the extremely low volume.
In aggregate I have to assess this stuff as suggesting continued consolidation, with a best SWAG of mild bullishness, but unlikely to appear tomorrow as a "Friday effect" seems likely to appear.
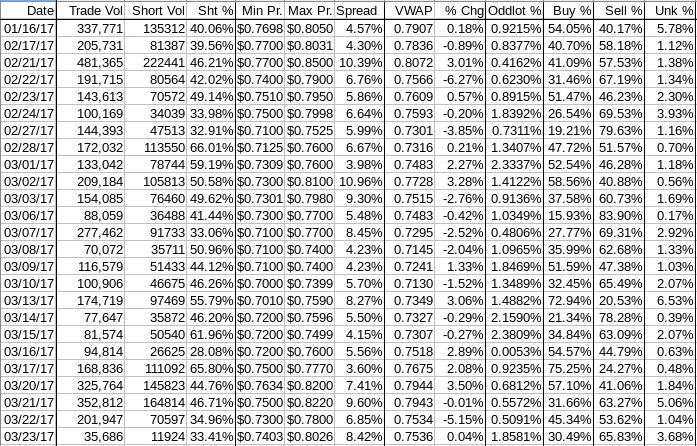
Percentages for daily short sales and buys moved in the same direction, generally good, but the buy percentage is very weak, suggesting more near-term weakness. The short percentage counters that, somewhat, as it's just a smidgen below the bottom of my desired range (needs re-check).
The spread switched from contracting to widening thanks to the early high followed by a big drop. Normally I would read this as suggesting increased likelihood of movement but the extremely low volume makes that a very unreliable indicator today. Regardless, combined with the higher range today, and my thinking that we had resumed the up-leg within consolidation I've been suggesting, I would normally assess it as supporting a continued range move up as most likely.
The VWAP's last twenty-four readings held steady at 13 negatives and 11 positives. Change since 01/16 is -$0.0371, -4.69%, and the averages of the rolling 24-day period seen in the last few days (latest first) are now -0.1655%, -0.1595%, 0.2282%, 0.3424%, 0.3026%, 0.1137%, 0.1860%, 0.1388%, 0.0588%, and -0.1941%.
All in, this stuff's conflicting signals with extremely low volume leaves me leaning toward neutral behavior - mostly sideways with a small possibility of mild positive movement within consolidation.
Bill
Join the InvestorsHub Community
Register for free to join our community of investors and share your ideas. You will also get access to streaming quotes, interactive charts, trades, portfolio, live options flow and more tools.

