


Thursday, March 16, 2017 12:06:49 PM
Nothing but short-term consolidation seems likely for now. The MMs do need to generate some volume though, so there is a possibility they will start moving range up a bit to see if they can draw in market participants. But nothing in the technical stuff I track suggests, yet, that we have a bullish bias developing within consolidation. I'm still of the belief that we have bottomed and have thus far been wrong about when and how the leg up would progress. We tried to get it going but it fizzled to to lack of interest, even with the positive PR, I guess.
Yesterday, while discussing the minimal chart, I said { ... is not supported by the volume, which was both extremely low and declining. The bad part of that is that prices are easily moved by those with the desire and means (e.g. MMs, shorters) so that if someone wants, e.g., better covering prices, relatively little money has to be deployed, in the form of shorts or distribution, to move price lower where large profits can then be locked in. }
Today contains a perfect example of that behavior, IMO, in the closing period detailed below, part of which I replicate here. { 15:51-16:00, IMO, was manipulated when a highly unusual behavior occurred as 15:51-:58 trades were 100% hitting the bid and traded exclusively $0.7308 (4.7K). }
This action took place in 45 trades, the largest was 200 shares, and the total expended on this action was $4,019.40.
The net result was that the close of $0.72 was well below the price that was indicated prior to this action, 15:50's 400 $0.74. This was a 2.70% decline
Today's early action had a lot of odd-lot trades and few non-odd-lot trades through ~10:03. Thereafter the mix was more normal, although still extremely low/no-volume. The day can be summarized as a little volatility at the beginning and end with a long, extremely low/no-volume flattish period between those periods.
There were no pre-market trades.
B/a just before open was 1K:2.5K $0.72/$0.79.
09:30-10:52 opened the day with a 730 sell for $0.7202. B/a just after open was 6.6K:6.3K $0.72/5. Then came 9:38's 10-share odd-lot $0.72, 9:48's 3-share odd-lot $0.72, 9:48's b/a 8.1K:700 $0.72/$0.7499, 10:01's 50-share odd-lot $0.72, 10:03's 80-share odd-lot x 2 $0.7201/00, 10:07's 100 $0.7499, 10:08's b/a 8K:800 $0.73/$0.7499, 10:11's b/a 140:800 $0.73/$0.7499 (those 8K $0.72 bids still presented), 10:21's b/a 240:1.5K $0.73/$0.7499 (bids backed by presented 1.8K $0.72), 10:30's 600 $0.7474 (500)/$0.73, 10:31's 21-share odd-lot $0.7499, 10:33's b/a 240:280 $0.73/$0.749 (bids backed by presented 1.4K $0.72), 10:37's 250 $0.7490/$0.7386, 10:40's 300 $0.7490/$0.73, 10:41's 4.6K $0.7490 (4K)/$0.73, 10:44's 719 $0.7301 (619)/00, 10:46's 400 $0.73, 10:47's b/a 110/400 $0.7218/$0.7450 and the period ended on 10:52's 2.1K $0.7370/$0.7218.
10:53-12:47 began extremely low/no-volume (no trades 10:53-11:33 but for a couple odd-lots) $0.7218/84, with very slowly falling range. B/a at 10:53 was 100:400 $0.7218/$0.7450, 11:02 100:400 $0.7218/$0.7450, 11:21 200:500 $0.7218/$0.735, 11:32 200:600 $0.7218/$0.7350. The period's first trade was 11:34's 100 $0.7284 and it broke the string of no-trades minutes and then continued it with no trades 11:35-12:01. B/a at 11:36 was 200:700 $0.7218/$0.7350, 11:47 200:700 $0.7218/$0.7350. 12:02's 200 $0.7128 broke the no-trades minutes string. B/a at 12:02 was 200:700 $0.7218/$0.7350. B/a at 12:09 was 6.8K:410 $0.72/$0.7318,
A range down to $0.7200/99 began to emerge at 12:11. B/a at 12:19 was 6.9K:300 $0.72/$0.7318, 12:32 7.1K:300 $0.72/$0.7318, 12:47 5.1K:1.7K $0.7200/48. The period ended on 12:46-:47's 6.8K $0.7200/11/10/24/10/11/00.
12:48-13:43 began extremely low/no-volume $0.7300/4, with falling highs, on 12:50's 2.1K $0.7233/17/33/00/59/$0.7309/00. B/a at 12:58 was 18.1K:300 $0.7300/4 (west coasties arrival?), 13:08 18K:200 $0.7300/3, 13:12 18K:300 $0.7300/2. Volume was interrupted by 13:14's 19.3K $0.73 (19.2K incl 18.2K blk)/$0.7295. B/a at 13:17 was 5.1K:1.2K $0.7200/88. Price range was interrupted by 13:22's 700 $0.7267/55/$0.73. B/a at 13:26 was 1.3K:400 $0.7300/2, 13:32 1.3K:400 $0.7300/2. Price was again interrupted by 13:32's 3.8K $0.7301/02/01/02/10/02/10 .../02. B/a at 13:36 was 1.3K:400 $0.7300/1. The period ended on 13:43's 150 $0.7301.
13:44-15:23 during the first six no-trades minutes had 13:47's b/a 1.4K:400 $0.7300/1. Trade began extremely low/no-volume $0.72/3, with slowly rising range (a stealth rise for shorters benefit?), on 13:50's 5.1K $0.7301/00/$0.7299/98/00 (3.4K). B/a at 14:04 was 5.1K:300 $0.72/$0.7301, 14:17 6.8K:400 $0.72/$0.7301, 14:27 400:300 $0.7280/$0.7301 (bids jiggling 80/81 and rising), 14:32 300:300 $0.7286/$0.7301 (bids rising). 14:42's 100 hit $0.7307. B/a at 14:46 was 1.4K:500 $0.7300/10. 14:58's 2.9K hit $0.7310. B/a at 15:02 was 600:240 $0.7303/50. 15:04's 140 hit $0.7349 and 15:09's 100 hit $0.7350. B/a at 15:12 was 200:300 $0.7303/$0.7499, 15:14 1.1K:240 $0.7304/$0.74. 15:14's 200 hit $0.74. B/a at 15:17 was 1.1K:240 $0.7304/$0.74. 15:20's 1.4K hit $0.7400/99 (1.2K). B/a at 15:23 was 300:300 $0.7306/$0.7480. The period ended on 15:23's 4.2K $0.7458 (2.5K)/79/80.
15:24-15:50, after six no-trades minutes began extremely low/no-volume $0.7306/$0.74 on 15:30's 318 $0.7306/$0.7480. B/a at 15:34 was 200:300 $0.7306/$0.7480, 15:50 1.1K:5.8K $0.7307/$0.74. The period ended on 15:50's 400 $0.74.
15:51-16:00, IMO, was manipulated when a highly unusual behavior occurred as 15:51-:58 trades were 100% hitting the bid and traded exclusively $0.7308 (4.7K). The period and day closed on 15:59's 1.3K $0.7308/$0.7280/$0.74 (100)/$0.7220 and 16:00's 1,880 $0.72.
There were no AH trades.
Excluding the opening and closing trades (didn't qualify), there were 2 larger trades (>=5K & 1 4K+) totaling 23,000, 28.20% of day's volume, with a $0.7283 VWAP. Nothing to comment on with the day's low volume, other than the count is likely reasonable and the percentage of day's volume seems normal thanks to the one "larger larger trade".
MEH!Ending Period Period Period __Per. Trade_ Period_ % Day_ Per. End
Period Volume Low High _Dollar Val._ VWAP___ Volume Buy ~%
10:52 9894 $0.7202 $0.7499 $7,320.22 $0.7399 12.13% 67.77%
12:47 7200 $0.7200 $0.7299 $5,190.66 $0.7209 8.83% 39.61%
13:43 26785 $0.7200 $0.7310 $19,542.92 $0.7296 32.84% 26.86% Incl 13:14 $0.7300 18,200
15:23 22737 $0.7200 $0.7499 $16,614.25 $0.7307 27.87% 34.31% Incl 14:19 $0.7220 4,800
16:00 13061 $0.7200 $0.7480 $9,553.61 $0.7315 16.01% 34.03%
On the traditional TA front, movements were:
Although the volume rose on this down day it remained so low and the rise was so small that I don't think we can read it as suggesting strengthening decline is likely. I think it's just MMs and shorters doing their things.__Open_ ___Low_ __High_ _Close_ Volume_
Today -3.97% 0.00% -1.28% 0.00% 5.06%
Prior 6.99% 2.71% 0.08% -1.71% -55.56%
On my minimal chart we have an http://thepatternsite.com/HammerInv.html" rel="nofollow" target="_blank" >a gravestone doji, ... They believe that it signals a bearish reversal. It does, but only 51% of the time. I call that random.
Given our history, I guess inverted hammer is more likely. But even so, if it breaks up, as Bulkowski says it does 35% of the time, it has good performance with a bullish reversal during a bearish trend.
Range today continued just below the descending consolidation triangle's resistance (descending red line) and well above the triangle base and the rising medium-term potential support (orange line).
As with yesterday, the weakness indicated by a lower high and the intra-day behavior is not supported by the volume, which was extremely low. It rose, but only marginally. As with yesterday, the bad part of that is that prices are easily moved by those with the desire and means (e.g. MMs, shorters). See discussion above.
The fast and slow EMS continue to weaken and the fast EMA is still below the slow, although by a slightly smaller margin, $0.0133 vs. $0.0167.
Also as with yesterday, most of the day's range was above the declining mid-point of the experimental 13-period Bollinger band.
Yesterday I noted { In aggregate, we did get some of what has been hoped for, and called for during the prior several days - a continuation of the leg-up that began two days ago. It wasn't a big continuation though and as we approach the descending resistance we should expect at least hesitation if not outright reversal to a leg lower. This "hesitation" should continue the low volume, although slightly higher volume would be no surprise if shorters decide covering buys look attractive. }
Today we gave up the small gain even though we didn't do an actual reversal. So far, playing out as suggested.
It's a tough market when all the participants, almost I think, are MMs and shorters.
On my one-year chart the pull up and away from the long-term descending support (former resistance) line continued, but thanks to the drop of the line, not a rise in range. As I said, { If we can just at least remain flat the odds become greater that if later we do sag we will not get back to that line as other support points may come into play. }
The 200-day SMA continued falling. The 50-day SMA had made its cross to rising. Today it declined 2/100ths of a penny. Any noticeable price rise should start the rise again.
The 10-day and 20-day SMAs continued declining. The 10-day moved from 1.9 to 1.95 cents below the 20-day.
If we hold here we'll get 3 (was 4) day of declining 10-day SMA. The 20-day would have 13 (was 14) days of decline. If we hold here the 50 will decline 9 days (was 1 rising) and then begin a series of "waves" of declines and rises. The 200-day would fall ~153 (was ~153) days.
Yesterday the oscillators I watch had weakening in RSI, accumulation/distribution, momentum, Williams %R (entered oversold), and ADX-related. Improvement occurred in MFI (untrusted by me), and full stochastic (exited oversold).
Today had a flat RSI and Williams %R. There was improvement in momentum and full stochastic. Weakening occurred in accumulation/distribution, MFI (untrusted by me) and ADX-related.
The experimental 13-period Bollinger limits, $0.6915 and $0.7750 ($0.6937 and $0.7774 yesterday), are converging as the upper limits falls faster than the lower limit. The mid-point continues to decline. Our trading range was wrapped around that mid-point and fairly well centered on it.
All in, still no suggestion in sight that the leg up will resume. The weak volume on a mildly weakening day suggests no strength in a down move. Continued consolidation behavior seems most likely near-term.
Percentages for daily short sales and buys moved in the same direction, good, but the short percentage is really excessive now. This makes me think the shorters are doing their thing in a low-volume market to scalp small profits, shorting in the early highs and letting the covering buys occur when the MMs or other shorters hit standing bids. OTOH, this would also be symptomatic of predominantly MM behavior, which seems more likely to me.
The buy percentage rose but is still well below the range to maintain any possibility of a rise. However, this could be due to MM behavior as they naked short the market and then sit on the bid, collecting the fees from the exchanges along with any profits from the trades themselves.
The spread narrowed for the second day and is now just a bit wider than what I would expect in short-term consolidation. Being produced by volatility at the start and end of the day with a very long, extremely low/no-volume flattish period in between, I think this is telling truth, especially when the day's volume is factored in.
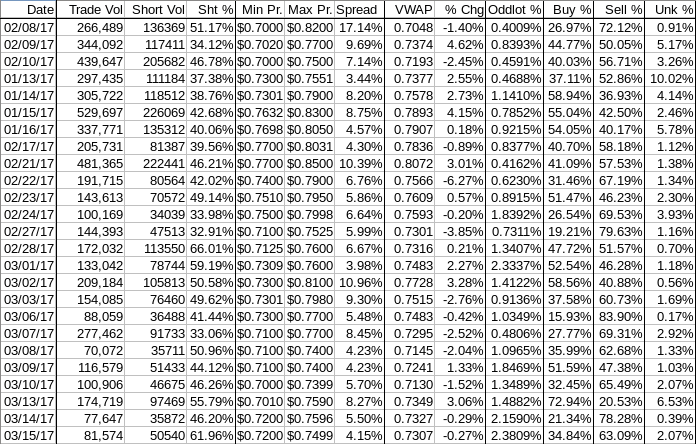
The VWAP's last twenty-four readings held steady at 12 negatives and 12 positives for the third consecutive day. Change since 02/08 is $0.0259, 3.67%, and the averages of the rolling 24-day period seen in the last few days (latest first) are now 0.1860%, 0.1388%, 0.0588%, -0.1941%, -0.2735%, -0.5653%, -0.5663%, -0.1786%, 0.2106%, and 0.3104%.
All in, nothing better than short-term consolidation is suggested right now.
Bill
Join the InvestorsHub Community
Register for free to join our community of investors and share your ideas. You will also get access to streaming quotes, interactive charts, trades, portfolio, live options flow and more tools.

