


Friday, February 17, 2017 8:57:08 AM
Lots of mixed signals in the (un)conventional TA today leaves me thinking we are beginning a short-term consolidation with a mild negative bias near-term.
The day's VWAP was marginally higher but I would call it flat. The intra-day behavior was predominately flattish, with the usual variances high and low, but with the magnitude to the low side larger than that to the high side from the open. Further, the last half of the day was a bit close to the low range than the high and the close exhibited little upward bias. All this was on volume down ~36% and in the last day of my "three-day window".
There were no pre-market trades.
B/a just before open was 100:100 $0.7501/$0.7999.
09:30-10:28 opened the day with a 2,419 buy for $0.80 & $0.80 x 301, $0.7999 x 100, 100, $0.79 x 150, $0.80 x 200, x 4.8K, 800, $0.8001 x 100. B/a at 9:30 was 22.2K:1.4K $0.8000/49. Then came 9:32's 100 $0.80, 9:34's 38.5K $0.8000/10/00/01/00/$0.79/$0.7700/05/06/05/18/31/$0.78/$0.7788/ ... $0.7799/$0.78/$0.7799, 9:36's 1.7K, 9:35's 1.8K $0.7710/$0.7698/$0.78/$0.7788/ ... $0.7799/$0.78, 9:36's 1.6K $0.7812/11/98.11/$0.7993/$0.7811, 9:42's b/a 800:400 $0.7710/$0.79.
That began extremely low/no-volume $0.78/9 with rising lows and highs. B/a at 9:48 was 300:800 $0.7820/$0.79, 9:51 500:2.3K $0.7900/69, 9:56 600:800 $0.7900/92, 9:59 600:65 $0.7900/1 (offers backed by presented 800 $0.7950. At 10:00 the range moved the lows up, doing $0.7825/$0.79 with rising lows. The period ended on 10:28's 109 $0.7849.
10:29-11:11 began extremely low/no-volume $0.7829/$0.7908, with falling highs, on 10:29's 12.2K $0.7990/92/$0.7849/40/49/50/97/99/65/$0.7900/50/11/12/92/12/92/$0.80/$0.7993/$0.80/$0.7916. B/a at 10:35 was 700:600 $0.7831/$0.7950. The period ended on 11:11's 1.8K $0.7827/9.
11:12-11:49, after five higher-volume minutes doing $0.7829/$0.795, beginning with 11:12's 19.7K $0.7829, trade began extremely low/no-volume $0.785/$0.7938, with highs falling quickly to $0.7891. B/a at 11:32 was 12.8K:600 $0.7850/97, 11:47 12.7K:300 $0.7850/96. The period ended on 11:49's1K $0.785.
11:50-12:11 began a higher-volume climb on 11:53's 13.4K $0.7982/$0.7894/75/$0.70/41/49/$0.7889/90/75/$0.79/$0.7889/$0.7900/49/41/$0.7850/58/56. Price hit $0.8001 on 12:00's 35.1K $0.7989/90/89/00/89/45/89/90/94/40/89/97/69/53/8990/97/$0.80/$0.7900/40/69/45/89/45/$0.79/$0.80/ ... $0.7973/... $0.8000/1/0. B/a at 12:01 was 24.8K:1K $0.8000/45. Price hit $0.8044 on 12:04's 6.1K $0.8003/$0.79/$0.8003/2/1/$0.7972/79/15/$0.8044. The period ended when price hit $0.8050 on 12:11's 10K $0.7966/$0.80/$0.7966/... $0.8044/40/00/$0.7966/$0.8000/44/$0.7988/$0.8048/... $0.8050.
12:12-12:32 began extremely low/no-volume $0.7949/$0.80, with rising lows, on 12:12's 1.8K $0.7831/37/36. B/a at 12:28 was 400:600 $0.7981/$0.80. The period ended on 12:32's 300 $0.7999.
12:33-14:23 began a rapid low-volume drop, followed by a partial claw back up, on 12:33's 1.9K $0.7982/01/02. Price bottomed on 12:34's 3.1K $0.79/$0.7805. That began an extremely low/no-volume rise from $0.7805. B/a at 12:42 was 2.3K:200 $0.7800/07. 12:45's 300 hit $0.7825, 12:46's 100 hit $0.7849, 12:51's 1K hit $0.7886. That began extremely low/no-volume $0.7801/49, with slowly rising lows. B/a at 12:54 was 2.4K:200 $0.7800/50, 13:02 6K:100 $0.7830/50. After 13:09 range was narrowed to $0.7852/3. B/a at 13:17 was 200:1.2K $0.7850/91, 13:32 6.1K:200 $0.7850/3, 13:47 6.1K:100 $0.7850/3, 14:02 6.2K:300 $0.7850/3, 14:17 6.4K:300 $0.7850/3. The period ended on 14:23's 300 $0.7853.
14:24-16:00, after five no-trades minutes, began an extremely low/no-volume, very small, rise from $0.7853 on 14:29's1.1K $0.7873. B/a at 14:32 was 700:1.3K $0.7853/91 (offers being rattled 91/2). 14:38's 4K hit $0.7870/87. 14:58's 200 dropped lows back to $0.7853. B/a at 15:02 was 6.4K:1.1K $0.7850/75. Volume was interrupted by 15:04's 7.5K $0.7857. 15:07's 100 moved the highs to $0.7896. B/a at 15:24 was 21.8K:300 $0.7850/95. Range opened back up on 15:29's 2.6K $0.7891->$0.7850, but again collapsed, to $0.7861/2 at 15:45 and then $0.7850/1 at 15:49. B/a at 15:35 was 21.1K:800 $0.7850/70. Trade volume went low/medium at 15:42. B/a at 15:48 was 14.2K:3.3K $0.7850/1, 15:59 11K:300 $0.7850/97. The period and day ended on 15:59's 11.3K $0.7898 (100)/$0.7850 and 16:00's 623 $0.7850.
There were no AH trades.
Excluding the opening and closing trades (didn't qualify), there were 17 larger trades (>=5K & 4 4K+) totaling 109,683, 32.47% of day's volume, with a $0.7927 VWAP. For the volume, the count seems reasonable but the percentage of day's volume seems a bit on the high side, although not egregiously so. Of note is the VWAP is above the day's $0.7907. This makes me think the larger trades today had a smaller cadre of the more astute investors/traders. Being the second day of my "three-day window" for pops on catalysts, this is not unexpected. Of course, this bunch may be just as astute but be long-term investors that are less concerned with short-term penny prices changes than would be day and momo traders. In that case tehy may be just as astute or even more so.
Compared to the prior two days, the number of "larger larger trades" is reduced. Note also the buy percentage note only began much weaker than yesterday, but it ended marginally lower than yesterday's ending value (see table below). The VWAP was more stable today, suggesting the the impetus upward seen yesterday has begun to abate.Ending Period Period Period __Per. Trade_ Period_ % Day_ Per. End
Period Volume Low High _Dollar Val._ VWAP___ Volume Buy ~%
10:28 93482 $0.7698 $0.8010 $73,904.11 $0.7906 27.68% 33.29% Incl 09:30 $0.8000 4,800 09:34 6,666
09:34 $0.8010 6,666 $0.8000 5,000 5,000
09:34 $0.7900 4,641 10:04 $0.7800 8,200
11:11 37960 $0.7825 $0.8000 $29,978.69 $0.7897 11.24% 41.98%
11:49 45668 $0.7829 $0.7950 $35,969.56 $0.7876 13.52% 47.56% Incl 11:12 $0.7829 9,900 11:14 $0.7950 8,200
11:17 $0.7900 8,300
12:11 72104 $0.7850 $0.8050 $57,517.79 $0.7977 21.35% 58.54% Incl 11:53 $0.7982 4,800 12:00 $0.7989 7,000
12:00 $0.7990 4,500 $0.8000 6,415
12:32 9887 $0.7931 $0.8000 $7,883.48 $0.7974 2.93% 56.72%
14:23 23433 $0.7801 $0.7982 $18,393.52 $0.7849 6.94% 57.64%
16:00 52153 $0.7850 $0.7899 $40,993.65 $0.7860 15.44% 53.95% Incl 15:04 $0.7857 7,500 15:45 $0.7861 6,000
15:59 $0.7850 6,095
On the traditional TA front, movements were:
Three of the five metrics are showing reduced strength - a lower high, close and volume are all saying the move up will be a struggle. The good news is that the reduced volume on a down day suggests there's not yet any strength in the down move even though volume was still pretty good for this stock.__Open_ ___Low_ __High_ _Close_ Volume_
Today 1.27% 0.86% -3.01% -1.88% -36.23%
Prior 5.61% 4.53% 5.06% 3.90% 73.26%
Time for a new minimal chart.

On my minimal chart note the long descending red line and the horizontal white line. The most important of these, for the moment, is the white line. The marks the item I mentioned yesterday: { The high hit a point which may offer a pause, or even confirmed resistance, set by the low of the middle of the "M" pattern (11/3-12/20/16) that began the latest big down move. This is at $0.83 and also a 50% re-trace of the recent low/high range. }
Based on yesterday's topping there, and today's recoil from that line, I have to suspect this is a resistance point. I can't sy yet that it is because we have only the origin and one "touch" point where we respond to its presence. The waters are also muddied by the descending red line, now a confirmed resistance due to the origin and two touched that responded to its presence. But again, the waters get muddied by the white line's presence here. Uncertainty will have to rule a while longer I guess.
The good news is that volume was down on this weaker day, offering hope that we may yet push on through $0.83, but if my "three-day window" holds water it's unlikely to happen right away. The green line offers hope, but it's a very short-term line and should not be given to much weight yet.
The fast EMA is still above the slow EMA though and is still rising, so don't abandon hope yet. Just don't give it too much weight in your decision-making right now.
On my one-year chart the 50 and 200-day SMAs continue falling. The 20-day SMA continued the small rise begun two days back. The 10-day stopped decreasing after three consecutive days and made a small rise. If we hold here we'll get 8 days (was 9) of rising 10-day SMA. The 20-day would have 6 (was 7) days of rise and a return to descending for 3 (was 2) days and then would begin rising for 9 days. If we hold here the 50 would decline 10 (was 10) days, and the 200-day would fall ~130 days.
Yesterday the oscillators I watch had, for the second consecutive day, improvement in every oscillator I watch. Everything but MFI (untrusted by me), Williams %R, and accumulation/distribution, were above neutral.
Today had weakening in RSI, accumulation/distribution and ADX-related. We had improvement in MFI (untrusted by me), momentum, Williams %R, and full stochastic. RSI, momentum and full stochastic are above neutral and accumulation/distribution, MFI, Williams %R, and ADX-related are below neutral.
The experimental 13-period Bollinger limits, $0.6783 and $0.8527 ($0.6781 and $0.8553 yesterday), stopped converging as the upper limit rose more quickly than the lower limit. The mid-point is rising marginally.
All in, in spite of the lower volume on a down day, I have to think the oscillators going from all improving to mixed, especially in more important ones such as RSI, suggests near-term no strengthening in price. That's countered, somewhat, by having more above neutral. In aggregate I would judge these are suggesting we are likely entering a short-term consolidation with no bias yet determinable. History would suggest a negative bias and getting ready to exit my "three-day window" would support that.
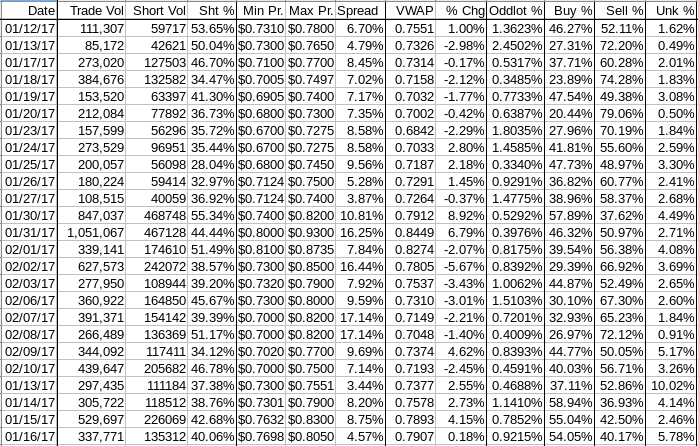
Percentages for daily short sales and buys moved in the same direction, good, and the short percentage is right in the middle of my desired range while buy percentage is still in an area that says we could have some near-term appreciation. These two are, in aggregate, positive.
The spread contracted substantially and is now in a range such that consolidation seems more likely than not. The only real negative is that the intra-day action that produced it had a much larger magnitude down to the low than the magnitude to the high after the open. This suggests a negative bias. Having said that, after the low was set quite early in the session a flattish two-cent spread held on low/medium volume until the mid-day bump up to set the high occurred. This was followed by a drop back to just below the bottom of the prior flattish range and a flattish range at that level into the close.
So the negative bias was really strong, but it is there.
Today's VWAP was up, but marginally. I'll call it flat. Combined with the volume down ~36% I think it is suggesting consolidation with a mild negative bias.
The VWAP's last twenty-four readings held, for the third consecutive day, 14 negative and 10 positives. Change since 01/12 is $0.0356, 4.72%, and the averages of the rolling 24-day period seen in the last few days (latest first) are now 0.2502%, 0.2845%, 0.2139%, 0.0172%, -0.1548%, -0.1396%, -0.2936%, -0.0947%, and 0.3236%. It's been nice seeing four positive numbers.
All in, I think this stuff, combined with the positive, but less so, intra-day behavior, suggests we are entering a short-term consolidation with a mild negative bias.
Bill
Join the InvestorsHub Community
Register for free to join our community of investors and share your ideas. You will also get access to streaming quotes, interactive charts, trades, portfolio, live options flow and more tools.

