


Monday, February 13, 2017 9:02:03 AM
Today was the first day of my "three-day window" for catalyst events and a Friday, often a flat lackluster day. Keep these items in mind when thinking about the stuff seen below.
Both the conventional and my unconventional stuff are not suggesting near-term strength. The conventional stuff has begun developing a negative bias, although it's still early and quite mixed, and my unconventional stuff is suggesting near-term weakening as most likely - in fact almost certain.
There was one pre-market trades: $0.7354 x 100.
B/a just prior to open was 100:600 $0.7102/$0.7354.
09:30-09:45 opened the day with a 24,056 buy for $0.73 & $0.7350 x 100, $0.7302 x 4K, $0.7301 x 600, $0.7300 x 820. Then came 9:30's b/a 14.2K:1.7K $0.7300/25, 9:31's 18.2K $0.7325/01/00/$0.7218/00/$0.7102/99/00, 9:32's 4K $0.7174/00/09/00/94/00, 9:33's 15.9K $0.7136/15/00/79/00/40/51/50/40/50/80, 9:35's 2.1K $0.7100/15, 9:36's 1.2K $0.7169/15, 9:37's 1.1K $0.7102/64, 9:38's 691 $0.7101, 9:40's 25.1K $0.7115/13/00 (22.6K)/14/04/ ... 10/11/12, 9:41's 5.1K $0.7110/01/19/15, 9:42's10.7K $0.7127/15/00/15/26/00/12/10/00, 9:43's 24.9K $$0.7116/00/12/00/10/00, 9:44's 15.4K $0.7099/20/00/05/20/00/10/20/95, and the period ended on 9:45's 500 $0.7087.
09:46-10:19 began an initially medium/high-volume, that became extremely low/no-volume at 9:55, rise on 9:46's 2K $0.7086/82/00/80/02. 9:51's 2.8K hit $0.7090/$0.71. B/a at 9:55 was 100:2.1K $0.7100/99. 10:00's200 hit $0.714. B/a at 10:05 was 1.1K:1.5K $0.7118/89. 10:05's 1K hit $0.7183. B/a at 10:12 was 100:1.5K $0.7169/77 (offers falling). The period ended on 10:19's 6.1K hit $0.717/$0.7298.
10:20-14:46 began extremely low/no-volume $0.7209/98, with falling highs, after 10:20-:22's 17K $0.7249/19/18/17/00/16/01/02/9802/03/50/92/98/97/02/00/03/02/0102/98/01/02/03/98. B/a at 10:30 was 600:800 $0.7200/97 (offers falling), 10:43 300:700 $0.7200/97, 10:48 200:500 $0.7200/61.
Volume switched to very low volume 10:51-11:00 and then reverted to extremely low/no-volume. B/a at 11:03 was 400:200 $0.7200/04, 11:05 300:200 $0.7201/10, 11:10 100:200 $0.7201/52. 11:17-:21 went medium/high-volume and then reverted to extremely low/no-volume. Volume was interrupted by 11:33's 20.3K $0.7200/1.
B/a at 11:38 was 300:200 $0.7200/1, 11:47 300:300 $0.7200/1. Volume was interrupted by 12:37's $0.7201. B/a at 12:49 was 200:300 $0.7200/1. Volume was interrupted by 12:42's 5.1K $0.7200/1 and 12:46's 12.8K $0.7200/1. B/a at 13:11 was 1.4K:400 $0.7200/1, 13:33 1.4K:500 $0.7200/1.
Price and volume were interrupted by 13:38's 4.1K $0.7144/$0.72. B/a at 13:54 was 1.2K:400 $0.7200/1. Volume was interrupted by 13:56's 6.2K $0.7200/1.
Price and volume were interrupted by 14:02's 6.3K $0.7277/10/00/99/00, 14:07's 1.3K $0.7200/99 and 14:09's 11.5K $0.72. B/a at 14:11 was 17K:1.5K $0.7200/$0.7232, 14:18 17.7K:485 $0.7200/04, 14:29 23.7K:585 $0.7200/3. The period ended on 14:46's 273 $0.7203.
14:47-16:00 began with a spike higher on 14:47's 13.8K $0.7226/03/00/30/50/$0.73/$0.7231/29/15/29/31/25/50/25/63/24/12/22, 14:48's b/a of 5.8K:3K $0.7310/50 and 14:50's 100 $0.745. That began extremely low/no-volume $0.7310/$0.74, with high dropping quickly to $0.7361. B/a at 14:57 was 5.2K 1.6K $0.7310/$0.7447, 15:04 1.6K:400 $0.7318/$0.74. The period and day ended on 15:59's 1.5K $0.7312 and 16:00's 885 buy for $0.75, up 2.6% from the last 15:59 trade.
There were no AH trades.
Including the opening trade (closing didn't qualify), there were 23 larger trades (>=5K & 7 4K+) totaling 168,706, 38.37% of day's volume, with a $0.7214 VWAP. Excluding the opening trade, there were 22 larger trades totaling 144,650, 32.90% of day's volume, with a $0.7199 VWAP. For the volume I think the count is in a normal range. The percentage of day's volume is again high. Both VWAPs are above the day's $0.7193. Combined with the rising volume, larger trades count and percentage of day's volume, I suspect we're seeing some bullishness. But the buy percentages (see below) suggest it's not a strong bullish sentiment and the VWAP is down ~2.5% from yesterday.
This might be the normal "three-day window" behavior taking effect as the new trend begins to develop. If might also be "Friday effect".
Note the first and third periods had about the same volume, close to the same VWAPs and buy percentages, neither one very strong. They also had almost all the day's larger trades. With those buy percentages and number of larger trades I suspect the day's short percentage will be higher (haven't peeked yet) ... Yep!Ending Period Period Period __Per. Trade_ Period_ % Day_ Per. End
Period Volume Low High _Dollar Val._ VWAP___ Volume Buy ~%
09:45 158335 $0.7000 $0.7354 $113,413.81 $0.7163 36.01% 41.46% Incl 09:30 $0.7300 24,056 09:31 6,107
09:31 $0.7300 7,419 09:33 $0.7179 4,300
09:40 $0.7100 7,500 11,800
09:42 $0.7127 5,000 09:43 $0.7100 4,500
09:44 $0.7099 5,000
10:19 55767 $0.7000 $0.7298 $39,463.57 $0.7077 12.68% 47.02% Incl 09:50 $0.7034 4,000
14:46 159958 $0.7144 $0.7299 $115,411.11 $0.7215 36.38% 40.81% Incl 10:20 $0.7200 4,900 11:17 $0.7200 10,000
11:19 $0.7203 4,900 11:21 $0.7248 7,100
11:33 $0.7200 4,000 15,300 12:42 5,000
12:46 $0.7200 6,400 14:02 $0.7277 5,000
14:09 $0.7200 9,600
16:00 63578 $0.7200 $0.7500 $46,524.83 $0.7318 14.46% 40.18% Incl 14:47 $0.7226 6,000 14:48 $0.7400 4,924
15:06 $0.7314 5,900
On the traditional TA front, movements were:
*Yesterday's high was an AH $0.77. The real high was $0.76. Using that, today's high movement would be -1.32% instead of the -2.6% we got.
          __Open_ ___Low_ __High_ _Close_ Volume_
 Today      3.99%  -0.28%  -2.60%   1.63%  27.77%
 Prior     -2.50%   0.29%  -6.10%*  5.13%  29.12%
On my minimal chart price topped right at the $0.75 potential resistance (horizontal white line) and closed there on volume rising for the second consecutive up day. As with yesterday our low was back inside the consolidation triangle's descending support (upper orange line), making a slightly lower low ($0.702->$0.70 today), but we recovered, and closed, above it. In aggregate, this seems positive to me.
However, our high was lower, even using yesterday's official $0.76 low.
The fast EMA continues below the slow EMA for the fifth day but is rising for the second consecutive day. If our high hadn't been lower I would be seeing all this as quite bullish. As it is, I come to a cautiously bullish conclusion on this stuff.
On my one-year chart the 50 and 200-day SMAs continue falling. The 20-day SMA continued the falling begun four days ago while the 10-day continues slightly increasing. If we hold here we'll get 4 more days of falling 10-day SMA (was 4 rising). The 20-day would have 1 (was 2) days of decline, nine days of rise and a return to descending. If we hold here the 50 would decline eighteen days, and the 200-day would fall ~170 days.
Yesterday the oscillators I watch had weakening only in momentum and had improvement in everything else. Only MFI (untrusted by me) was above neutral. Williams %R and full stochastic were still oversold.
Today had improvement in RSI, accumulation/distribution, Williams %R (got out of oversold, barely), and full stochastic (got out of oversold, barely). We had weakening in MFI (untrusted by me), momentum, and ADX-related.
The experimental 13-period Bollinger limits, $0.6683 and $0.8482 ($0.6616 and $0.8487 yesterday), continue converging with a rising mid-point as the lower limit rises faster than the upper declines.
All in, we end a bit less positive than yesterday. The oscillators had several flip from going positive to going negative as we made a higher low and lower high on rising volume. Yesterday I noted { The biggest negative is that the upward tilt is not yet supported by the momentum oscillator, but the rising volume combined with the other oscillators seem to override that concern. } Well, unless today is just a "Friday effect", which is certainly possible, the "seems to override" part was off-base. Also, we're in the first day of the "three-day window" I use following a catalyst. Since we had no sustained push up I have to think the window was not applicable this time around. All this makes me think we are already entering near-term consolidation with a negative bias.
Percentages for daily short sales and buys moved in opposite directions again and the short percentage is marginally above my desired range (needs re-check) while the buy percentage is into the area that says near-term movement higher is unlikely. However, this could be a "Friday effect".
The spread continues to shrink, using the all the numbers, but is still wider than what I'd like to see for consolidation and since we aren't in a strongly developing up trend I suspect this spread is not good. It was produced by a larger magnitude move lower, post-open, than the move higher magnitude, post-open.
The killer is the VWAP movement.
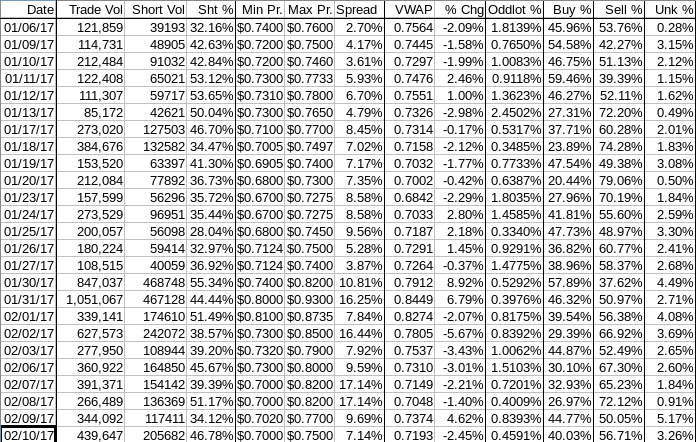
The VWAP's last twenty-four readings held for the third day at 16 negatives and 8 positives. Change since 01/06 is -$0.0371, -4.90%, and the averages of the rolling 24-day period seen in the last few days (latest first) are now -0.1548%, -0.1396%, -0.2936%, -0.0947%, 0.3236%, 0.2455%, 0.2829%, 0.4414%, and 0.4984%.
All in this stuff suggests no near-term upside is likely and the short and buy percentages suggest near-term weakening as most likely.
But today is Friday ...
Bill
Join the InvestorsHub Community
Register for free to join our community of investors and share your ideas. You will also get access to streaming quotes, interactive charts, trades, portfolio, live options flow and more tools.

