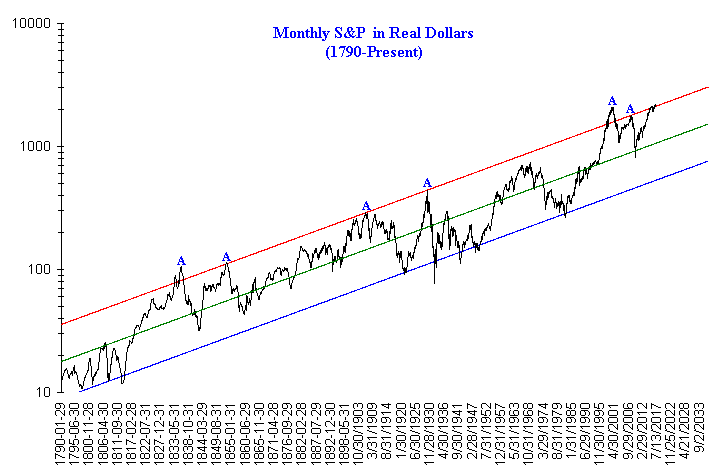
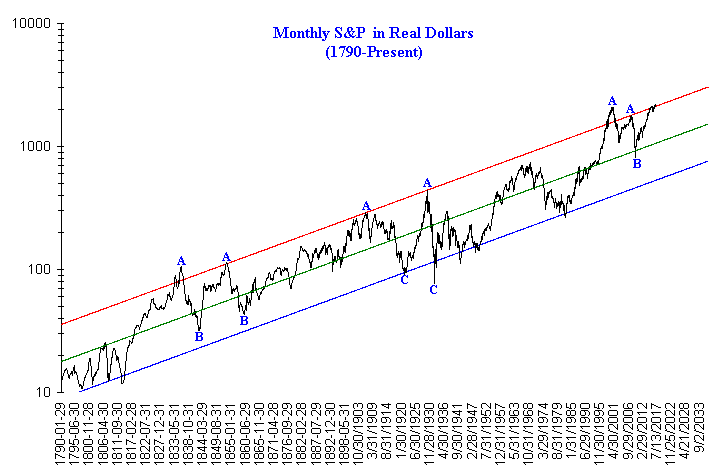
The S&P, adjusted in "Real Dollars", continues to trade near the top of its longer term upward channel. This has been going on for the last two years. As I have pointed out before it's been rare to see the S&P near the top of its longer term upward channel (points A).
Furthermore each time the S&P has reached the top of its longer term upward channel it has eventually gone through a substantial correction. In three of the cases it dropped back below its long term mean as defined by the green line (points B) and in the other two cases it dropped all the way back to the bottom of the upward channel (points C). This is why I still remain very cautious about the market in the years ahead.
Click on "In reply to", for Authors past commentaries
Information posted to this board is not meant to suggest any specific action, but to point out the technical signs that can help our readers make their own specific decisions. Your Due Dilegence is a must! • DiscoverGold
Register for free to join our community of investors and share your ideas. You will also get access to streaming quotes, interactive charts, trades, portfolio, live options flow and more tools.


 News
News  Market Data
  Discover