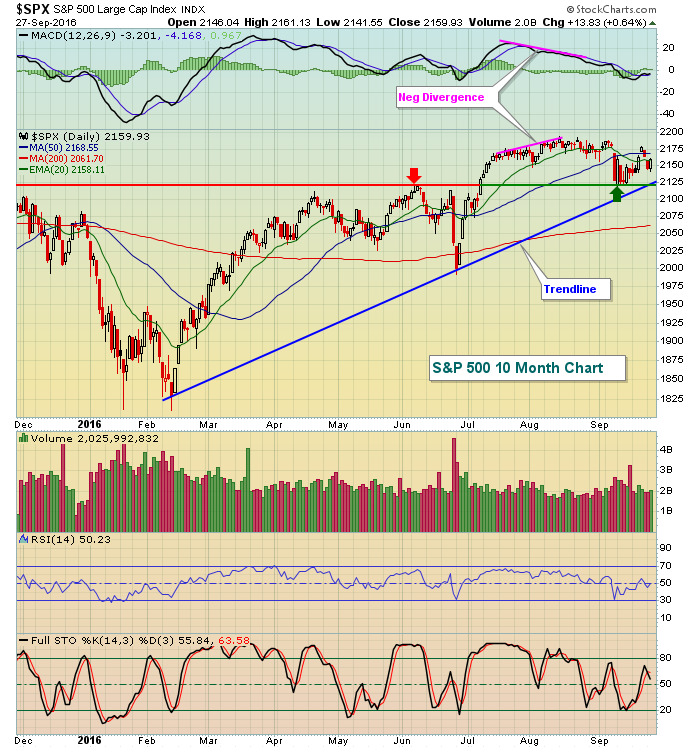
It's been a week, so let's take a look at the daily chart of the S&P 500 and see where we stand:
We had previously discussed the negative divergence that emerged in August and that slowing momentum issue has since been resolved with the MACD now hovering close to its centerline. For me, it now comes down to price support vs. price resistance. We're consolidating and I wouldn't expect too much in either direction until we break out or break down. The key range for now is 2120-2190. There is one problem on the next breakout - and it could be a biggie. The weekly MACD is now pointing lower so another weekly close at an all-time high will most likely result in a negative divergence on the longer-term chart and those can be problematic for weeks or even months. Occasionally, they mark a major top to begin a bear market. But we'll worry about that when we get there. In the meantime, expect more consolidation with the aforementioned price levels marking key support and resistance.
Click on "In reply to", for Authors past commentaries
Information posted to this board is not meant to suggest any specific action, but to point out the technical signs that can help our readers make their own specific decisions. Your Due Dilegence is a must! • DiscoverGold
Register for free to join our community of investors and share your ideas. You will also get access to streaming quotes, interactive charts, trades, portfolio, live options flow and more tools.


 News
News  Market Data
  Discover