Note: The NYSE has released new data for margin debt, now available through July. We've updated the charts in this commentary to include the latest numbers.
The Latest Margin Data
The latest debt level is up 6.1% month-over-month, the largest MoM increase in 15 months; however, the current level is 6.4% below its record high set in April of last year.
The next chart shows the percentage growth of the two data series from the same 1995 starting date, again based on real (inflation-adjusted) data. We've added markers to show the precise monthly values and added callouts to show the month. Margin debt grew at a rate comparable to the market from 1995 to late summer of 2000 before soaring into the stratosphere. The two synchronized in their rate of contraction in early 2001. But with recovery after the Tech Crash, margin debt gradually returned to a growth rate closer to its former self in the second half of the 1990s rather than the more restrained real growth of the S&P 500. But by September of 2006, margin again went ballistic. It finally peaked in the summer of 2007, about three months before the market.
After the market low of 2009, margin debt again went on a tear until the contraction in late spring of 2010. The summer doldrums promptly ended when Chairman Bernanke hinted of more quantitative easing in his August, 2010 Jackson Hole speech. The appetite for margin instantly returned, and the Fed periodically increased the easing. With QE now history, margin debt is off its record high. The key question, of course, is whether that April 2015 peak was a Fed-induced, easy-money bubble and the precursor to a major market decline as in 2000 and 2008. Meanwhile, the equity market remains in high gear, as evidenced by the S&P 500 having logged three record closes in August.
NYSE Investor Credit
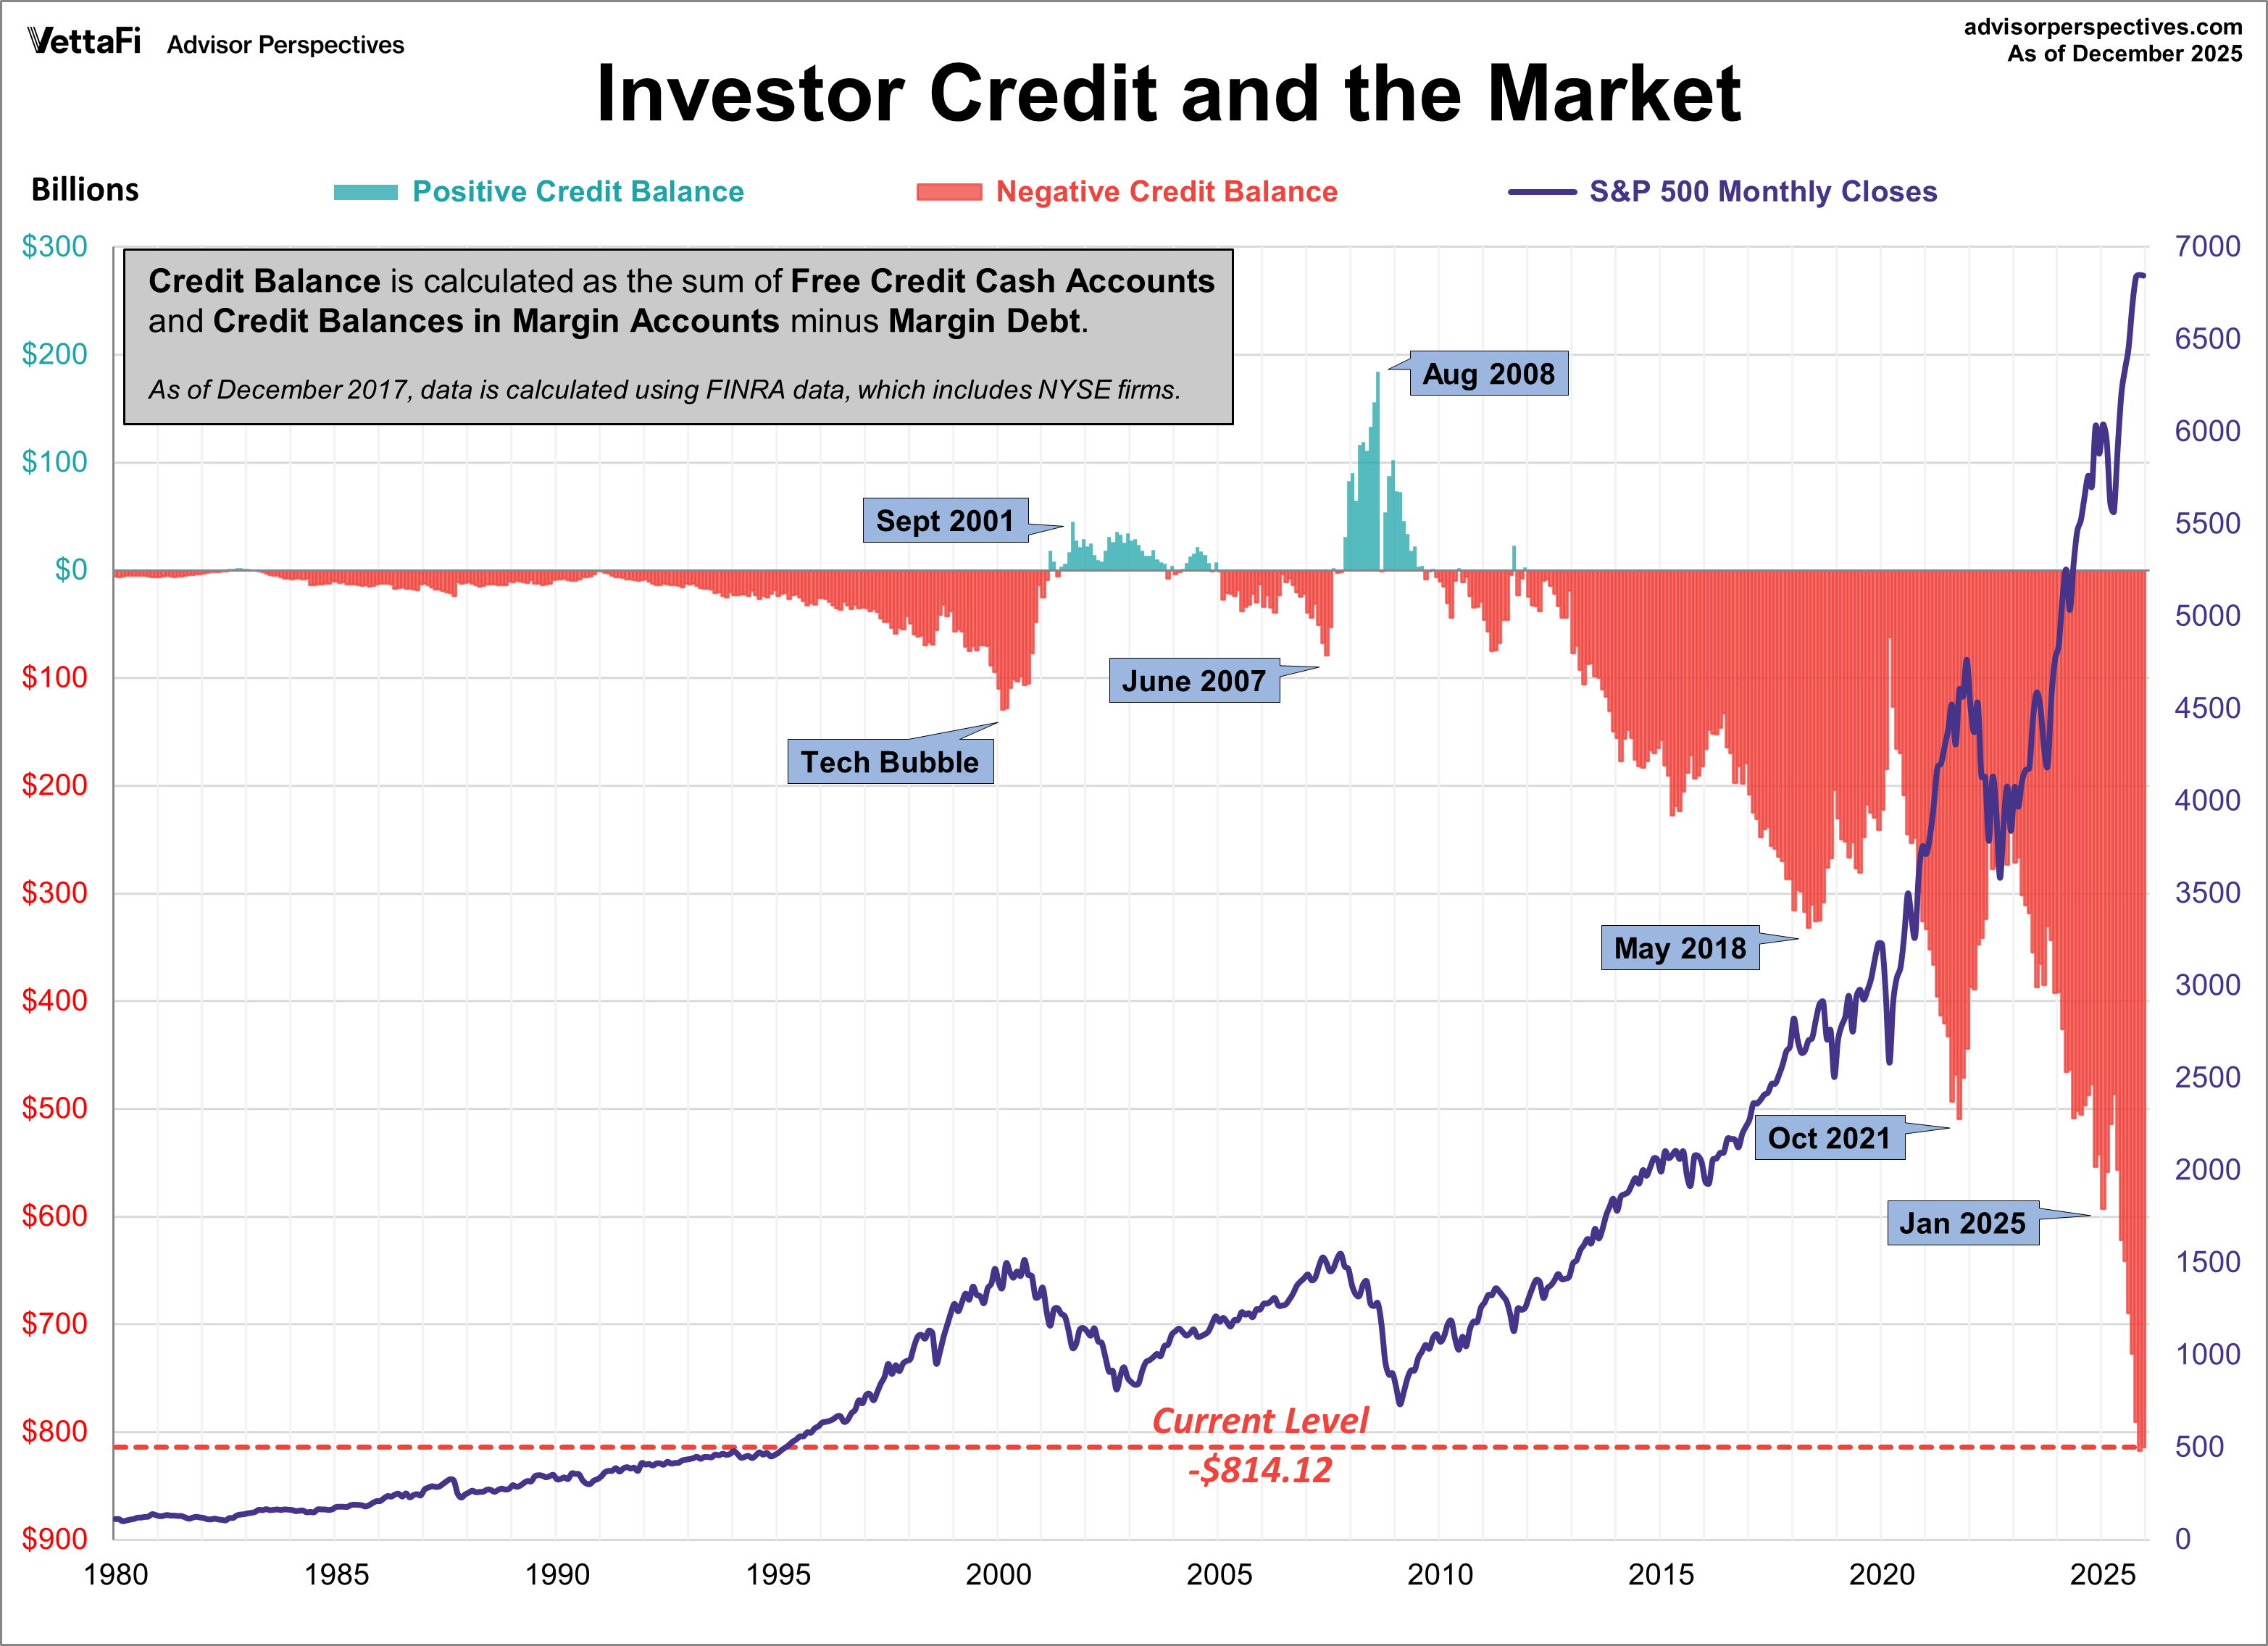
Lance Roberts of Real Investment Advice analyzes margin debt in the larger context that includes free cash accounts and credit balances in margin accounts. Essentially, he calculates the Credit Balance as the sum of Free Credit Cash Accounts and Credit Balances in Margin Accounts minus Margin Debt. The chart below illustrates the mathematics of Credit Balance with an overlay of the S&P 500. Note that the chart below is based on nominal data, not adjusted for inflation.
Here's a slightly closer look at the data, starting with 1995. Also, we've inverted the investor credit monthly data and used markers to pinpoint key turning points.
As we pointed out above, the NYSE margin debt data is a several weeks old when it is published. Thus, even though it may in theory be a leading indicator, a major shift in margin debt isn't immediately evident. Nevertheless, we see that the troughs in the monthly net credit balance preceded peaks in the monthly S&P 500 closes by six months in 2000 and four months in 2007. The most recent S&P 500 correction greater than 15% was the 19.39% selloff in 2011 from April 29th to October 3rd. Investor Credit hit a negative extreme in March 2011.
Conclusions
There are too few peak/trough episodes in this overlay series to take the latest credit-balance data as a leading indicator of a major selloff in U.S. equities. However, current level is well off its record close in April of last year and showing a pattern similar to what we saw following the market peaks in 2000 and 2008. This has been an interesting indicator to watch in recent months and will certainly continue to bear close watching in the months ahead.
Information posted to this board is not meant to suggest any specific action, but to point out the technical signs that can help our readers make their own specific decisions. Your Due Dilegence is a must! • DiscoverGold
Register for free to join our community of investors and share your ideas. You will also get access to streaming quotes, interactive charts, trades, portfolio, live options flow and more tools.


 News
News  Market Data
  Discover