


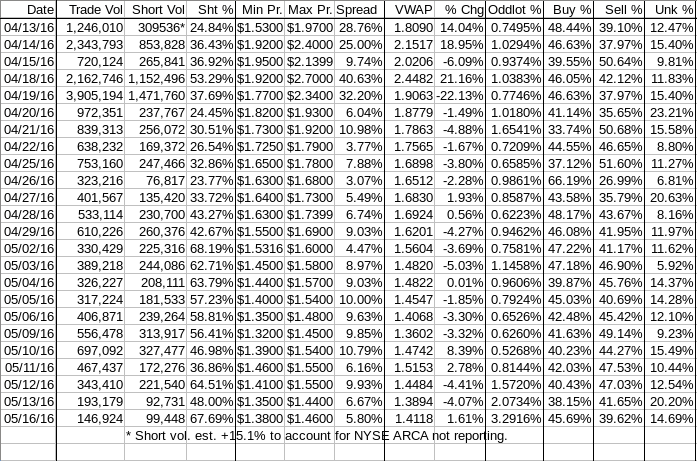
Tuesday, May 17, 2016 9:25:24 AM
Today tried, on very low/no-volume (mostly no-volume) to stay above the minimal chart's rising support (lower rising orange line), $1.42 today, but finally broke below it at 11:51 and proceeded lower to $1.39 at 12:24, went sideways $1.39/40 through 13:04, hit $1.38 at 13:05 and bounced back up to do $1.39/40 through 13:38. 13:39 popped up to $1.42 (hitting that resistance/support line) and immediately began sagging lower, getting back to $1.38 at 15:46. The EOD volatility began and we saw $1.42 at 15:51, $1.40 at 15:54, $1.39 at 15:57 and $1.39/40 into the close on a sell of 1K at $1.39.
This left the close below the former support, $1.42 today, for the first time. A close below tomorrow, estimated at $1.425 tomorrow, would confirm a break down.
Fortunately, today was predominately low/no-volume all day and the day's volume declined from yesterday's, suggesting no strength (yet) downward.
Today was an oddity that we have seen before in that as price declined a good part of the day we also saw rising buy percentage. As price declined from the early high of $1.46 to 12:00's $1.41, buy percentage moved from 10:45's ~57% to ~67%, the high after the early volatile readings ceased to be a factor. By 12:30 it was back to ~56% and slowly degraded to ~54% through 15:30. This, again, makes me think careful covering buys - either MMs or shorters - was going on in the latter part of the day after some shorting (maybe!) in the earlier higher-price part of the day.
The last thirty minutes, with the usual EOD volatility, put the buy percentage down to ~45%.
There were no pre-market trades.
09:30-10:51 opened the day with an 8,817 buy for $1.45 and sold another 2K for $1.4501 and 100 $1.46. The came 9:31's 2K $1.4503, 9:32's 100 $1.46, 9:34's 600 $1.46, 9:37's 700 $1.46, 9:41's ~1.6K $1.45, 9:43's 100 $1.46, 9:44's 130 $1.4305, 9:48's ~2.8K $1.4337/$1.4424, 9:51's ~1.5K $1.43/$1.4350, 9:52's 100 $1.44, and then after 9:53's ~3.5K stabilized in a very low/no-volume $1.43/4 range, interrupted by 10:12's 375 $1.44/5 and 10:15-:17's 400 $1.45->$1.44, and ended the period on 10:51's 1K $1.4299.
10:52-11:47 began a very low/no-volume $1.42/3 with 10:52's 400 $1.4210/$1.4280, interrupted by 11:22's 200 $1.44 and 11:25's 5.1K $1.42/3, and ended on 11:47's 420 $1.42/$1.4201.
11:48-12:17, after three no-trade minutes, began very low/no-volume $1.41/$1.42 with 11:51's 1.2K $1.4150/$1.42 and ended the period on 12:17's 100 $1.42.
12:18-13:04 did a drop to begin very low/no-volume $1.39/40 with 12:18-:19's ~5.6K $1.40/1, 12:24's ~4.3K $$1.4050/$1.39, and 12:28's 1.1K $1.39. Then b/a went ~33K:2K $1.38/9 for a minute before ~1.4K:5K $1.39/40 appeared. That began very low/no-volume $1.39/40 and ended the period on 13:04's ~2K $1.39.
13:05-13:36 did a quick step up on 13:05-:10's ~12.8K $1.38-$1.39->$1.40->$1.39/40 to begin very low/no-volume $1.40/1 and ended the period on 13:36's ~5.4K $1.39/40.
13:37-14:09, after two no-trade minutes, began a very low/no-volume $1.41/2 with 13:39's 100 $1.42 and ended the period on 14:09's 175 $1.41.
14:10-14:45, after ten no-trades minutes, began very low/no-volume $1.40/1 with 14:20's ~3K $1.40 and ended on 14:45's 200 $1.40.
14:46-15:45 did 14:46's 450 $1.3960 and b/a became ~11.4K:1.3K $1.39/40 to begin very low/no-volume $1.39/40, interrupted by 15:03's 100 $1.41 and 15:28's ~1.4K $1.40/1, and ended the period on 15:45's 668 $1.39.
15:46-16:00 began with a big b/a imbalance of ~10.6K:600 $1.39/41 and started the EOD volatility when it did 15:46's ~3.6K$1.38/9, did 15:47-:51's $1.3970/$1.40, 15:52-:53's $1.41/2, 15:54's 1.8K $1.42->$1.40, 15:55--:57's ~5.4K $1.41->$1.41->$1.39, 15:58-:59's ~2.2K $1.39->$1.40->$1.39, and ended the period and day on 16:00's 1K sell for $1.39.
There were no AH trades.
Including the opening trade (closing didn't qualify), there were 2 larger trades (>=5K) totaling 13,817, 9.40% of day's volume, with a $1.4319 VWAP. Excluding the opening trade, there was 1 larger trade totaling 5,000, 3.40% of day's volume, with a $1.4001 VWAP.
Both number and percentage associated with larger trades are abnormally low today. This is a bad sign for investors but a good sign for those wishing to move the market around, to use the ATM for example. The downside is this comes with very low volume making such as the ATM use very much a waste of time.Ending Period Period Period __Per. Trade_ Period_ % Day_ Per. End
Period Volume Low High _Dollar Val._ VWAP___ Volume Buy ~%
10:51 34499 $1.4299 $1.4600 $49,855.40 $1.4451 23.48% Incl 09:30 $1.4500 8,817
11:47 11770 $1.4200 $1.4400 $16,813.64 $1.4285 8.01%
12:17 6967 $1.4100 $1.4200 $9,882.25 $1.4184 4.74%
13:04 18022 $1.3891 $1.4100 $25,159.27 $1.3960 12.27% Incl 12:19 $1.4001 5,000
13:39 23358 $1.3800 $1.4200 $32,621.69 $1.3966 15.90%
14:09 1605 $1.4091 $1.4100 $2,262.09 $1.4094 1.09%
14:45 6160 $1.3999 $1.4100 $8,634.65 $1.4017 4.19%
15:45 23554 $1.3900 $1.4100 $32,802.85 $1.3927 16.03%
16:00 16307 $1.3800 $1.4200 $22,778.72 $1.3969 11.10%
On the traditional TA front, movements were: pre] __Open_ ___Low_ __High_ _Close_ Volume_
Today 2.84% 2.22% 1.39% -2.11% -23.94%
Prior -7.84% -4.26% -7.10% 0.71% -43.75%On my minimal chart we need to confirm a break below the rising support, the lower rising orange line. It was on very low volume though and it would be easy for it to move back up again, especially if volume remains low. Moreover, volume has been declining four consecutive days now, suggesting we may be nearing a bottom. If that's the case we could see a flattish or even reversal behavior. My concerns about the potential head and shoulder formation had been abating but now come back a bit. The potential right shoulder developed enough width to become a bit more symmetrical, one of the things we look for in that pattern development. What that does tomorrow will determine whether my concern increases or not.
With my 13-period Bollinger band limits strongly converging now, we should expect some kind of break soon.
On my one-year chart the long-term descending resistance appears to be ~$1.58ish today. As mentioned, if we do challenge it I don't have any idea how strong a resistance it might be.
The 10 and 20-day SMAs continue to decline and the 20-day accelerated it's decline today and should continue to accelerate a couple more days, sans a catalyst inspired up move. Sans a rise in price range, the 50-day will start to flatten in a couple more days.
The oscillators I watch remain mixed with MFI (untrusted by me) and momentum showing marginal improvement and all others showing increasing weakness. Williams %R entered oversold and all others are below neutral.
The 13-period Bollinger limits, $1.3148 and $1.6483 ($1.3136 and $1.6956 yesterday) continue converging and dropping the mid-point. We're not pushing the lower limit yet but I expect we'll do so within a couple days.
All in, only the falling volume of the last four days suggests we might be nearing a bottom and change of behavior - going flat or reversing. With volume very low price is easily moved so if someone wants a higher price they can get it quite cheaply.
Percentages for daily short sales and buys moved in the same direction, good. Short percentage is way above what I believe is normal though (needs re-check). Buy percentage is back in our normal range - just below what's needed for sustained appreciation. With low volume though we can't really take any comfort in it moving this direction. My suspicion is it's caused by a lot of short covering buys.
The spread continues contracting. It's almost small enough to suggest we'll see some stability soon but for the fact it was produced by our typical open high and drop, drop, drop. It would have likely been a wider spread but for the low volume and abysmal number of larger trades (see above).
VWAP made a small improvement and now has thirteen negative and six positives in the last nineteen readings.
All in, the short percentage, volume and still-low buy percentages keep me negative on near-term prospects. I'd like to think the low volume suggests a potential reversal in the near-term but the method of the spread production keeps me from buying into that yet.
As always, much is experimental and should be treated as such.
Bill
Join the InvestorsHub Community
Register for free to join our community of investors and share your ideas. You will also get access to streaming quotes, interactive charts, trades, portfolio, live options flow and more tools.

