 News
News  Market Data
  Discover
Support: 888-992-3836
Copyright © 2023 InvestorsHub Inc.


Register for free to join our community of investors and share your ideas. You will also get access to streaming quotes, interactive charts, trades, portfolio, live options flow and more tools.
BULLION GOLD INSTANTLY - Gold Standard 2.0: "Russia & China's About to Change the World Forever" - Peter Schiff
Money Sense

Grains Report: Wheat, Rice, Corn and Oats, Soybeans, Canola and Palm Oil
By: Jack Scoville | August 30, 2024
• WHEAT
General Comments: Wheat was higher in all three markets on stable overseas prices reported in Russia and Europe and the wrap up of the Wheat harvest and reports of reduced cash movement here in the US. Ideas of good crops in the US and Canada went against reports of dry weather in eastern Europe and Russia and too wet weather in France and Germany along with Spring Wheat areas of Russia are still heard and the weather there affecting world production estimates. There were more reports of dry conditions coming this week to Russian growing areas although Spring Wheat areas have seen too much rain. Eastern Europe is also hot and dry. Western Europe has seen too much rain.
Overnight News:
Chart Analysis: Trends in Chicago are mixed. Support is at 532, 521, and 514 December, with resistance at 560, 575, and 581 December. Trends in Kansas City are mixed. Support is at 539, 527, and 520 December, with resistance at 565, 573, and 584 December. Trends in Minneapolis are mixed to down with no objectives. Support is at 575, 563, and 552 December, and resistance is at 600, 612, and 618 December.
• RICE
General Comments: Rice closed mostly lower yesterday with September closing lower on what appeared to be speculator selling in September before First Notice Day. The back months were lower as the trade felt the ongoing harvest. The US weather has been an issue much of the growing season with too much rain early in the year. Some areas are now too hot and dry, especially in Texas, and Texas yields are down as a result as the harvest moves forward. However, planted area has increased from last year
Overnight News:
Chart Analysis: Trends are mixed to down with no objectives. Support is at 1472, 1466, and 1456 November and resistance is at 1504, 1520, and 1532 November
• CORN AND OATS
General Comments: Corn and Oats closed higher on speculative buying and some commercial buying as cooler but still warm weather retreated and dry weather was reported n just about all of the Midwest. Dry weather is still in the forecast after a few showers pass by today. Ideas of very strong yields are still heard. Increased US demand comes from the fact that Corn prices are already the cheapest in the world. Current forecasts call for cooler and drier weather for the Midwest for the next week or longer.
Overnight News:
Chart Analysis: Trends in Corn are mixed. Support is at 389, 366, and 360 December, and resistance is at 401, 404, and 409 September. Trends in Oats are up with no objectives. Support is at 325, 314, and 305 December, and resistance is at 339, 351, and 361 December
• SOYBEAN
General Comments: Soybeans and the products were higher yesterday on speculative buying. Stronger demand news and First Notice Day coming on Friday were reasons to trade the market. There is also concern about the hot and dry weather seen in the Midwest early this week that could hurt pod fill. The weather is turning cooler now but it should remain dry after a few more showers hit late this week. Next week should be dry and cooler amid dry weather and western and Delta areas should stay warm and dry. Reports indicate that China is buying a lot in the US. Domestic demand has been strong in the US.
Overnight News:
Chart Analysis: Trends in Soybeans are mixed to up with no objectives. Support is at 973, 961, and 955 November, and resistance is at 1013, 1032, and 1042 November. Trends in Soybean Meal are mixed. Support is at 306.00, 304.00, and 299.00 October, and resistance is at 312.00, 320.00, and 323.00 October. Trends in Soybean Oil are up with no objectives. Support is at 4110, 4020, and 3940 October, with resistance at 4300, 4400, and 4520 October.
• PALM OIL AND CANOLA
General Comments: Palm Oil was higher today on hopes of improving demand as Indonesia intends to increase its use of Palm Oil in its biofuels blends and increase biofuels to 40% of consumption. It could become 50% if the new president gets his way. Production reports indicate that the increase in production is less than expected at this time. Reports indicate that production is rising as well. Export demand has been very strong in recent private reports but has been weaker in recent days. There is talk of increased supplies available to the market, and the trends are down on the daily charts. Canola was lower and trends remain up on ideas of reduced supplies even with the harvest starting soon. The weather has been hot and dry in Canada and it looks like Canola production has been impacted. The weather has called for dry conditions in the Prairies and yields are expected to be the same or less.
Overnight News:
Chart Analysis: Trends in Canola are up with no objectives. Support is at 602.00, 590.00, and 581.00 November, with resistance at 629.00, 668.00, and 681.00 November. Trends in Palm Oil are mixed to up with no objectives. Supp with no objectives. Support is at 3900, 3870, and 3820 November, with resistance at 3990, 4020, and 4090 November.
Midwest Weather Forecast Scattered showers. Temperatures should average near to below normal.
Read Full Story »»»
 DiscoverGold
Softs Report: Cotton, OJ, Coffee, Sugar, Cocoa
By: Jack Scoville | August 30, 2024
• COTTON
General Comments: Cotton was higher yesterday in recovery trading as the overall situation is bullish with reduced production potential again this year and improving demand. There are still ideas of weaker demand potential against an outlook for improved US production in the coming year. It looks like futures are cheap enough for now but speculators see no reason to buy except to cover short positions as there have been demand concerns about Bangladesh and China and ideas are that production is strong enough. The Delta should have the best looking crops right now, but crops in other areas are more suspect. Texas and the Southeast have seen some extreme heat so far this year, and Texas has also seen dry conditions at times during the growing season. Hot weather is likely for the Delta this week. Demand has been weaker so far this year but there are hopes for improved demand with the lower prices.
Overnight News:
Chart Trends: Trends in Cotton are down with no objectives. Support is at 67.40, 66.30, and 65.80 December, with resistance of 71.30, 73.00 and 73.70 December.
• FCOJ
General Comments: FCOJ closed sharply higher yesterday on apparent speculative buying ahead of Frist Notice Day and as ideas of reduced production continue against reports of stronger demand as forecasts call for no tropical activity in the near future in the Atlantic. Nothing appeared threatening in the forecasts for this week as the current tropical system should stay in the ocean and there is nothing in the ocean to suggest that a storm is on its way to Florida. A very active year is forecast and there have been some reports of flooding in the state even with no huge storms. The market remains well supported in the longer term based on forecasts for tight supplies and very hot weather in Florida. The reduced production also appears to be at the expense of the greening disease. There are no weather concerns to speak of for Florida or for Brazil right now.
Overnight News:
Chart Trends: Trends in FCOJ are mixed. Support is at 438.00, 432.00, and 415.00 November, with resistance at a 471.00, 488.00, and 494.00 November.
• COFFEE
General Comments: New York and London closed much lower on what appeared to be speculative long liquidation with offers from Vietnam and Indonesia still hard to find but offers from Brazil are in the market. Indonesian offers are now less as producers wait for higher prices before selling. Damage was done to crops earlier in the growing season in Vieztnam and lower production is now expected for the next crop. There were also reports of poor Robusta yields in Brazil during the harvest due to small bean sizes but offers have been strong so far this season. Arabica yields in Brazil and Colombia are reported to be less this year due to extreme weather in both countries.
Overnight News: The ICO daily average price is now 247.83 ct/lb.
Chart Trends: Trends in New York are up with no objectives. Support is at 241.00, 234.00, and 229.00 December, and resistance is at 251.00, 259.00 and 265.00 December. Trends in London are up with no objectives. Support is at 4730, 4660, and 4620 November, with resistance at 5000, 5060, and 5120 November.
• SUGAR
General Comments: New York and London closed higher on what appeared to be speculative and commercial buying. Unica reported on Wednesday that sugar production in the Cener-South of Brazil totaled 3.11 million metric tons, down 10.2% from last year. Chinese demand in particular is in focus amid the economic problems seen there. Harvest progress in Brazil and improved growing conditions in India and Thailand are the important fundamentals and growing conditions are dry in Brazil. Indian and Thai monsoon rains have been very beneficial and mills are expecting strong crops of cane. They are pushing the governments to allow exports but so far the governments have not agreed. Production estimates were raised in the northern hemisphere. Harvest yields of Sugarcane in Brazil are strong but should start falling but not enough to impact prices much.
Overnight News:
Chart Trends: Trends in New York are up with no objectives. Support is at 1920, 1890, and 1850 October and resistance is at 1990, 2040, and 2080 October. Trends in London are up with no objectives. Support is at 533.00, 526.00, and 517.00 October, with resistance at 562.00, 570.00, and 581.00 October.
• COCOA
General Comments: New York and London closed lower on more speculator selling as tight supply conditions continue. Production concerns in West Africa as well as demand from nontraditional sources along with traditional buyers keep supporting futures. Production in West Africa could be stronger this year on currently dry weather in Ivory Coast. Ghana has had hot and dry conditions and there are reports that pods are being aborted. The availability of Cocoa from West Africa remains very restricted, but surplus production against demand is expected in the next crop year.
Overnight News:
Chart Trends: Trends in New York are mixed. Support is at 7490, 7180, and 6850 December, with resistance at 8240, 8550, and 9000 December. Trends in London are mixed. Support is at 5210, 51120, and 5060 December, with resistance at 5510, 5680, and 5800 December.
Read Full Story »»»
DiscoverGold
The Corn & Ethanol Report
By: Daniel Flynn | August 30, 2024
We kickoff the day with Core PCE Price Index MoM & YoY, PCE Price Index MoM & YoY, Personal Income MoM, and Personal Spending MoM at 7:30 A.M., Chicago PMI at 8:45 A.M., Michigan Consumer Sentiment Final, Michigan 5-Year Inflation Expectations Final, Michigan Consumer Expectations Final, Michigan Current Conditions Final, and Michigan Inflation Expectations Final at 9:00 A.M., and Baker Hughes Oil & Total Rig Count at 12:00 P.M.
As harvest approaches producers are also focused on booking fall fertilizer needs and are frustrated that prices are not reflecting lower grain prices. The latest Illinois Production Cost Report showed that anhydrous ammonia was 15% higher than a year ago while monoammonium phosphate (MAP) was quoted 7% higher than last year. Dealers have been slow to lower prices as CBOT corn and soybean markets sit at multi-year lows. Ag Resources (ARC) showed a chart of the diammonium phosphate (DAP), the world’s most widely used phosphorus fertilizer, The average IL DAP price 6% above last year at $716/ton. Moreover, at current CBOT prices, it takes 193 bushels of corn to pay for 1 ton of DAP, up from 142 bushels last year and the most since 2009. US farmers are looking for ways to cut back on cost via fertilizer, seed or equipment. The US fertilizer is showing surprising strength as China curtails exports.
Midwest Rain Chances Favor IA/MN; TX & Delta Get Soaked; Drought Expands in Late August:
The Central US forecast maintains moderate showers across much of IA & MN over the next 48 hours. Gulf moisture also impacts TX and the Southeast throughout the next 7 days, with cumulative rainfall of 1-4” forecast in TX, LA, AR, and MS. This will slow southern corn/soybean harvesting but works to ease flash drought there. Little/no rain is forecast in Dakota’s, IL, IN, OH, and Mi into Sep 8th . Abnormal dryness has crept into the C Plains & E Midwest. Coming rain will ease/eliminate dryness in TX, LA, and AR but an expansion of drought is projected across the E Midwest into mid-September. Fortunately, temp moderation occurs in all areas beginning next week. Midwest highs September 1-8th are forecast in the 70’s & low 80’s.
The South American forecast into Sep 12th remains consistent with previous runs, needed showers producing rainfall of 1-2” will impact Buenos Aires and far southern Santa Fe this weekend. An arid pattern dominates the remainder of Brazil, Argentina, and Paraguay, and there’s still no indication that the arrival of Brazil’s monsoon occurs prior to late September, and Mother Nature is unlikely to cooperate.
Read Full Story »»»
DiscoverGold
Natural Gas Breaks 20-Day MA, Eyes Stronger Resistance Ahead
By: Bruce Powers | August 29, 2024
• Natural gas continues to rise, closing above the 20-Day MA, and targets higher resistance zones, but faces challenges within an expanding triangle pattern.
Natural gas advanced slightly above Wednesday’s high on Thursday, reaching a high of 2.15. It generated a higher daily high and higher low and continues to trade near the highs of the day at the time of this writing. Today is set to end with natural gas closing above the 20-Day MA for the first time in six days. By recapturing the 20-Day line natural gas is showing strength and a recovery from this week’s low, and a slightly new trend low of 1.875.

Resistance Zone from 2.24 to 2.30
There are several initial upside targets for the bounce defined by a top price of 2.30 and starting with the 50-Day MA at 2.24. Within the price range is the 200-Day MA at 2.28 and the interim swing high of 2.27 from July 22. Be aware that as of this week’s low natural gas is forming an expanding triangle pattern.
The two boundary lines of the pattern are purple on the chart and point away from each other. This means that a breakout above the 2.30 swing high may see difficulty in following-through if natural gas subsequently finds resistance a little higher around the rising top line of the triangle.
Daily Close Above 200-Day Line Should Complete Bottom
Nonetheless, a daily close above the 200-Day line should put natural gas in a bullish position to approach higher potential targets, the first being the 38.2% Fibonacci retracement at 2.37. If that level can be surpassed the 50% retracement zone at 2.52 becomes the next higher target beginning with the interim swing low of 2.48 from May.
Trading Inside Large Symmetrical Triangle Pattern
Natural gas has been forming a large symmetrical triangle pattern since the April bottom. If it continues to strengthen, an eventual test of resistance at the top line of the triangle is likely. The 78.6% retracement at 2.89 can be used as a proxy for now. However, a little lower and above the 50% retracement is another potential resistance zone at 2.67 as that price would complete the 61.8% Fibonacci retracement.
Be aware that since natural gas is trading inside a consolidation pattern in the form of an expanding triangle, it is subject choppy trading until a decisive breakout of the pattern occurs.
Read Full Story »»»
DiscoverGold
Grains fall to lowest level against other Commodities in more than 14 years
By: Barchart | August 29, 2024
• Grains fall to lowest level against other Commodities in more than 14 years.

Read Full Story »»»
DiscoverGold
Commodities Daily Market Movers (% Price Change)
By: Marty Armstrong | August 29, 2024
• Top Movers
Tokyo Rubber Futures 3.19 %
Oats (CBOT) Futures 2.92 %
Oats (Minneapolis) 2.31 %
Gold / Silver Ratio 2.07 %
Wheat #2 1.27 %
• Bottom Movers
Cheese 3.27 %
NY Platinum Futures 2.65 %
Platinum / Gold Ratio 2.63 %
NY Silver COMEX Futures 2.6 %
NY Palladium Futures 2.57 %
*Close from the last completed Daily
DiscoverGold
Sugar breaking out of its 2-month downtrend on surging volume
By: Barchart | August 27, 2024
• Sugar breaking out of its 2-month downtrend on surging volume

Read Full Story »»»
DiscoverGold
Grains Report: Wheat, Rice, Corn and Oats, Soybeans, Canola and Palm Oil
By: Jack Scoville | August 27, 2024
• WHEAT
General Comments: Wheat was lower in Chicago but higher in Kansas City and Minneapolis on stable overseas prices reported in Russia and Europe and the wrap up of the Wheat harvest and reports of cash movement here in the US. US harvest progress and ideas of good crops went against reports of dry weather in eastern Europe and Russia and too wet weather in France and Germany along with Spring Wheat areas of Russia are still heard and the weather there affecting world production estimates. There were more reports of dry conditions coming this week to Russian growing areas although Spring Wheat areas have seen too much rain. Eastern Europe is also hot and dry. Western Europe has seen too much rain.
Overnight News:
Chart Analysis: Trends in Chicago are down with no objectives. Support is at 5496, 490, and 484 September, with resistance at 524, 536, and 548 September. Trends in Kansas City are down with no objectives. Support is at 512, 506, and 500 September, with resistance at 540, 559, and 567 September. Trends in Minneapolis are down with no objectives. Support is at 538, 532, and 526 September, and resistance is at 584, 601, and 613 September.
• RICE
General Comments: Rice closed slightly higher yesterday on what appeared to be speculator trading on both sides of the market as the harvest moves along to completion. The US weather has been an issue much of the growing season with too much rain early in the year. Some areas are now too hot and dry, especially in Texas, and Texas yields are down as a result as the harvest moves forward. However, planted area has increased from last year
Overnight News:
Chart Analysis: Trends are mixed. Support is at 1471, 1453, and 1449 September and resistance is at 1516, 1526, and 1538 September
• CORN AND OATS
General Comments: Corn closed a little lower yesterday and Oats closed higher on what appeared to be speculative selling in Corn. The Pro Farmer crop tour concluded last week and found good Corn crops, with production estimated at 14.979 billion bushels. Most in the trade had expected production in excess of 15 billion bushels as had USDA so some upside movement is possible in prices early this week. Increased US demand comes from the fact that Corn prices are already the cheapest in the world. Current forecasts call for cooler and drier weather for the Midwest later this week after one more very hot day today.
Overnight News: Mexico bought 127,760 tons of US Corn.
Chart Analysis: Trends in Corn are down with no objectives. Support is at 361, 358, and 355 September, and resistance is at 385, 390, and 402 September. Trends in Oats are mixed. Support is at 313, 308, and 300 September, and resistance is at 336, 348, and 358 September
• SOYBEAN
General Comments: Soybeans and the products were higher yesterday on speculative short covering generated by a stronger demand news. Pro Farmer estimated US Soybeans production at 4.740 billion bushels. This would be a new record production. This week should be dry and warmer this week amid dry weather and western and Delta areas should stay warm and dry. Reports indicate that China is buying a lot in the US. Domestic demand has been strong in the US.
Overnight News: Unknown destinations bought 120,000 tons of US Soybeans.
Chart Analysis: Trends in Soybeans are mixed. Support is at 939, 928, and 916 September, and resistance is at 973, 1007, and 1018 September. Trends in Soybean Meal are mixed. Support is at 302.00, 300.00, and 297.00 September, and resistance is at 323.00, 325.00, and 329.00 September. Trends in Soybean Oil are mixed. Support is at 3970, 3860, and 3800 September, with resistance at 4220, 4260, and 4360 September.
• PALM OIL AND CANOLA
General Comments: Palm Oil was higher yesterday on ideas of improving demand as Indonesia intends to increase its use of Palm Oil in its biofuels blends and increase biofuels to 40% of consumption. Izt could bedome 50% if the new president gets his ay. Production reports indicate that the increase in production is less than expected at this time. Reports indicate that production is rising as well. Export demand has been very strong in recent private reports but has been weaker in recent days. There is talk of increased supplies available to the market, and the trends are down on the daily charts. Canola was higher and showed signs of forming a bottom on the daily charts on ideas of increasing producer offers as oilseed supplies look to be ample in the coming year and as demand ideas are down. The Canadian rail strike makes movement of grain much more difficult and a lot will get backed up in the system, but the government there is forcing binding arbitration on labor and management. The weather has called for dry conditions in the Prairies and yields are expected to be the same or less.
Overnight News:
Chart Analysis: Trends in Canola are mixed to down with no objectives. Support is at 575.00, 565.00, and 552.00 November, with resistance at 598.00, 607.00, and 617.00 November. Trends in Palm Oil are u. Supp with no objectives. Support is at 3850, 3820, and 3780 November, with resistance at 3990, 4020, and 4090 November.
Midwest Weather Forecast Mostly dry. Temperatures should average near to below normal.
Read Full Story »»»
DiscoverGold
Softs Report: Cotton, OJ, Coffee, Sugar, Cocoa
By: Jack Scoville | August 27, 2024
• COTTON
General Comments: Cotton was lower yesterday after opening higher after breaking through the top of the recent trading range on the weekly charts. There are still ideas of weaker demand potential against an outlook for improved US production in the coming year. It looks like futures are cheap enough for now but speculators see no reason to buy except to cover short positions as there have been demand concerns about Bangladesh and China and ideas are that production is strong enough. The Delta should have the best looking crops right now, but crops in other areas are more suspect. Texas and the Southeast have seen some extreme heat so far this year, and Texas has also seen dry conditions at times during the growing season. Hot weather is likely for the Delta this week. Demand has been weaker so far this year but there are hopes for improved demand with the lower prices.
Overnight News:
Chart Trends: Trends in Cotton are mixed. Support is at 68.80, 67.40, and 66.30 December, with resistance of 71.30, 73.00 and 73.70 December.
This Week Last Week Last Year Average
Cotton Setting Bolls 89 84 87 77
Cotton Bolls Opening 25 19 23 23
Very Poor Poor Fair Good Excellent
Cotton This Week 12 16 32 34 6
Cotton Last Week 8 18 32 35 7
Cotton Last Year 23 21 23 28 5
• FCOJ
General Comments: FCOJ closed sharply lower yesterday on apparent speculative and commercial selling as ideas of reduced production continue against reports of stronger demand as forecasts call for no tropical activity in the near future in the Atlantic. Nothing appeared threatening in the forecasts for this week as the current tropical system should stay in the ocean and there is nothing in the ocean to suggest that a storm is on its way to Florida. A very active year is forecast and there have been some reports of flooding in the state even with no huge storms. The market remains well supported in the longer term based on forecasts for tight supplies and very hot weather in Florida. The reduced production also appears to be at the expense of the greening disease. There are no weather concerns to speak of for Florida or for Brazil right now.
Overnight News:
Chart Trends: Trends in FCOJ are up with no objectives. Support is at 467.00, 463.00, and 467.00 September, with resistance at 525.00, 532.00, and 538.00 September.
• COFFEE
General Comments: New York closed higher but in a trading range and London was closed yesterday with offers from Vietnam still hard to find but offers from Brazil and Indonesia in the market. Indonesian offers are now less as producers wait for higher prices before selling. The weather forecasters now say that conditions are good in Vietnam, but damage was done to crops earlier in the growing season and lower production is now expected for the next crop. There were also reports of poor Robusta yields in Brazil during the harvest due to small bean sizes but offers have been strong so far this season. Arabica yields in Brazil and Colombia are reported to be less this year due to extreme weather in both countries.
Overnight News: The ICO daily average price is now 245.77 ct/lb.
Chart Trends: Trends in New York are mixed to up with no objectives. Support is at 245.00, 237.00, and 230.00 September, and resistance is at 255.00, 261.00 and 264.00 September. Trends in London are up with no objectives. Support is at 4960, 4860, and 4670 September, with resistance at 5160, 5220, and 5280 September.
• SUGAR
General Comments: New York closed higher and London was closed after reports of some big fires in Brazil Sugarcane fields and on short covering after demand concerns pushed futures to test recent lows. Chinese demand in particular is in focus amid the economic problems seen there. Harvest progress in Brazil and improved growing conditions in India and Thailand are the important fundamentals and growing conditions are turning drier in Brazil. Indian and Thai monsoon rains have been very beneficial and mills are expecting strong crops of cane. They are pushing the governments to allow exports but so far the governments have not agreed. Production estimates were raised in the northern hemisphere. Harvest yields of Sugarcane in Brazil are strong but should start falling but not enough to impact prices much. CONAB said production estimates for this year should be increased, but total production should still be less than last year.
Overnight News:
Chart Trends: Trends in New York are down with no objectives. Support is at 1850, 1810, and 1750 October and resistance is at 1930, 1960, and 1990 October. Trends in London are down with no objectives. Support is at 517.00, 511.00, and 501.00 October, with resistance at 533.00, 544.00, and 555.00 October.
• COCOA
General Comments: New York closed a little higher last week and London closed a little lower in consolidation trading on tight supply conditions and reports of good crop conditions for the next crop at least in Ivory Coast. Production concerns in West Africa as well as demand from nontraditional sources along with traditional buyers keep supporting futures. Production in West Africa could be stronger this year on improved weather as there are currently good rains in Ivory Coast although cool temperatures are also reported. Ghana has had hot and dry conditions and there are reports that pods are being aborted. The availability of Cocoa from West Africa remains very restricted, but surplus production against demand is expected in the next crop year.
Overnight News:
Chart Trends: Trends in New York are mixed to up with no objectives. Support is at 9350, 8970, and 8360 September, with resistance at 10310, 10860, and 11110 September. Trends in London are mixed. Support is at 6120, 5880, and 5820 September, with resistance at 6880, 7080, and 7320 September.
Read Full Story »»»
DiscoverGold
The Corn & Ethanol Report
By: Daniel Flynn | August 27, 2024
We kickoff the day with Redbook YoY at 7:55 A.M., S&P/Case-Shiller Home Price MoM & YoY. House Price Index MoM & YoY, and House Price Index at 8:00 A.M., CB Consumer Confidence, Richmond Fed Manufacturing Index, Richmond Fed Manufacturing Shipments Index, and Richmond Fed Services Revenues Index at 9:00 A.M., Dallas Fed Services Index, Dallas Fed Services Revenues Index, and NY Fed Treasury Purchases 22.5 to 30 yrs. at 9:30 A.M. 2-Year Note Auction and Money Supply at 12:00 P.M., and API Energy Stocks at 3:30 P.M.
US egg prices have made it back to business TV channels and print media headlines in recent days, and for good reason. Last week, the USDA reported that an average wholesale price for a dozen eggs delivered to New York stores was at $4.41. For the week, the stores delivered price was up $.27 and has gained $2.03 in the last 6 weeks. It was the highest price since January 2023, and there have been just 5 weeks that 2023, and there have been just 5 weeks that the price was higher. Those were 5 consecutive weeks that occurred from early December 2022 to early January 2023. Ag Resources (ARC) has a graphic that plots weekly wholesale and monthly retail prices, with last week’s wholesale and monthly retail prices, with last week wholesale price $1.33/dozen, 43% above the national average July retail price. Note the egg prices have been trending higher from the 2023 low but avian flu losses have sent egg prices sharply higher in recent weeks. The August WASDE estimated 2024 production would be unchanged from 2023, and 2025 production would increase 4%. And we have heards crickets from Joe & Kamala in this matter and the economy, which isn’t close to being the strongest Joe. We also heard crickets on the 3rd anniversary of the schizophrenic withdrawal from Afghanistan causing the death of 13 brave marines killed by a terrorist that slipped through the cracks. Whose accountable?
Central US Weather Pattern Discussion
Heat Dominates US, Europe, Black Sea Region This Week; Needed Rain Forecast in TX/OH in 6-10 Day Period:
US forecast is consistent with prior runs and the major forecasting models are in good agreement. Dangerous heat will be spread across the E Plains, Midwest, and Delta Mon-Wed. Temps peak Tuesday afternoon, with max highs pegged in the mid/upper 90’s across MD, IL, IN, OH, KY, and TN. NOAA’s heat advisory forecast today across these states. The temp pattern moderates by late week, but abnormally high temps will linger across the mid-South & Southeast Wed-Thurs. Heavy T-storms impact the Dakotas/MN in the next 24 hours. Heavy and welcomed rainfall upward of 1-3” is forecast in TX/OK Sep 2-3. Otherwise an arid trend persists across the heart of the Corn Belt into Sep 5th . The change in the Midwest crop ratings next week is important.
US Corn Export Demand
The US corn market continues to probe for a bottom as many in the spec community expect the US to hike not lower US yield in it’s September report. NASS enumerators will be heading to the field late this week and early next to measure US corn yields. It’s true that a US yield of 185 or higher absorbs completely ARC’s projected growth in demand, but it remains clear that demand has been uncovered below $4.00, basis spot futures. Total question today is centered on whether US production offsets this an allows US corn stocks to increase in the 2024/25 crop year? New crop sales have jumped as importers think more about forward coverage – and amid rather competitive US offers. Old crop disappearance also remains historically elevated for late summer. Physical US corn exports tend to collapse once South American supplies enter the global pipeline in July. This year there has been no material decline in weekly US corn shipments, which shows the disruption to supply availability from the Ukraine, Brazil, and Argentina.
CBOT Corn Scores A New Contract Low via September Liquidation; US Gulf Basis Rallies Sharply; US Corn Crop GD/EX Ratings Down 2% and IL down 3%:
World corn markets ended lower. The remainder of September longs are being liquidated prior to Friday’s first notice day. Other breaking news was absent. The US corn crop is rated at 65% GD/EX, vs. 67% the previous week and vs. 61% on average. ARC expects GD/EX ratings to drop another 2-3% next Monday following this week’s heat as rainfall stays absent from the C Plains and the fat crop areas of the Midwest. Corn foliar diseases are flourishing which will cause a premature death of a corn plant that impacts seed test weight. Tar spot, grey leaf spot, and corn blight sightings/reports are becoming numerous. (And spread plant to plant very quickly) Gulf corn basis on Monday is up $.09/Bu and has rallied $.19/Bu in the last week. This puts US origin inline with competing origins but also foreshadows and ongoing active US corn export program this autumn.
ARC maintains that December corn is undervalued unless it’s proven that the US corn yield is at or above 184 BPA. Last half of August heat/dryness and September dryness is tugging the US corn yield lower. 2024 will produce a record corn yield, but the final will be 180 BPA or below via summer corn foliar disease.
Read Full Story »»»
DiscoverGold
Record corn yields continue to pressure prices lower for the commodity
By: Markets & Mayhem | August 27, 2024
• Record corn yields continue to pressure prices lower for the commodity.

Read Full Story »»»
DiscoverGold
Arabica Coffee, "The Good Stuff," is approaching all-time highs set more than 2 years ago
By: Barchart | August 26, 2024
• Arabica Coffee, "The Good Stuff," is approaching all-time highs set more than 2 years ago.

Read Full Story »»»
DiscoverGold
Natural Gas Reaches Key Support, Eyes Reversal
By: Bruce Powers | August 26, 2024
• Natural gas hit new lows, breaking key Fibonacci levels, with support possibly forming. A rally above 2.02 could signal a potential bullish reversal.
Lower prices were on the agenda for natural gas on Monday as it fell to a new retracement low of 1.94 before finding intraday support. Monday’s decline exceeded the 78.6% Fibonacci retracement at 1.97 and completed a descending ABCD pattern that is extended by the 161.8% golden ratio at 1.95. Those two price targets were mentioned previously, and they represent a maximum potential retracement before the chance of a bearish continuation to challenge support around recent lows of 1.88 increases.

Rising Trendlines Confirms Support Zone
Notice that a rising trendline starting from the April swing low identifies potential support around today’s low. Combined with the 161.8% ABCD target, natural gas has reached a price level where support may be strong enough to turn the price of natural gas back up. But first let’s look at the potential for further downside. A decline below today’s low of 1.94 will signal the possibility for a deeper bearish retracement.
The 88.6% retracement at 1.93 identifies the next lower target. If that price level fails to lead to a bullish reversal, the early-August swing low around 1.88 becomes a target and the potential for a bearish continuation below that price level increases. Also, notice that the orange 50-Day MA is beginning to dip below the blue 200-Day MA. This is a sign of weakening and the significance will depend on the follow-through to the downside or whether a bullish reversal takes command.
Bullish Reversal Above 2.02
On the upside, a potential one-day bullish reversal will be triggered on a rally above today’s high of 2.02. If triggered to the upside natural gas would next be heading towards potentially minor resistance around last Thursday’s low of 2.03, followed by the 20-Day MA at 2.105. The 20-Day line is key relative to the current chart pattern for natural gas. It maintained support for only a limited time recently following a rise back above the line on August 8. This week’s decline is a failure of support at the 20-Day line, and it follows months since June 26 when natural gas dropped back below the 20-Day MA.
Read Full Story »»»
DiscoverGold
The Corn & Ethanol Report. Bears Still In Control Despite the Upside Potential
By: Daniel Flynn | August 26, 2024
We kickoff the day with Durable Goods Orders MoM, Durable Goods Orders Ex Transportation MoM, Durable Goods Orders ex Defense MoM, and Non Defense Goods Orders Ex Air at 7:30 A.M., Dallas Fed Manufacturing Index at 9:30 A.M., Export Inspections at 10:00 A.M., 3-Month & 6-Month Bill Auction at 10:30 A.M., and Crop Progress at 3:00 P.M.
Latest news on Canadian Rail Strike
A decision obliging more than 9,000 Canadian rail workers to stay on the job is a win for the railways and could impact bargaining in other federally regulated sectors like aviation, the head of a Canadian rail workers’ union told Reuters. Paul Boucher, president of the Teamsters Canada Rail Conference, also said the union would work with other labour groups as it mounts a legal challenge to a Saturday decision that halted work stoppages at the country’s two largest railways and imposed arbitration. Boucher also said, “ The Canadian rail decision is a win for companies.” In summary: * Union to mount legal challenge against the decision,* Air Canada pilots concerned how the ruling will affect their talks,* Both railways say they would have preferred a negotiated settlement,* CN & CP railways are focusing on restoring service.
The Census Bureau reported that new home sales in July jumped 10.6% from June and were 5.6% larger than a year ago at 739,000 homes. This marked the 2nd consecutive month higher and the 2nd month of year-over-year gains. It was also the highest monthly new home sales figures since May 2023 and the second highest since February 2022. On Thursday, the National Association of Realtors reported that existing home sales rose 1% from June but were still 2% less than a year ago at 3.95 Mil homes. This marked the 36th straight month of year-over-year declines. Total home sales of 4.689 Mil homes were up 3% for the month and 1% less than a year ago, but it’s under the covid low, and just above the 12-year low that was set in late 2023.
ARC Central US Weather Pattern Discussion
Central US Forecast Drier into Sep 6; Spotty Showers Impacts Dakotas, MN,WI; Heat Incoming:
The Central US forecast maintains a pattern of net soil loss across the Plains, Delta and S Midwest into Sep 6th . Moderate showers of .25-1.00” are forecast across the NW Midwest next Thurs-Sat, but confidence is low with respect to coverage. ND, MN, and WI are favored. ARC notes that model guidance features an uptick in tropical activity after Sep 4th, but US landfall remains unlikely. Finishing conditions are the concern. Following a rather mild August, heat pulses across the Central US Sat-Tues. Temps peak on Monday, when highs in the mid/upper 90’s stretch from the Southern Plains, into IA, IL, and KY. Sep climate guidance remains warm/dry. This pattern is probable without the arrival of Gulf tropical storms.
CBOT futures are lower with corn and wheat futures scoring new contract lows. Pro Farmer’s US corn yield estimate of 181.1 BPA provided only temporary support, while its US soybean yield forecast of 55 BPA was deemed to be outright bearish. September First Notice Day deliveries and the end of the month looms Friday. There are 424 contracts of Chicago wheat, 15 contracts of corn, and 10 contracts of soybeans are registered for delivery In the products, no soybean meal and 415 soybean oil are registered. Wheat and soybean oil receipts have been in decline since July.
CBOT open interest fell 23,766 contracts in corn, 1,637 contracts in soybeans, and 10,105 contracts in Chicago wheat following option expiration last Friday. Soybean oil open interest was down 6,827 contracts, while soybean meal was off 639 contracts. Liquidation persisted on Friday.
Read Full Story »»»
DiscoverGold
Corn closes at lowest level since October 2020
By: Barchart | August 23, 2024
• Corn closes at lowest level since October 2020.

Read Full Story »»»
DiscoverGold
Natural Gas Key Levels to Watch as Bear Trend Deepens
By: Bruce Powers | August 23, 2024
• Natural gas continues its bearish slide, dropping to 2.00, signaling potential for further declines if key resistance levels aren't recaptured.
Natural gas continued its bearish correction on Friday with a drop to a new retracement low of 2.00 before finding support. The 61.8% Fibonacci retracement at 2.04 was exceeded to the downside and the 127.2% extended target for a falling ABCD pattern completed at 2.02. Neither managed to sustain support leaving open lower price levels.
At the time of this writing natural gas is on track to close weak, in the lower third of the day’s trading range. If the close today is similar, sellers will have dominated trading into the close and may do so again heading into next week.

Finishing Week in Bearish Position
Today’s bearish behavior in the price of natural gas improves the chance that it may be heading to lower price levels before the retracement is complete. In addition, on the weekly time frame a bearish weekly reversal triggered this week, and the week is set to end with a bearish red candlestick pattern and a close near the lows for the week. This will set up a bearish signal below this week’s low. The next lower price target is at the 78.6% Fibonacci retracement at 1.97. A little lower is the 161.8% extended target for a small declining ABCD pattern at 1.95.
Rally Above Today’s High Will Show Strength
Nonetheless, natural gas found support today at 2.00 and it could continue to hold above that price level leading to a bullish reversal. A rally above today’s high of 2.07 would be a sign of strength with natural gas first heading towards the 20-Day MA, now at 2.11. If the 20-Day line can be recaptured natural gas will have a chance to proceed higher.
Resistance at Moving Averages
The next higher key resistance zone that would need to be recaptured is the recent swing high and last week’s high of 2.30. However, there are two moving averages nearby that need to be considered as well. The 200-Day MA is also at 2.30 and the 50-Day MA is at 2.305. Therefore, recapturing the 2.30 high and moving averages will put natural gas in a position to proceed higher. Until then, they may continue to identify an area of potential resistance.
Read Full Story »»»
DiscoverGold
Coffee soars to All-Time High
By: Barchart | August 23, 2024
• Coffee soars to All-Time High.

Read Full Story »»»
DiscoverGold
Grains Report: Wheat, Rice, Corn and Oats, Soybeans, Canola and Palm Oil
By: Jack Scoville | August 23, 2024
• WHEAT
General Comments: Wheat was lower in all three markets on stable overseas prices reported in Russia and Europe against the wrap up of the Wheat harvest and reports of cash movement here in the US. US harvest progress and ideas of good crops went against reports of dry weather in eastern Europe and Russia and too wet weather in France and Germany along with Spring Wheat areas of Russia are still heard and the weather there affecting world production estimates. There were more reports of dry conditions coming this week to Russian growing areas although Spring Wheat areas have seen too much rain. Eastern Europe is also hot and dry. Western Europe has seen too much rain.
Overnight News:
Chart Analysis: Trends in Chicago are down with no objectives. Support is at 502, 496w, and 490 September, with resistance at 524, 536, and 548 September. Trends in Kansas City are down with no objectives. Support is at 521, 516, and 510 September, with resistance at 540, 559, and 567 September. Trends in Minneapolis are down with no objectives. Support is at 562, 556, and 550 September, and resistance is at 584, 601, and 613 September.
• RICE
General Comments: Rice closed higher yesterday on what appeared to be speculator buying as the harvest moves along to completion. The US weather has been an issue much of the growing season with too much rain early in the year. Some areas are now too dry, especially in Texas, and Texas yields are down as a result as the harvest moves forward. However, planted area has increased from last year and so most are looking for a rebound in production this year
Overnight News:
Chart Analysis: Trends are mixed. Support is at 1471, 1453, and 1449 September and resistance is at 1504, 1509, and 1516 September
• CORN AND OATS
General Comments: Corn and Oats closed lower yesterday on what appeared to be speculative selling. The Pro Farmer crop tour has concluded and found good Corn and Soybeans crops in Iowa and Minnesota. Yields for both states were calculated to be slightly below USDA estimates. Increased US demand comes from the fact that Corn prices are already the cheapest in the world. Current forecasts call for cooler and drier weather for the Midwest this week.
Overnight News:
Chart Analysis: Trends in Corn are down with no objectives. Support is at 367, 364, and 361 September, and resistance is at 385, 390, and 402 September. Trends in Oats are mixed. Support is at 313, 308, and 300 September, and resistance is at 336, 348, and 358 September
• SOYBEAN
General Comments: Soybeans and the products were lower yesterday on speculative short covering generated by a stronger demand news and news from the Pro Farmer crop tour. Trader reported good production potential from the Pro Farmer crop tour in Iowa and Minnesota. Pod counts were a little below current USDA estimates. This week should be dry and temperatures should turn warmer later this week amid dry weather and western areas should stay warm and dry. Reports indicate that China is buying a lot in the US. Domestic demand has been strong in the US.
Overnight News: Unknown destinations bought 120,000 tons of US Soybeans.
Chart Analysis: Trends in Soybeans are mixed. Support is at 939, 928, and 916 September, and resistance is at 973, 1007, and 1018 September. Trends in Soybean Meal are mixed. Support is at 302.00, 300.00, and 297.00 September, and resistance is at 323.00, 325.00, and 329.00 September. Trends in Soybean Oil are mixed. Support is at 3970, 3860, and 3800 September, with resistance at 4130, 4190, and 4360 September.
• PALM OIL AND CANOLA
General Comments: Palm Oil was higher today on ideas of improving demand as Indonesia intends to increase its use of Palm Oil in its biofuels blends and increase biofuels zto 40% of consumption. Production reports indicate that the increase in production is less than expected at this time. Indian imports of Palm Oil were the highest for the year in July. Exports are 834,948 tons so far this month. Reports indicate that production is rising as well. Export demand has been very strong in recent private reports but has been weaker in recent days. There is talk of increased supplies available to the market, and the trends are down on the daily charts. Canola was lower on ideas of increasing producer offers as oilseed supplies look to be ample in the coming year and as demand ideas are down. The Canadian rail strioke makes movement of grain much more difficult and a lot will get backed up in the system. The weather has called for dry conditions in the Prairies and yields are expected to be the same or less.
Overnight News:
Chart Analysis: Trends in Canola are mixed to down with no objectives. Support is at 562.00, 558.00, and 546.00 November, with resistance at 588.00, 581.00, and 598.00 November. Trends in Palm Oil are mixed. Support is at 3670, 3640, and 3610 November, with resistance at 3780, 3810, and 3820 November.
Midwest Weather Forecast Mostly dry. Temperatures should average near to below normal.
Read Full Story »»»
DiscoverGold
Softs Report: Cotton, OJ, Coffee, Sugar, Cocoa
By: Jack Scoville | August 23, 2024
• COTTON
General Comments: Cotton was lower yesterday on another week of bad export sales reported by USDA. There are still ideas of weaker demand potential against an outlook for improved US production in the coming year. It looks like futures are cheap enough for now but speculators see no reason to buy except to cover short positions as there have been demand concerns about Bangladesh and China and ideas are that production is strong enough. The Delta should have the best looking crops right now, but crops in other areas are more suspect. Texas and the Southeast have seen some extreme heat so far this year, and Texas has also seen dry conditions at times during the growing season. Demand has been weaker so far this year but there are hopes for improved demand with the lower prices.
Overnight News:
Chart Trends: Trends in Cotton are mixed to down with no objectives. Support is at 68.80, 67.40, and 66.30 December, with resistance of 70.80, 73.00 and 73.70 December.
• FCOJ
General Comments: FCOJ closed sharply higher to limit up again yesterday on apparent speculative buying and commercial short covering as ideas of reduced production continue against reports of stronger demand as forecasts call for no tropical activity in the near future in the Atlantic. Futures closed at new contract highs. Nothing appeared threatening in the forecasts for this week as the current tropical system should stay in the ocean and there is nothing in the ocean to suggest that a storm is on its way to Florida. A very active year is forecast and there have been some reports of flooding in the state even with no huge storms. The market remains well supported in the longer term based on forecasts for tight supplies and very hot weather in Florida. The reduced production also appears to be at the expense of the greening disease. There are no weather concerns to speak of for Florida or for Brazil right now.
Overnight News:
Chart Trends: Trends in FCOJ are up with no objectives. Support is at 467.00, 463.00, and 457.00 September, with resistance at 495.00, 500.00, and 506.00 September.
• COFFEE
General Comments: New York and London closed lower yesterday with offers from Vietnam still hard to find but offers from Brazil and Indonesia in the market. Indonesian offers are now less as producers wait for higher prices before selling. The weather forecasters now say that conditions are good in Vietnam, but damage was done to crops earlier in the growing season. There were also reports of poor Robusta yields in Brazil during the harvest due to small bean sizes but offers have been strong so far this season. Arabica yields in Brazil and Colombia are reported to be less this year due to extreme weather in both countries.
Overnight News: The ICO daily average price is now 243.49 ct/lb.
Chart Trends: Trends in New York are mixed to up with no objectives. Support is at 245.00, 237.00, and 230.00 September, and resistance is at 255.00, 261.00 and 264.00 September. Trends in London are up with no objectives. Support is at 4630, 4490, and 4340 September, with resistance at 4970, 5040, and 5100 September.
• SUGAR
General Comments: New York and London closed higher again yesterday on short covering after demand concerns pushed futures to test recent lows. Chinese demand in particular is in focus amid the economic problems seen there. Harvest progress in Brazil and improved growing conditions in India and Thailand are the important fundamentals and growing conditions are turning drier in Brazil. Indian and Thai monsoon rains have been very beneficial and mills are expecting strong crops of cane. They are pushing the governments to allow exports but so far the governments have not agreed. Production estimates were raised in the northern hemisphere. Harvest yields of Sugarcane in Brazil are strong but should start falling but not enough to impact prices much. CONAB said production estimates for this year should be increased, but total production should still be less than last year.
Overnight News:
Chart Trends: Trends in New York are down with no objectives. Support is at 1740, 1710, and 1680 October and resistance is at 1810, 1740, and 1890 October. Trends in London are down with no objectives. Support is at 501.00, 498.00, and 495.00 October, with resistance at 524.00, 533.00, and 544.00 October.
• COCOA
General Comments: New York and London closed higher in consolidation trading on tight supply conditions and reports of good crop conditions for the next crop. Production concerns in West Africa as well as demand from nontraditional sources along with traditional buyers keep supporting futures. Production in West Africa could be stronger this year on improved weather as there are currently good rains in Ivory Coast although cool temperatures are also reported. Ghana has had hot and dry conditions and there are reports that pods are being aborted. The availability of Cocoa from West Africa remains very restricted, but surplus production against demand is expected in the next crop year.
Overnight News:
Chart Trends: Trends in New York are mixed to up with no objectives. Support is at 8970, 8360, and 8050 September, with resistance at 9800, 10310, and 10860 September. Trends in London are mixed. Support is at 6120, 5880, and 5820 September, with resistance at 6880, 7080, and 7320 September.
Read Full Story »»»
DiscoverGold
Commodities Daily Market Movers (% Price Change)
By: Marty Armstrong | August 23, 2024
• Top Movers
Lean Hogs (CME) Futures 4.56 %
Orange Juice (NYCE) Futures 4.34 %
Lumber (CME) Futures 2.44 %
Kuala Lumpor Palm Oil Crude Futures 1.92 %
Palm Kernel Oil 1.71 %
• Bottom Movers
NY Natural Gas Futures 5.7 %
NSW Baseload Electricity Continuous 3.8 %
Oats (CBOT) Futures 3.55 %
Wheat #2 3.47 %
AU - Queensland Base-Load Electricity Futures 3.46 %
*Close from the last completed Daily
DiscoverGold
Here we go again! Orange Juice soars to its highest price since May and is within striking distance of the all-time high
By: Barchart | August 22, 2024
• Here we go again! Orange Juice soars to its highest price since May and is within striking distance of the all-time high.

Read Full Story »»»
DiscoverGold
Natural Gas Falls to Support but Will it Hold?
By: Bruce Powers | August 22, 2024
• Natural gas pulls back sharply from 2.30, testing key support at 2.03. A bullish reversal could spark a new rally if support holds.
Natural gas took the alternate route on Thursday and continued to pullback from the 2.30 high. The 20-Day MA failed to hold as support and it fell to a low of 2.03 before there were signs of support. That low hit the next lower support zone identified over the past couple of weeks that combines the 61.8% Fibonacci retracement with a previous daily support and resistance price zone hit on multiple days previously (blue horizontal). Further testing of support around today’s low may remain on the horizon as a falling ABCD pattern extended by the 127.2% ratio completes a little lower at 2.02.

Bearish Reversal on Weekly Chart Playing Out
There was a bearish reversal triggered on the weekly chart earlier this week and it looks like that is now playing out. Moreover, natural gas remains below both its 50-Day MA and 200-Day MAs, in addition to falling back below its 20-Day MA today. If the 2.02 price area fails to hold as support, then a dip lower may be in the plans. It looks like the next lower price zone is from around 1.95 to 1.92. The lower level is the 78.6% Fibonacci retracement level and the 1.95 level is the target from a falling ABCD pattern extended by the 161.8% ratio.
Bigger Picture Remains Bullish
Despite short-term weakness, natural gas remains on track to progress higher once the retracement is complete. It broke up and out of a falling bull wedge two weeks ago and then rallied to a high of 2.30, which was above a prior swing high at 2.27. That rally also recaptured the 20-Day MA. The bottom at 1.88 on August 5 completed a 40.2% decline from the prior swig high at 3.16. On a percentage basis, that drop exceeded all the prior corrections starting from the February 2023 bottom starting from the February 2023 bottom, except one. The decline from the January peak to the February low was 55.1%.
The current retracement is the first pullback since the bottom reversal since the bottom earlier this month. Once support is found followed by a bullish reversal on some time frame (daily or intraday) It has the potential to lead to a resumption of the developing bull trend. Given the significance of the prior decline a reversal up also has the potential to surprise to the upside.
Read Full Story »»»
DiscoverGold
Daniel Flynn: The Corn & Ethanol Report
By: Daniel Flynn | August 22, 2024
We kickoff the day with Chicago Fed National Activity Index, Initial Jobless Claims, Continuing Jobless, and Jobless Claims 4-Week Average at 7:30 A.M., S&P Global PMI Flash, and S&P Global Manufacturing Index PMI Flash at 8:45 A.M. at 8:45 A.M., Existing Home Sales & Existing Home Sales MoM at 9:00 A.M., EIA Natural Gas Storage at 9:30 A.M., Kansas City Composite Index & Kansas City Fed Manufacturing Index at10:00 A.M., 4-Week & 8-Week Bill Auction at 10:30 A.M., 15-Year & 30-Year Mortgage Rate at 11:00 A.M., 30Year TIPS Auction at 12:00 P.M., Fed Balance Sheet and Jackson Hole Symposium at 3:30 P.M.
In the early hours this morning, freight traffic on Canada’s two largest railways came to a stop for the first time ever. Experts believe this could have a major effect on the US chain. Both US and Canadian chambers of commerce have issued a warning about the stoppage having a “significant impact” on the US and Canadian economies. The rail stoppage is bad news for the US supply chain because the US and Canadian rail networks are closely intertwined. The Canadian National Railway Company and Canadian Pacific Kansas City locked out over 9,000 engineers, conductors, and yard workers after the parties failed to agree on a new contract before Wednesday’s midnight deadline, and are demanding better quality of life and scheduling, among other greivances. The ywo rail companies haul a combined $1 billion in goods each day. Shipping south of the border also rely on the rail giants because the tracks run to the Gulf of Mexico and onward to ports in Mexico. Will keep you updated on new details.
Read Full Story »»»
DiscoverGold
Commodity price changes over last year...
By: Charlie Bilello | August 22, 2024
• Commodity price changes over last year...
Cocoa: +122%
Coffee: +65%
Gold: +33%
Silver: +26%
Zinc: +23%
Aluminum: +17%
Copper: +12%
US CPI: +2.9%
Lumber: -4%
WTI Crude: -9%
Brent Crude: -9%
Wheat: -11%
Natural Gas: -16%
Cotton: -17%
Gasoline: -18%
Corn: -18%
Sugar: -25%
Heating Oil: -26%
Soybeans: -28%
Read Full Story »»»
DiscoverGold
Is Orange Juice eyeing another run at all-time highs? Now trading at its highest price in more than a month
By: Barchart | August 21, 2024
• Is Orange Juice eyeing another run at all-time highs? Now trading at its highest price in more than a month.

Read Full Story »»»
DiscoverGold
Agriculture Master Report
By: Bill Moore | August 21, 2024
NOV BEANS
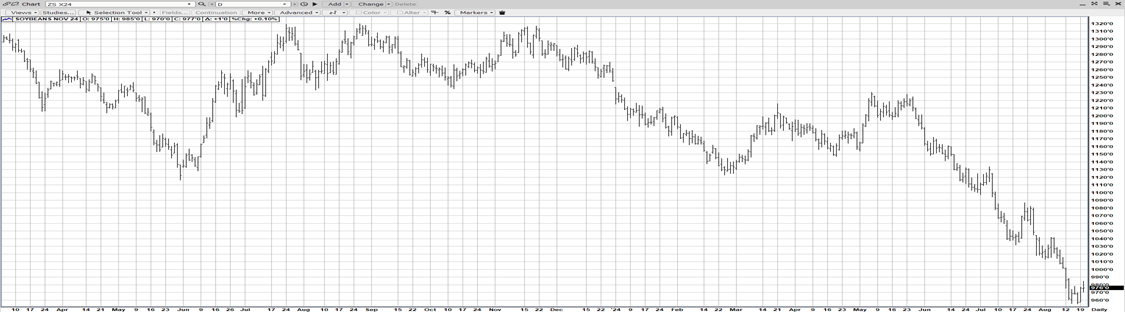
LOW PRICES CURE LOW PRICES! It always happens! And now we’re witnessing this phenomenon one more time! The bearish 8-12-24 USDA REPORT pegged Bean yield at 53.2 BPA & production at 4.589 BB – both records! However, accompanying the large crop are 4-yr low prices – which establish US Beans as the cheapest in the Globe! This has resulted in a powerful surge of export business – already this week, 4 FLASH SALES of beans to China & Mexico! And a US $ on 7-month lows has enhanced the sales. As well, domestic Biodiesel demand is very strong! So, we see the $9.50 low created after the report – as holding this week is the well-respected PRO FARMER TOUR – that we widely expect will confirm the AUGUST WASDE yields issued last Monday! From here on out, we expect a plentiful flow of exports – cheapened even more by a declining US DOLLAR!
DEC CORN

The 8-12-24 AUGUST WASDE was already friendly for Corn with a record yield of 183.1 BPA producing a crop of only 15.147BB – the same as July & under 2023! The reason was increased demand & 700,000 fewer acres! As well, a lower US Dollar has further greased the slide for better exports to the US – already the cheapest game in town! And lower non-US production across the globe is down to drought & disease! The result was lower US & foreign carry-out! $4.00 corn is a 4-year low & seems to be fair value for Dec Corn – whose export potential should be quite high thru harvest! Adding “frosting to the cake” is a very favorable MACRO environment – with the DJI near record highs with at least 2 rate cuts expected by year-end!
DEC WHT

Dec Wht received upside support from a # of different factors – decreased production from Germany (down 13%), France (lowest in 8 yrs) & Russia due to drought! Also, a Canadian Rail Strike is looming & the US DOLLAR is plummeting! Monday Inspections are running 25.9% over 2023! Winter Wheat is 96% in & HRS is 31% harvested (ly-36)!
DEC CAT

A complete implosion by Dec Cat – as it scored NEW 2024 LOWS – down over $3.00 – in response to increased production, waning demand as we approach Labor Day W/E & fears that the upcoming AUGUST CATTLE-ON-FEED due Friday at 2pm would reflect a large increase in placements (4-5%)! The huge disparity between beef & pork in the supermarket has finally translated into an inversion with plummeting beef & steady pork as the latter assumes upside leadership in the meats!
DEC HOGS

The BULLISH DIVERGENCE of the Dec Hog chart juxtaposed against the Dec Cat chart speaks volumes about the two contracts – as the hogs hold relatively steady as the cattle collapses! The end of the grilling season (LD W/E) as well as general inflation is broadly hurting meat demand – but the cost-conscious consumer is not totally abstaining – but instead opting for the less expensive pork cuts!
Read Full Story »»»
DiscoverGold
Agriculture Fund $DBA - Update Holding its Bullishly Aligned Bi/Wkly 12 /20MA's...
By: Sahara | August 21, 2024
• $DBA #agriculture - Update
Holding its Bullishly Aligned Bi/Wkly 12 /20MA's. It may wish to B/Test the Pattern, yet be aware it already has on a non-adjusted price chart.
Individual Softs are showing some bullish set-ups on the Lwr Time-Frames, so if not in may be worth a look.

Read Full Story »»»
DiscoverGold
Sugar falls to lowest price since October 2022. Time to load up on Halloween candy!
By: Barchart | August 20, 2024
• Sugar falls to lowest price since October 2022. Time to load up on Halloween candy!

Read Full Story »»»
DiscoverGold
All-Time Highs in sight for Coffee
By: Barchart | August 20, 2024
• All-Time Highs in sight for Coffee.

Read Full Story »»»
DiscoverGold
Grains Report: Wheat, Rice, Corn and Oats, Soybeans, Canola and Palm Oil
By: Jack Scoville | August 20, 2024
• WHEAT
General Comments: Wheat was mixed in all three Wheat markets on selling seen in part on weaker overseas prices reported in Russia and Europe and less than inspiring weekly export inspections reported by USDA against general short covering seen in all grains markets. The USDA crop report also hurt Winter Sheat, but supported prices in Minneapolis which closed a little higher for the week. US harvest progress and ideas of good crops went against reports of hot and dry weather in eastern Europe and Russia and too wet weather in France and Germany are still heard and the weather there affecting world production estimates. There were more reports of hot temperatures coming this week to Russian growing areas. It has also been very dry there. Eastern Europe is also hot and dry. Western Europe has seen too much rain.
Overnight News:
Chart Analysis: Trends in Chicago are mixed. Support is at 520, 514, and 508 September, with resistance at 557, 581, and 592 September. Trends in Kansas City are mixed. Support is at 528, 520, and 514 September, with resistance at 559, 567, and 579 September. Trends in Minneapolis are mixed. Support is at 579, 574, and 568 September, and resistance is at 601, 613, and 629 September.
• RICE
General Comments: Rice closed higher yesterday on what appeared to be speculative short covering tied in part to a weaker US Dollar. The US weather has been an issue much of the growing season with too much rain early in the year. Some areas are now too dry, especially in Texas, and Texas yields are down as a result as the harvest moves forward. However, planted area has increased from last year and so most are looking for a rebound in production this year. Supply tightness is expected to give way to increased production this year and greatly increased supplies this Fall.
Overnight News:
Chart Analysis: Trends are mixed. Support is at 1449, 1431, and 1415 September and resistance is at 1509, 1516, and 1532 September
• CORN AND OATS
General Comments: Corn and Oats closed higher yesterday on what appeared to be speculative short covering. The Pro Farmer crop tour has started and found good Corn and Soybeans crops in Ohio. The crops in South Dakota showed signs of heat stress and a lack of rain. Yields for both states were calculated to be slightly below year ago levels. The weekly USDA export inspections report showed strong demand. The increased demand came from the fact that Corn prices are already the cheapest in the world. Current forecasts call for cooler and drier weather for the Midwest this week. Pro Farmer is holding its annual Midwest crop tour this week and most traders expect the tourists to report top yields and record production potential given the USDA reports from last Monday and the weather outlooks.
Overnight News:
Chart Analysis: Trends in Corn are down with no objectives. Support is at 367, 364, and 361 September, and resistance is at 385, 390, and 402 September. Trends in Oats are mixed. Support is at 308, 302, and 296 September, and resistance is at 323, 330, and 336 September
• SOYBEAN
General Comments: Soybeans and the products were higher yesterday on speculative short covering generated by a stronger weekly export inspections report and news from the Pro Farmer crop tour. Trader reported top production potential and traders expect the Pro Farmer crop tour in Ohio, but less than idea conditions in South Dakota. Pod countss were a little below year ago levels. There was more beneficial precipitation in much of the Midwest over the last week. This week should be dry and temperatures should turn cooler amid dry weather this week. Some selling came from reduced demand ideas. Reports indicate that China remains an active buyer of Soybeans in Brazil but is buying a lot in the US as well. Domestic demand has been strong in the US.
Overnight News: Mexico bought 239,492 tons of US Soybeans and Chiuna bought 132,000 tons of US Soybeans.
Chart Analysis: Trends in Soybeans are down with no objectives. Support is at 940 928, and 914 September, and resistance is at 1007, 1018, and 1033 September. Trends in Soybean Meal are mixed to down with objectives of 293.00 September. Support is at 298.00, 295.00, and 292.00 September, and resistance is at 313.00, 316.00, and 323.00 September. Trends in Soybean Oil are mixed. Support is at 3910, 3850, and 3800 September, with resistance at 4130, 4190, and 4360 September.
• PALM OIL AND CANOLA
General Comments: Palm Oil was lower yesterday on export volume weakness as reported by AmSpec. Indian imports of Palm Oil were the highest for the year in July. Exports are 834,948 tons so far this month. Reports indicate that production is rising as well. Export demand has been very strong in recent private reports but has been weaker in recent days. There is talk of increased supplies available to the market, and the trends are down on the daily charts. Canola was higher along with Chicago and on speculative short covering as oilseed supplies look to be ample in the coming year and as demand ideas are down. The weather has called for dry conditions in the Prairies, but growing conditions overall are good.
Overnight News:
Chart Analysis: Trends in Canola are down with no objectives. Support is at 560.00, 558.00, and 546.00 November, with resistance at 591.00, 607.00, and 617.00 November. Trends in Palm Oil are mixed. Support is at 3670, 3640, and 3610 November, with resistance at 3730, 3740, and 3780 November.
Midwest Weather Forecast Mostly dry. Temperatures should average near to below normal.
Read Full Story »»»
DiscoverGold
Softs Report: Cotton, OJ, Coffee, Sugar, Cocoa
By: Jack Scoville | August 20, 2024
• COTTON
General Comments: Cotton was higher yesterday in response to a stronger US Dollar and Chicago grains and oilseeds and also Crude Oil futures in New York. There are still ideas of weaker demand potential against an outlook for improved US production in the coming year. It looks like futures are cheap enough for now but speculators see no reason to buy except to cover short positions as there have been demand concerns about Bangladesh and China and ideas are that production is strong enough. The Delta should have the best looking crops right now, but crops in other areas are more suspect. Texas and the Southeast have seen some extreme heat so far this year, and Texas has also seen dry conditions at times during the growing season. Demand has been weaker so far this year but there are hopes for improved demand with the lower prices.
Overnight News:
Chart Trends: Trends in Cotton are mixed to down with no objectives. Support is at 65.20, 64.60, and 63.40 December, with resistance of 70.80, 73.00 and 73.70 December.
This Week Last Week Last Year Average
Cotton Setting Bolls 84 74 78 81
Cotton Bolls Opening 19 13 17 17
Very Poor Poor Fair Good Excellent
Cotton This Week 8 18 32 35 7
Cotton Last Week 9 16 29 39 7
Cotton Last Year 22 24 21 27 6
• FCOJ
General Comments: FCOJ closed lower on forecasts for no tropical activity in the near future in the Atlantic. Nothing appeared threatening in the forecasts for this week as the current tropical system should stay in the ocean and there is nothing in the ocean to suggest that a storm is on its way to Florida. A very active year is forecast and there have been some reports of flooding in the state even with no huge storms. The market remains well supported in the longer term based on forecasts for tight supplies and very hot weather in Florida. The reduced production also appears to be at the expense of the greening disease. There are no weather concerns to speak of for Florida or for Brazil right now.
Overnight News:
Chart Trends: Trends in FCOJ are mixed. Support is at 415.00, 410.00, and 393.00 September, with resistance at 467.00, 471.00, and 479.00 September.
• COFFEE
General Comments: New York and London closed higher yesterday on a weaker US Dollar and with offers from Vietnam still hard to find but offers from Brazil and Indonesia in the market. The weather forecasters now say that conditions are good in Vietnam, but damage was done to crops earlier in the growing season. There were also reports of poor Robusta yields in Brazil during the harvest due to small bean sizes but offers have been strong so far this season. Arabica yields in Brazil and Colombia are reported to be less this year due to extreme weather in both countries.
Overnight News: The ICO daily average price is now 233.61 ct/lb.
Chart Trends: Trends in New York are mixed. Support is at 230.00, 228.00, and 225.00 September, and resistance is at 252.00, 255.00 and 261.00 September. Trends in London are mixed. Support is at 4320, 4190, and 4070 September, with resistance at 4740, 4800, and 4860 September.
• SUGAR
General Comments: New York closed mostly a little higher and London closed a little lower yesterday. Harvest progress in Brazil and improved growing conditions in India and Thailand are the important fundamentals and growing conditions are turning drier in Brazil. Indian and Thai monsoon rains have been very beneficial and mills are expecting strong crops of cane. They are pushing the governments to allow exports but so far the governments have not agreed. Production estimates were raised in the northern hemisphere. Harvest yields of Sugarcane in Brazil are falling but not enough to impact prices much.
Overnight News:
Chart Trends: Trends in New York are mixed. Support is at 1770, 1740, and 1710 October and resistance is at 1890, 1910, and 1950 October. Trends in London are mixed to down with no objectives. Support is at 504.00, 498.00, and 492.00 October, with resistance at 533.00, 538.00, and 544.00 October.
• COCOA
General Comments: New York and London closed a little higher in consolidation trading last week as tight supply conditions and reports of good crop conditions for the next crop. Some support came from a weaker US Dollar. Production concerns in West Africa as well as demand from nontraditional sources along with traditional buyers keep supporting futures, but this support is running its course and the market is searching for a new bullish fundamental. Production in West Africa could be reduced this year due to the extreme weather which included Harmattan conditions. The availability of Cocoa from West Africa remains very restricted, but surplus production against demand is expected in the next crop year.
Overnight News:
Chart Trends: Trends in New York are mixed to up with no objectives. Support is at 8000, 7690, and 7340 September, with resistance at 9540, 9800, and 10310 September. Trends in London are mixed. Support is at 6250, 5880, and 5820 September, with resistance at 6880, 7080, and 7320 September.
Read Full Story »»»
DiscoverGold
Corn Bearish Trend On Last Legs. The Corn & Ethanol Report
By: Daniel Flynn | August 20, 2024
We kickoff the day with Redbook YoY at 7:55 A.M., NY Fed Treasury Purchases FRN’s 0 to 20 yrs. At 9:30 A.M., 42-Day Bill Auction at 10:30 A.M., Fed Bostic Speech at 12:35 P.M., Fed Barr Speech at 1:45 P.M., and API Energy Stocks at 3:30 P.M.
The Conference Board Leading Economic Index for the US was down 0.6% for the month in July and was 5.2% below a year ago. The index has been unchanged or lower for 29 consecutive months exceeding the 2007-2009 recession declines and marking a record number of consecutive month of declines since the Index began in 1960. It’s also the longest period of decline without an official recession being declared. The index also marked year-over-year declines for 25 consecutive months, and fell below the Covid low, to mark the lowest point since November 2016, the Obama years. The July decline was due to widespread weakness among non-financial components of the index such as a sharp decline in new orders, weak consumer expectations of business conditions, lower building permits, and hours worked in manufacturing, along with still negative yield spreads. The Conference Board expects that real US GDP growth will continue to slow 0.6% in Q3, and just 1% in Q4. Throw in price caps the economy would slow down even further and devastate your local grocers, whose profits after logistics and fresh food, and their profit margin is currently 1%. This will also cause empty shelves and cause more business’ es to go belly-up causing more panic in the food chain and also increasing the misery index. Our problem here is we have politicians making fiscal policies when the majority of politicians have no experience in running a business. Doing the math middle-class households lost $25,000 under the current administration. Now that we covered price cap’s, tax hikes on corporations will guarantee even worse unemployment, leading us further into the abyss.
US Weather Forecast Adds Rain to East Coast Aug 29-Sep 3; Arid Pattern Impacts Ag Belt Next Two Weeks:
The major forecasting models agree that moderate to heavy rainfall returns to the eastern third of the US in the 11-15 day period, while mild temps but near complete dryness will be intact across the Plains, Midwest, and Delta refion indefinitely. The tropics will be active but storms largely stay off the eastern seaboard in the near term. The hurricane season so far has been much less impactful than previously forecast. Fortunately, extreme heat will stay anchored across southern/western Plains and Delta/southwest. Highs in mid/upper 90’s are forecast in TX, OK, KS, and AR beginning this weekend. Highs in the upper 80’s/ low 90’s spread into the principal Midwest Aug 25-29. A warm/dry early autumn is probable if hurricanes stay absent.
CBOT soybeans gained on export demand, and corn futures ended higher, the Ukrainian and Brazilian fob premiums were down slightly. Corn also recovered on enlarged old crop export disappearance. Pro Farmer’s daily yield assessments are awaited, but the market’s measuring of risk is projected to be more two-sided through the balance of the month. Importantly, corn’s bearish seasonal trend ends in late Aug/ early Sep, while Ag Resources (ARC) expects 23/24 carryover stocks to be trimmed another 25 Mil Bu amid larger exports. Export Inspections in the week ending Aug 15th at 46 Mil Bu. Pace analysis suggests August Census exports could be 185-200 Mil Bu, vs. 105 Mil last year. The US crop was rated at 67% good-to-excellent, unchanged for a third week and vs. 61% on average in mid-August. NASS’s Aug report, this year’s yield debate will be muted and center on a range of 181.0-184.0 BPA. Exports will be offset yields. ARC wrote, be prepared for tradable lows to be scored at or prior to September first notice day.
Read Full Story »»»
DiscoverGold
Commodities Daily Market Movers (% Price Change)
By: Marty Armstrong | August 20, 2024
• Top Movers
Eggs 10.36 %
NY Natural Gas Futures 5.28 %
London Aluminum Spot 4.06 %
Cocoa (NYCSCE) Futures 3.54 %
NY Aluminium Futures 3.11 %
• Bottom Movers
Tokyo Corn Futures 5.29 %
AU - Victoria Base-Load Electricity Futures 3.31 %
Oats (Minneapolis) 3.26 %
London IPE Brent Crude Futures 2.54 %
London IPE Brent Crude Futures 2.54 %
*Close from the last completed Daily
DiscoverGold
Natural Gas Rebounds, Targets 200-Day MA Amid Bullish Momentum
By: Bruce Powers | August 19, 2024
• Following a successful test of the 20-Day MA, natural gas shows strong reversal, targeting key resistance and higher price levels.
Natural gas dipped lower earlier on Monday before finding support at the 20-Day MA and turning up. It has since established a reversal day as it has risen above Friday’s high following a drop below the low of Friday. The low for the day was 2.10 and the 20-Day line is at 2.10. At the time of this writing natural gas continues to trade near the highs of the day, currently 2.245, and above Friday’s high of 2.22. Strength seen today should be followed by further signs of strong upward momentum.

Bullish One-day Reversal
Given today’s bullish reaction following a successful test of support at the 20-Day MA, the pullback in natural gas is likely complete. The developing uptrend should be ready to attempt to recapture the 200-Day MA on a move above 2.33. That level can be combined to show a potential price resistance range from 2.33 up to the 50-Day MA at 2.38. In between is the 38.2% Fibonacci retracement at 2.37. Together, a range from 2.33 to 2.38 is identified.
Rise Above 2.30 Triggers Bull Continuation
An advance above the recent swing high of 2.30 will trigger a continuation of the rally that began from the recent 1.88 swing low. It will follow a pullback to the 50% retracement zone. Active investors may use the first pullback off a bottom as it can be one of the better locations to get a stronger reward to risk ratio. Downside is limited to the low of the pullback, while upside is relatively more significant. However, there are technical indications pointing to higher prices.
New ABCD Pattern Targets 2.52
A new swing low is established today, assuming it is retained as support. This allows for a new rising ABCD pattern or sequential measured moves (orange) to be established. A larger rising ABCD pattern is shown in purple with a long-term target of 3.46. The new and smaller ABCD pattern shows an initial target of 2.52 and a 127.2% extended target of 2.63. Notice that the first level is associated with the 50% retracement (green). Meanwhile, the extended target is near the 61.8% Fibonacci retracement at 2.67. Together they generate a price range from 2.63 to 2.67.
Read Full Story »»»
DiscoverGold
Free Markets Seek Own Level. The Corn & Ethanol Report
By: Daniel Flynn | August 19, 2024
We kickoff the day with Fed Waller Speech at 8:15 A.M., CB Leading Index MoM at 9:00 A.M., Export Inspections at 10:00 A.M., 3-Month & 6-Month Bill Auction at 10:30 A.M., and Crop Progress at 3:00 P.M.
US housing starts in July fell 6.8% from a year ago. This marked the 3rdconsecutive month below last year, and it was the lowest monthly housing starts figure since May 2020, the height of the pandemic! US housing starts of 1.238 Mil homes was the smallest since July 2018. Building permits issued in July were 3% less than a year ago at 1.396 million versus the average trade estimate of 1.43 million. Permits for buildings with 5 units or less fell 12.4%$, while single-family permits were down 0.1%. It was the smallest July building permit total since 2019. The US housing market is in retreat.
Central US Weather Pattern Discussion
August Central US Rain More Scattered Showers in Nature; Dry Trend Forecast into Sep 1st:
Rains have exited the far eastern Midwest/KY and a drier pattern will be established through the remainder of August. Ag Resources (ARC) showed a graphic that displayed Aug 1-25th % of normal rainfall and assumes the current 10-day forecast is correct. Recent rainfall in ND, IA, MO, and northern Illinois provides the moisture needed to finish crops, but the month looks to be a story of have and have nots. Rapid soil moisture loss impacted Southern Illinois, the Plains, and Delta. An expansion of high-pressure Ridging dominates the N American weather pattern into Sep 1. Precipitation will be confined to lite/moderate ridge-riding sysrems across the N Plains and Ontario. Fortunately extreme heat stays absent from the primary Corn Belt. Temps in the upper 80’s/low 100’s blanket the S Plains, NE, and Delta/Southeast. Flash droughts will form and have an adverse impact on late maturing crops.
Pro Farmer Crop Tour Preview
The largest private crop tour in the United States kicks off today. The tour, organized by agricultural newsletter Pro Farmer, deploys teams of volunteer scouts to survey hundreds of corn and soybean fields across a seven-state area of the Midwest. There are both eastern and western legs of the tour. The states surveyed include: OH, IN, IL, MN, IA, SD, and NE. Results of the tour-surveyed state and forecasted national yields for corn and soybeans will be released Thursday. The traditional estimating procedure for corn has been counting harvestable ears in two 30’ long rows. Length and girth of the ears are checked by selecting three specific corn ears from each row – the 5th, 8th and 11th ear. Ears are taken irrespectively of size, and then the length (of grain bare cobs and aborted kernels are not counted) and girth are measured for each ear, along with kernel counts. Yield is derived by multiplying the average ear population by the average number of kernel rows, and divided by row width. CBOT futures are mixed to start the week with world wheat futures are sagging while summer row crop futures bounce ahead of the start of the Pro Farmer Crop Tour. With the DNC in Chicago my advice is simple, you already fixed the economy, alright, and moving to the Affordable Health Care Act is just another reason to desire LESS GOVERNMENT. Price caps and Government healthcare historically never work. Ask Gray Davis how price caps on energy worked for California. The only way to fix the economy is the private sector, tax cuts will benefit all, and is a job creator, not what we’ve seen the past 4-years. And look at Venezuela, these policies do not work and lead to socialism and communism.
Read Full Story »»»
DiscoverGold
Soybean price falls to lowest level since September 2020
By: Barchart | August 16, 2024
• Soybean price falls to lowest level since September 2020

Read Full Story »»»
DiscoverGold
Corn now at its lowest level since October 2020
By: Barchart | August 16, 2024
• Corn now at its lowest level since October 2020

Read Full Story »»»
DiscoverGold
Natural Gas Faces Bearish Reversal Amid Market Pullback
By: Bruce Powers | August 16, 2024
• Natural gas is poised for a bearish weekly reversal, with key support levels being tested as market pullback challenges recent bullish trends.
Natural gas is on track to end the week in a bearish position, closing near the lows of the week. Selling continues to dominate at the time of this writing as trading persists near the lows of the day. The week is set to end with a bearish shooting star candlestick pattern on the longer time frame weekly chart. And on the daily chart natural gas is next primed to test support around the 20-Day MA, currently at 2.10.

Bearish Weekly
A daily bearish shooting star pattern triggered today on a drop below Thursday’s low of 2.19. Thursday’s rally tested resistance around the July swing high as natural gas reached 2.27. But it quickly encountered resistance that led to the weekly shooting star candle. This is a normal and typical pullback as the first rally off the bottom retraces prior gains. Along with the 20-Day MA, watch the 50% retracement zone at 2.09. If the 50% level fails to hold as support, then the next lower target zone looks to be around the confluence of the 61.8% Fibonacci retracement at 2.04 and prior daily support and resistance levels
Given the weekly pattern, a drop below this week’s low will signal a bearish reversal on the weekly time frame. However, since it is occurring falling a strong bottom and a bullish breakout from a falling wedge pattern (orange lines), the pullback is anticipated to eventually resolve itself to the upside with a continuation of the bull trend. This is likely only the beginning of a bullish reversal of the trend. This week’s pullback is the first downswing since the bottom at 1.88 (A) in early August.
Normal Pull Following Initial Rally
Once the pullback completes natural gas should begin to reach higher price levels beginning with the 200-Day MA, currently at 2.335. Since the next upswing would be the first test of resistance around the 200-Day line since it failed to hold as support in early-July, there is a good chance price would be rejected to the downside at first. Moreover, as a pullback progresses the 200-Day line may fall further and potentially converge around this week’s high and provide a more significant pivot.
Read Full Story »»»
DiscoverGold
Soybean price falls to lowest level since September 2020
By: Barchart | August 16, 2024
• Soybean price falls to lowest level since September 2020.
Read Full Story »»»
DiscoverGold
The Corn & Ethanol Report
By: Daniel Flynn | August 15, 2024
We kickoff the day with Export Sales, Export Prices MoM & YoY, Import Prices MoM & YoY, Retail Sales MoM & YoY, Initial Jobless Claims, NY Empire State Manufacturing Index, Philadelphia Fed Manufacturing Index, Retail Sales Ex Autos MoM, Continuing Jobless Claims , Jobless Claims 4-Week Average, Philly Fed Business Conditions, Philly Fed CAPEX Index, Philly Fed Employment, Philly Fed New Orders, Philly Fed Prices Paid, and Retail Sales Ex Gas/Autos at 7:30 A.M., Fed Musalem Speech at 8:10 A.M., Industrial Production MoM & YoY, Manufacturing Production MoM & YoY, and Capacity Utilization at 8:15 A.M., Business Inventories MoM, NAHB Housing Market Index, and Retail Inventories Ex Autos MoM at 9:00 A.M., EIA Natural Gas Storage at 9:30 A.M., 4-Week & 8-Week Bill Auction at 10:30 A.M., 15-Year & 30-Year Mortgage Rate and NOPA Crush Report at 11:00 A.m., Fed Harker Speech at 12:10 P.M., Net Long-term TIC Flows, Foreign Bond Investment, and Overall Net Capital Flows at 3:00 P.M., and Fed Balance Sheet at 3:30 P.M.
The US July CPI Inflation rate came in right as expectations of 2.9%, which was the lowest since March 2021, when the pandemic was just getting underway. While the inflation rate fell to a 40-month low, the Consumer Price Index rose to a record high of 330.6, though the food inflation rate was steady at 2.2%. The Meat Price Index set a record high of 338.4, while the Housing Price Index set a record high 335.1. The Education and Communication set a recordhiugh of 146.2, and Other Goods & Services Price Index was up fractionally from June but down 2% from a year ago.
Weather Models Agree on Lengthy Dry Pattern in Central US Beyond Next 2-3 days; Heat to Favor Plains/Delta:
The EU, GFS and AI models agree that rainfall of 1 +” impacts ND, MN, IA, IL, and WI into Friday, but also that a much drier pattern emerges thereafter. High pressure Ridging current aloft the far southern US expands to cover the Southern & Central Plains during the second half of August. The jet stream, and meaningful precipitation, is forced northward. Soil moisture changes will be monitored. Fortunately, extreme heat stays absent from the primary Corn Belt. Coming rainfall across ND and Upper Midwest will be welcomed. Dryness concerns stay in place across the Plains and Delta, with high temps next week across TX, OK, KS, NE, and LA to reach the upper 90’s & low 100’s. Hurricane activity stays in the Atlantic, rather than the Gulf. No landfall is indicated in the next two weeks.
Ag Resources (ARC) updated global trade matrix for crop year 2024/25 based on the Oct-Sep international year. ARC’s primary message is that it’ll be rather difficult to keep 24/25 below 2,350 Mil Bu, and it’s possible US exports reach 2,400-2,450 Mil Bu if world trade is unchanged year-over-year or if a cooling equatorial Pacific triggers dryness in Argentina & Brazil this autumn and winter. South American Oct-Sep exports are reduced amid lower 2024 crop sizes. South American exports in summer 2025 won’t offset losses over the next 6-7 months relative to USDA’s forecast. Ukrainian & Russian shipments are lower due to drought. Note ARC’s US export forecast is above USDA despite lower projected total world trade. And there are doubts surrounding USDA’s projected decline in global corn trade in 24/25. ARC had a graphic displays exporter shipments through July based on government or ship lineup data. Cumulative Oct-Jul exporter shipments total a record 150 MMT’s, vs. 130 last year. Spring/early summer exports from Ukraine were much larger than expected – which has exhausted supplies there. It’s clear importers/end users since last autumn have responded positively to lower prices. CBOT corn at $4.00, and world fob prices of $1.85-$1.95/MT are not expected to curtail future use. The pace of monthly trade must be followed, but years of world trade contraction have been rare in the last decade. If trade does not contract, US export forecasts must be increased. ARC also notes that 2023/24 was not a stocks – building year for most importers. Combined end stocks in Algeria, Japan, South Korea, Mexico, Saudi Arabia, Taiwan, and Vietnam. Larger imports un these countries were absorbed by higher domestic use, which USDAS projects in 23/24 was a record 102 MMT’s, vs. 97.6 the previous year. USDA projects these importer stocks to decline further in 2024/25. At some point re-stocking will be needed. Brightening US corn export potential is key in the long run. Focus on supplies almost exclusively persists through the balance of August, but it’s difficult to be bearish corn thereafter as total consumption surpasses 15 Bil Bu. Theres less tolerance foir South American weather issues than the market thinks.
Ethanol stocks fell 23.4 mil barrels, below expectations and inline with a year ago. Implied gasoline usage last week rose 1% to 9.045 tbd, and was up 2% YoY. Mark Soderberg with ADM wrote , the old adage, “big crops keep getting bigger” seems to have broken down over the years. Recent history shows that when the USDA raises yields in Aug., final US yields are often below what was projected in August. That’s exactly what has happened the last 5 times yields were raised in Aug. and 11 of 17 times since 1990. Export Sales are expected to range from 20-50 Mil Bu.
Read Full Story »»»
DiscoverGold
Agriculture Master Report
By: Bill Moore | August 15, 2024
SEPT CORN

Despite a record yield estimate of 183.1 (177.0 – 2023), Sept Corn displayed positive mkt action after the August USDA Report issued Monday at 11am! The reason is that the acreage was reduced by 700,000 acres – bringing total 2024 acreage nearly 4MA under 2023! So the total crop came in at 15,147 BB – roughly the same as July & 200 million bushel under 2023! As well, 23-24 & 24-25 carryout came out under last month for both the US & Worldwide! With the recent drop in prices, US Corn is the cheapest anywhere & recent flash sales & Mon/Thur exports substantiate that! Finally, non-US production in the Black Sea & EU is below par! And farmer selling at these prices is nih! So not all DOOM & GLOOM! We feel 4-yr lows are enough!
SEPT BEANS

Unquestionably, the August WASDE Report was bearish – primarily due to the 1000 acreage increase– which at a record 53.2 BPA – translated to 4.583 BB crop! Also, both US & Global stocks increased over last month! However, the current $9.50 price discounts much of the report – and like corn, beans & bean oil are the cheapest in the world! Already this week, we’ve had 2 Flash Sales of beans! And China is rumored to be interested in much more! So, also much like corn, we think the current 4-year lows are probably cheap enough! In addition to improved export flow, the Macros are leaning positive as recent lower inflation #’s should enable the Fed to lower IR’s a few times before year end! And at the current depressed prices, farmers are sitting tight!
SEPT WHT

The Monday USDA Report came in a little friendly with total wht production & most US & Global carry-out #’s under July! However, the mkt this week has been disappointed in the large 3.8 mmt tender – only which a small portion has been satisfied! So, positive corn action & negative bean action has push & pulled wht prices in sideways action with little new fundamentals news available!
OCT HOGS

Oct Cat today were the beneficiary of still solid-demand from the grilling season, a macro boost from the DJI & lower slaughter from last week & last year! The DJI has been on a 1500 point rally off lower inflation #’s – which should allow the Fed to lower IR’s at least twice before year-end! A higher stock mkt implies better demand – and “a rising tide floats all boats”!
DEC HOGS

Dec Hogs have had technical issues – namely an open downside gap – left a week ago – which created downside pressure! As well, yesterdays action was very negative as the mkt took out a congestion area – plummeting to within $1.50 of the contract lows! But today the mkt key-reversed violently to the upside for a $2.50 gain – closing the gap in the process! Still solid pork demand thru Labor Day & a sharp rally in the DJI fueled the price surge!
Read Full Story »»»
DiscoverGold
Commodities Daily Market Movers (% Price Change)
By: Marty Armstrong | August 15, 2024
• Top Movers
Lean Hogs (CME) Futures 4.21 %
NY Natural Gas Futures 3.31 %
Coffee (NYCSCE) Futures 2.44 %
Orange Juice (NYCE) Futures 1.78 %
Canola Futures 1.71 %
• Bottom Movers
NSW Baseload Electricity Continuous 3.77 %
Platinum / Gold Ratio 2.63 %
AU - Queensland Base-Load Electricity Futures 2.31 %
Sugar World (CSCE) Futures 2.28 %
NYMEX RBOB Gasoline Futures 2.17 %
*Close from the last completed Daily
DiscoverGold
Grains Report: Wheat, Rice, Corn and Oats, Soybeans, Canola and Palm Oil
By: Jack Scoville | August 14, 2024
• WHEAT
General Comments: Wheat was lower yesterday, mostly on selling seen in sympathy with the extreme weakness in Soybeans but also due in part to the mixed data presented by USDA on Monday. US harvest progress and ideas of good crops went against reports of hot and dry weather in eastern Europe and Russia and too wet weather in France and Germany are still heard and the weather there affecting world production estimates. There were more reports of hot temperatures coming this week to Russian growing areas. It has also been very dry there. Eastern Europe is also hot and dry. Western Europe has seen too much rain.
Overnight News:
Chart Analysis: Trends in Chicago are mixed. Support is at 520, 514, and 508 September, with resistance at 557, 581, and 592 September. Trends in Kansas City are mixed. Support is at 540, 534, and 528 September, with resistance at 567, 579, and 590 September. Trends in Minneapolis are mixed. Support is at 579, 574, and 568 September, and resistance is at 600, 613, and 629 September.
• RICE
General Comments: Rice closed higher yesterday and recovered much of the losses on Monday but trends remain down in response to the release of the USDA reports on Monday morning. The US weather has been an issue much of the growing season with too much rain early in the year. Some areas are now too dry, especially in Texas, and Texas yields are down as a result as the harvest moves forward. However, planted area has increased from last year and so most are looking for a rebound in production this year. Supply tightness is expected to give way to increased production this year and greatly increased supplies this Fall.
Overnight News:
Chart Analysis: Trends are mixed to down with objectives of 1344 and 1207 September. Support is at 1449, 1431, and 1415 September and resistance is at 1509, 1516, and 1532 September
• CORN AND OATS
General Comments: Corn and Oats closed lower yesterday, with both crops showing very strong yield potential but Corn supported by USDA reducing harvested area and planted area and also increasing demand potential. The increased demand came from the fact that Corn prices are already the cheapest in the world.
A lot of the selling seen yesterday came in sympathy with Soybeans although there is talk of bigger yields coming in subsequent USDA reports due to current good weather. Current forecasts call for cooler and drier weather for the Midwest this week.
Overnight News:
Chart Analysis: Trends in Corn are down with no objectives. Support is at 373, 370, and 367 September, and resistance is at 390, 402, and 409 September. Trends in Oats are mixed. Support is at 316, 311, and 302 September, and resistance is at 336, 348, and 364 September
• SOYBEAN
General Comments: Soybeans and the products were lower again yesterday on follow through selling tied to bearish data that was released by USDA that showed increased yields and production and a sharp increase in ending stocks. Demand news was moderate for both Soybeans and Soybean Meal last week with big sales announced on the daily system. There was more beneficial precipitation in much of the Midwest over the last week. This week should be dry and temperatures should turn cooler amid dry weather this week. Some selling came from reduced demand ideas. Reports indicate that China remains an active buyer of Soybeans in Brazil. Domestic demand has been strong in the US but has suffered as crushers were crushing for oil.
Overnight News:
Chart Analysis: Trends in Soybeans are down with no objectives. Support is at 942, 928, and 914 September, and resistance is at 1007, 1018, and 1033 September. Trends in Soybean Meal are mixed to down with objectives of 311.00 and 293.00 September. Support is at 298.00, 295.00, and 292.00 September, and resistance is at 313.00, 316.00, and 323.00 September. Trends in Soybean Oil are mixed. Support is at 3970, 2910, and 3850 September, with resistance at 4130, 4190, and 4360 September.
• PALM OIL AND CANOLA
General Comments: Palm Oil was lower today on reports of weaker export demand. Reports indicate that production is rising as well. Export demand has been very strong in recent private reports but has been weaker in recent days. There is talk of increased supplies available to the market, and the trends are down on the daily charts. Canola was lower as oilseed supplies look to be ample in the coming year and as demand ideas are down. The weather has called for dry conditions in the Prairies, but growing conditions overall are good.
Overnight News:
Chart Analysis: Trends in Canola are down with no objectives. Support is at 560.00, 558.00, and 546.00 November, with resistance at 591.00, 607.00, and 617.00 November. Trends in Palm Oil are mixed. Support is at 3620, 3560, and 3500 October, with resistance at 3770, 3830, and 3880 October.
Midwest Weather Forecast Mostly dry. Temperatures should average near to below normal.
Read Full Story »»»
DiscoverGold
Softs Report: Cotton, OJ, Coffee, Sugar, Cocoa
By: Jack Scoville | August 14, 2024
• COTTON
General Comments: Cotton was lower in response to weakness in Chicago grains and oilseeds and also Crude Oil futures in New York. It looks like futures are cheap enough for now but speculators see no reason to buy except to cover short positions. The Delta should have the best looking crops right now, but crops in other areas are more suspect. Demand has been weaker so far this year but there are hopes for improved demand with the lower prices.
Overnight News:
Chart Trends: Trends in Cotton are mixed. Support is at 66.40, 65.20, and 64.60 December, with resistance of 70.80, 73.00 and 73.70 December.
• FCOJ
General Comments: FCOJ closed higher again yesterday on forecasts for more tropical activity in the near future in the Atlantic. Nothing appeared threatening in the forecasts for this week as the current tropical system should stay in the ocean. A very active year is forecast and there have been some reports of flooding in the state even with no huge storms. The market remains well supported in the longer term based on forecasts for tight supplies and very hot weather in Florida. The reduced production also appears to be at the expense of the greening disease. There are no weather concerns to speak of for Florida or for Brazil right now.
Overnight News:
Chart Trends: Trends in FCOJ are mixed. Support is at 415.00, 410.00, and 393.00 September, with resistance at 454.00, 467.00, and 471.00 September.
• COFFEE
General Comments: New York and London closed lower with offers from Vietnam still hard to find but offers from Brazil and Indonesia in the market. CECAFE in Brazil said that July exports were near 900,000 bags. Reports of better rains in Vietnam and Brazil recently were important but reports indicate that Brazil suffered some light frosts in southern areas away from Coffee regions. The weather forecasters now say that conditions are good in Vietnam, but damage was done to crops earlier in the growing season. There were also reports of poor Robusta yields in Brazil during the harvest due to small bean sizes. Arabica yields in Brazil and Colombia are reported to be less this year due to extreme weather in both countries.
Overnight News: The ICO daily average price is now 228.07 ct/lb.
Chart Trends: Trends in New York are mixed. Support is at 230.00, 228.00, and 225.00 September, and resistance is at 252.00, 255.00 and 261.00 September. Trends in London are mixed. Support is at 4320, 4190, and 4070 September, with resistance at 4630, 4680, and 4740 September.
• SUGAR
General Comments: New York and London closed a little higher yesterday in consolidation trading. India will not permit exports of Sugar and the news supported futures last week. Harvest progress in Brazil and improved growing conditions in India and Thailand are the important fundamentals and growing conditions are turning drier in Brazil. Indian and Thai monsoon rains have been very beneficial and mills are expecting strong crops of cane. They are pushing the governments to allow exports but so far the governments have not agreed. Production estimates were raised in the northern hemisphere. Harvest yields of Sugarcane in Brazil are improving. There are still ideas that the Brazil harvest can be strong for the next few weeks amid dry harvest weather. Harvest weather is called good in center-south Brazil. UNICA said that the center-south Brazil crush was 51.31 million tonsss, down 3.35% from last year.
Overnight News:
Chart Trends: Trends in New York are mixed. Support is at 1770, 1740, and 1710 October and resistance is at 1890, 1910, and 1950 October. Trends in London are mixed to down with no objectives. Support is at 504.00, 498.00, and 492.00 October, with resistance at 533.00, 538.00, and 544.00 October.
• COCOA
General Comments: New York and London closed higher as tight supply conditions and reports of dry and hot weather in Ghana, but as prospects for the next crops are called good in Ivory Coast. Production concerns in West Africa as well as demand from nontraditional sources along with traditional buyers keep supporting futures, but this support is running its course and the market is searching for a new bullish fundamental. Production in West Africa could be reduced this year due to the extreme weather which included Harmattan conditions. The availability of Cocoa from West Africa remains very restricted, but surplus production against demand is expected in the next crop year.
Overnight News:
Chart Trends: Trends in New York are mixed to up with no objectives. Support is at 8000, 7690, and 7340 September, with resistance at 9540, 9800, and 10310 September. Trends in London are mixed. Support is at 6290, 5880, and 5820 September, with resistance at 6880, 7080, and 7320 September.
Read Full Story »»»
DiscoverGold
Natural Gas Bearish Reversal Signals Pullback
By: Bruce Powers | August 13, 2024
• After triggering a bearish reversal, natural gas faces a pullback. Support at 2.09 and 2.025 levels will be critical for the next upward move.
Natural gas triggered a daily bearish reversal on Tuesday as it fell below Monday’s low of 2.155. A daily bearish shooting star candlestick pattern was generated on Monday. It points to a pullback that may be short lived. Today’s price range establishes a lower daily high and lower daily low for the first time since the rally began a week ago. Given that today’s price action is on track to complete a second shotting star candlestick, a pullback to test support before a continuation higher look very likely. Plus, natural gas is on track to close in the lower quarter of the day’s price range at the time of this writing.

Drop to 20-Day MA at 2.09 Next in Line
A decline below today’s low of 2.14 will trigger a bearish continuation of today’s pullback. The 20-Day MA at 2.09 looks to be the first area to watch for support. If it fails to hold, there is a price zone to watch from around 2.03 to 2.02, and it includes the 61.8% Fibonacci retracement at 2.025. One of the reasons that natural gas is anticipated to continue higher following a pullback is that it triggered a bullish weekly reversal signal last week on a rally above the three-week high at 2.15.
Weekly Reversal Just Getting Started
A reversal week completed last week, and the week ended strong, in the top quarter of the week’s trading range. Also, the week ended above 2.15 at 2.16. Moreover, Monday’s rally triggered a bullish continuation of the weekly chart. This was the first time in eight weeks that natural gas exceeded the high of a prior week. These signs of strength should lead to further upside.
Since the 20-Day MA was cleared last week with a rally above 2.10, natural gas is showing strength that may result in a continuation of the current advance up to the 50-Day MA, now at 2.42. Prior to that price level there is the 38.2% Fibonacci retracement at 2.37, while the 50% retracement is at 2.42.
Watching for Clues During Pullback
Characteristics of the current pullback should assist in determining short-term underlying strength in natural gas. A bullish reversal following a test of support at the 20-Day line would be a stronger sign than a drop to test support around the 61.8% Fibonacci level at 2.025, for example.
Read Full Story »»»
DiscoverGold
Even Neutral Data – Not Supportive Enough. The Corn & Ethanol Report
By: Daniel Flynn | August 13, 2024
We kickoff the day with NFIB Business Optimism Index at 5:00 A.M., PPI MoM & YoY, Core PPI MoM & YoY, and PPI Ex Food, Energy, and Trade MoM & YoY at 7:30 A.M., Redbook YoY at 7:55 A.M., Fed Bostic Speech at 12:15 P.M., and API Energy Stocks at 3:30 P.M.
Analysis of USDA’s August WASDE is bearish of corn and supportive of grain markets, which are expected to form lasting lows by the end of August. The soybean market must work to curtail 2025 US seedings – assuming normal South America weather between Nov and Feb. Available Midwest area does make it easier to keep US corn supply & demand balanced, but unlike soybeans the US corn market is well positioned to dominate feedgrain trade until newer South American crops are harvested next spring and summer. The long-awaited August crop report has come and gone. Ag Resources (ARC) expects more attention to be paid to firm and rising non-US-exporter corn fob premiums. Spot basis in Ukraine on Monday is quoted at $1.49/Bu over CBOT futures, vs. $.40 over in late June. Nearby Brazilian premiums are quoted at $1.00-$1.15 over, vs. $.75-$.85 over a year ago. US Gulf corn is cheap at just $.80=$.85 over. The lack of US corn production expansion – due to lost acreage – along with brightening export potential warrant end user coverage on breaks during the remainder of August.
Ag Resources (ARC Analysis of USDA’s August WASDE:
WASDE corn data largely matched expectations, but importantly a larger than expected yield does little to boost end stocks. US harvested corn area was trimmed 700,000 acres. New crop carrying stocks were lowered 10 Mil Bu. Total new crop consumption was raised 60 Mil Bu. 24/25 corn end stocks at 2,073 Mil Bu were down 24 Mil Bu from July. ARC maintains a national US corn yield of 180.5 BPA. Note the NASS’s August forecast is based heavily upon survey & satellite data and ARC views NASS’s forecast in MN., NE, and SD as a bit overstated. Additionally, changes from Aug-Sep lack a historical trend – in 55% of years yield lowered from Aug to Sep; in 45%of years yield is increased. ARC also reiterates US corn is the world’s cheapest feedgrain through Dec/Jan. Competition for large but finite US supplies implies Dec is undervalued below $4.00. A normal seasonal recovery places spot CBOT at $4.60-$4.85 in winter. The USDA’s Aug WASDE was void of new bearish input. Also, the world balance sheet also tightened slightly amid downgrades to old crop Argentine production and new crop production in Ukraine. USDA projects 24/25 world corn stocks at 310 MMT’s, vs. 312 in July and vs. 309 in crop year 2023/24.
It remains that the build in stocks globally and in exportable positions has been unremarkable in recent years. Unlike 2016-2019, the global corn market isn’t oversupplied and there’s a need for favorable weather & trend yields in South America in 2025. 2024/25 exporter stock/use was lowered fractionally. ARC projects 24/25 exporter corn stocks/use to be cut further amid additional production cuts to Ukrainian & Russian production. Note that 24/25 exporter stock /use of 9.3% assumes normal South American weather in winter and spring of 2025. Rallies are still selling opportunities as corn steals 25/26 acreage from soybeans above $4.50 rather easily. But risk leans to the upside into Dec/Jan, when more is known about La Nina’s evolution and its impact on weather in Argentina & Southern Brazil. Total US corn demand in 24/25 will exceed 15 Bil Bu. CBOT futures are lower on carry through selling from Monday’s bearish USDA soybean stocks estimate and record high yield US summer row crop potential. Soybean futures fell to a new 4-year low which pressured grains. Corn and soybean Crop Condition report came in unchanged from last week.
Read Full Story »»»
DiscoverGold
The Corn & Ethanol Report
By: Daniel Flynn | August 12, 2024
We kickoff the day with Consumer Inflation Expectations and Export Inspections at 10:00 A.M., 3-Month & 6-Month Bill Auction at 10:30 A.M., Crop Production, USDA Supply/Demand, and WASDE at 11:00 A.M., Monthly Budget Statement at 1:00 P.M., and Crop Progress at 3:00 P.M.
Manage funds on Tuesday were net short 42000, contracts of corn, soybean, and Chicago wheat combined. Fund’s short in corn was 242,000 contracts down 53,000 from the prior week and a bit smaller than expected. Fund’s short in Chicago wheat was 71,000 contracts down 7,000 from the prior week and right at expectations. Funds short in soybeans was 169,000 contracts, down 10,000 from the prior week. Ag Resources (ARC) estimates since Tuesday managed funds have added 25,000 contracts to their major ag short positions, with funds’ net short in soybeans projected just 6,000 shy of mid-July’s record. The structure of the market poses risk to any/all even modestly bullish shockV-bottom and tops are often formed in speculative positioning. USDA’s August WASDE is key. Expectations are for sizable US corn and soybean end stocks today.
CBOT Corn Ended Slightly Lower on MO/IL Precipitation Forecast; Ukrainian Fob market Rallies Again: Corn markets did little on the last full session before the release of USDA’s Aug WASDE. ARC maintains a longer-term demand driven recovery lies in the offing, but the starting points hinges upon NASS’s Aug corn yield and then PRO FARMER’S tour results. Acreage is important and assuming the loss of 1Mil Acres = which is routine from June to Final – even a 183-184 yield limits stocks building in 24/25 quarterly stocks will be large, but its difficult to be bearish corn below $4.00 Dec given the US’s position in the world market. Notice nearby Ukrainian fob offers exist a full $1.45 above CBOT futures. This is rare and underscores the lack of Black Sea corn. The upside is pegged at $4.40-$4.70, Dec prior to expiration, but crop size must be better known before a lasting recovery occurs. Argentina needs rain prior to early planting in mid-September. Today is a key data point.
On the Weather Front, Potential Tropical Cyclone Five: The disturbance is expected to become a tropical storm before or as it reaches the Leeward Islands, where Tropical Storm watches are in effect. Tropical storm conditions could begin on Tuesday for portions of the area. Heavy rainfall may result in locally considerable flash flooding and mudslides in areas of the Leeward Islands by later today into Wednesday, and over Puerto Rico late Tuesday into Thursday. A Tropical Storm watch has been issued for Puerto Rico and the nearby islands. Additional watches and warnings will likely be required for portions of the northeastern Caribbean later today. The cone is turning northward and back out in the Atlantic and Bermuda is right in the path that could gain hurricane strength and named Ernesto.
Nearby Forecast Wetter in MO/IL, Drier in KS; August to be the story of Haves & Have Nots: The EU and GFS models agree that welcome heavy rainfall lies ahead for NE, MO/IL and southern IN tomorrow into Friday while net drying persists in ND, Upper Great Lakes and Delta/Southeast. This pattern of scattered/regional rainfall is likely to persist into late month and ARC maintains that extended range details will be changeable as the tropics become more active. The next tropical storm/hurricane is forecast to move into the Atlantic Aug 16-17. NOAA’s 7-day precipitation outlook is a agreeable. Abnormally cool temps continue in all but the far Southern Plains into August 14th . Overnight lows will drop into the low 50’s across N Plains/Upper Midwest Sat & Sun mornings. A warmer temp pattern evolves thereafter. The coming rain in MO, IL/S IN brightens yield prospects there. Lingering dryness in KS and OH are partially offsetting. Midwest heat returns after August 16.
Read Full Story »»»
DiscoverGold
$Copper #Commodities - Looking for a turn from the Bull 'Wedge' Lwr-Band and Wkly 150/MA under the 62/Fib...
By: Sahara | August 12, 2024
• $COPPER #Commodities - Latest
Looking for a turn from the Bull 'Wedge' Lwr-Band and Wkly 150/MA under the 62/Fib...

Read Full Story »»»
DiscoverGold
Cocoa Posts 2nd Biggest Gain in 25 Years
By: Barchart | August 11, 2024
• Cocoa Posts 2nd Biggest Gain in 25 Years
Cocoa soared by more than 10% on Friday, the 2nd biggest gain in 25 years. They coming for our Chocolate again.

Read Full Story »»»
DiscoverGold
|
Followers
|
89
|
Posters
|
|
|
Posts (Today)
|
0
|
Posts (Total)
|
9094
|
|
Created
|
05/01/07
|
Type
|
Free
|
| Moderators DiscoverGold | |||
- The Commodity Bull is Running... Inflation is Running... Harder Living (i.e. FOOD, CLOTHING, SHELTER) is Dead Ahead... -
- Commodity Futures Trading -
http://finviz.com/futures_performance.ashx
All Commodity Futures Charts From Finbiz.com Available Below:
Daily
Weekly
Monthly
Quarterly
6 Months
12 Months
YTD
2 Years
5 Years
Max
Beneficial Educational Resources on Futures TradingThe futures market is volatile, and it cuts both ways. Leverage that makes it profitable can also ruin reckless, undisciplined traders overnight. Most brokers have paper trading available on their platforms, so those who are new to futures should take advantage and learn with these tools before going live with real money. Mitigate risk with stop loss orders at all times, and cut losses quickly instead of adding contracts and attempting to flip your way out of a losing position. Also, use mini instruments when available, with lower margin requirements, until you have sufficient capital to buy and sell more expensive contracts. Even though the potential is there, don't try to make too many profits at once. If things aren't going well, often times quitting for the day and collecting one's thoughts is the best decision. New opportunities come along daily. Markets are open nearly 24 hours, so set a schedule and stick to it. Avoid trading while tired or distracted, and please don't listen to the advice of others. Do research on fundamentals affecting markets as well as paying attention to TA. Watch key indices, and listen to accurate, real-time news during the session to stay aware of shifting trends. Trade smart, trade safely, and have fun.
Videos on Futureshttps://www.youtube.com/playlist?list=PL9A5C5A93D243CA44 Continuous Improvement in Progress |
Commodity Futures Trading
https://www.tdameritrade.com/investment-products/futures-trading.page
| Volume | |
| Day Range: | |
| Bid Price | |
| Ask Price | |
| Last Trade Time: |


