 News
News  Market Data
  Discover
Support: 888-992-3836
Copyright © 2023 InvestorsHub Inc.


Register for free to join our community of investors and share your ideas. You will also get access to streaming quotes, interactive charts, trades, portfolio, live options flow and more tools.
Hallo, Mr. Winkelman
Just writing to see if this thread it's still alive or not.
Best regards.
Pedro
For all of you that thought I had become sick or had died I like to let you know I am fine. . I have been busy with other work so that the attention to this Forum has suffered.
From now on I and again working on presenting relevant information on Vortex AIM, which is now in Version 1.31d available with updated features that make it operation easier.
It has e real-time price change indicator;
The ROTAC and ROTAI Yield are now on the Interface Screen instantly "switchable" so you can see how lathe the Real real yield is bases on the principle of the "Internal Rate of Return" using a time based yield formula in which all the "earnings" and expenses that are necessary for maintaining an investment are processed as the occur on the precise date:
For ROTAC Yield that includes the proper accounting for adding Capital to the Reserve or subtracting Capital from it. This includes dividend, interest gain and all costs as they apply;
For ROTAI Yield that includes the dynamic equity earnings and costs but not "dead" Capital additions as that capital is not invested in equity until shares are bought. So a dividend is an Equity Equity Gain but is added as Cash to the Reserve and in effect it is treated like sale of shares but the share number remains the same. So in essence essence one gets extra shares for free if the dividend is used to buy new shares which increase the Equity Value. In the Standard AIM operation such a dividend can also be treated as buying shares without any Reserve reduction.
For your information I have placed a Vortex AIM promotion article on Face Book:
https://www.facebook.com/conrad.winkelman.
The follow-up consideration:
How would Case 1 and Case 2 work out for VORTEX AIMing ?
http://investorshub.advfn.com/boards/read_msg.aspx?message_id=102450242
Considering that the Vortex Trading Functions are
Vortex Buy Advice = (PC-V)*/(1-Fb)
Vortex Sell Advice = (PC-V)*/(1-Fs)
you can see at a glance that the Vortex Method is a Ratio Trading System
and the Buying and the Selling have the general mathematical form of
Buying: . . . y=Ab*x
Selling:. . . y=As*x
Considering that for Case 1 the PC is being Updated by each Buy" and for Case 2 it is not, then you need to consider that in Vortex AIM the Ratio System retains the same Trading Ratio based on an equity price change, so that raising the PC to the new equity value V(new) after a trade, in Case 1, does not change the trading Rates, which are defined by the Constants Ab and As.
After each trade the PC(new)= V(new).
For this reason the accumulation of Step-wise Buys in Case 1 results in the same Total Buy Amount for a single large Buy in Case 2, as long as the price changes remain identical for both cases
For Vortex Case 1 and Case 2 of my Ocroft Method Options are Identical.
I have discussed an interesting AIM Alternative that was suggested by Ocroft here on the AIM User Forum:
I agree with Ocroft that on the average The Ocroft Method (TOM) will outperform the Standard AIM Method:
http://investorshub.advfn.com/boards/read_msg.aspx?message_id=102449505
Results for the second phase of the SPY Demo Portfolio between 03-01-2011 and 09005-2014:
I use only the End positions. The starting positions for this sensid phase are defined as the End Positions in the previous Post.
Second Period: 03-07-2012 to 09-05 2014
Yield Performance is calculated for the entire investment period of 41,5 months, For the several Optimization runs shorter periods were used.
Capital Investment total = $ 40000 [$ 20000 Capital was added~1 year ago]
Reserve Cash = $ 45873. . .partially received dividends are included in this(See Note 1).
Equity Value = $ 940. . . .Due to the rising Share Price triggering predominant Selling Trades
Share price = $ 187,96
Share price Gain from 127,05 ~3,5 years ago = 47,94 % over 3 years and ~5,5 months.
That is an Annual Share Price Gain of 13,9 % .. .Which is also ~ the Buy & Hold Gain
ROTAC Yield = 7,44 %
* Cash Fraction = 0,98
* Buy Threshold = 5%
* Sell Threshold = 10%
* Buy Aggression = 0,96
* Sell Aggression = 0,70
Due to the low volatility the optimizations drifted to larger aggressively but the low volatility also reduced the trading frequency. Still the Vortex ROTAC yield dropped behind the Buy & Hold Yield by ~6,5 % because of the trading costs. This is considerably worse than for the first 1,5 years...
Note 1
I must add to my embarrassment here that since 21 September 2012 I have neglected to add the Dividends. . . .A calculation shows that about $ 270 Dividend should be added to the value of the Reserve and the Total Value. The corrected Yield is then approximately 7,84 %. . .This is not significant, so the overall conclusion that the yield is still substantially less, and that the Buy & Hold Yield of almost 14 % stands as substantially higher.
ROTAI Yield at this End Point = 23,26 %
This is substantially higher than the ROTAI Yield of 14,01 in the first 1,5 year.
If the $ 270 Dividend would have been added then the ROTAI yield would have been ~ 23,26%(7,84/7/44) = 24, 5 % and THAT is substantially higher that the 14 % Annual Buy & Hold Gain.
I will retroactively add the missing Dividends in this Demo and report the effect om the End Yields per May 9th 2014.
The point of this optimizing is that using an Optimization Program VOP the yield in this case was greatly improved over the 41,5 month Investment Period, which is due to that fact that earlier I had estimated the Trading thresholds at 7% and then reduced them to 3 and 4 % which was actually too low. The VOP Program corrected that and I reset these threshgolds to 5% for buying and 10 % for selling.
Clearly it must be emphasized that this result of improvement from optimization can not be applied indiscriminately to other stocks that have behaved drastically different from SPY.
In this period the Price Chart shows a steadily increasing share price without great dips and without high peaks. For comparably gentle price behavior I would predict that Optimization such as I have practiced works fine!
A 25 % annual Yield for SPY over a period of 41,5 months, compared to 14 % Buy & Hold is quite a reasonable achievement.
The essential point in this SPY Demo is that for the ROTAI Case the Time Average Investment. . .The money actually at Risk. . . was calculated at only $ 5116 while the same for the ROTAC case the Time Average Capital was about $ 20750 for the same period.
Another point that was discovered is that I was selling SPY too fast as the price rose. I should have stopped the rapid sell off for the rising Trend Channel and lowered the Sell Aggression and increased the Buy Aggression, in order to retain the share quantity much higher than I did.
Here is the corrected text of the post I withdrew:
Among other things I have been attending to lately, I have been struggling to get Windows 7 functioning properly. . .No success yet. Some errors prevent me to download some drivers(scanning and sound and Printing) frown
Also O have an Error that causes the MS Back-up not to work frown. . .I have been ”suffering” this for 1,5 months now.
****************************
All the time I have continued running some 3 Demo's on the SP500 SPY, and on a set of Dutch Penny. . . a Calamity portfolio. . .just for Fun, since 03-01-2011 foe SPY to today, with VORTEX, trying to get an optimized strategy using our Optimization Program. . .(only Dutch language so far). People interested could buy a Copy of it for € 100 and experience the development as we go, getting free Updates.
SPY has not show a great deal of volatility and has been steadily rising in value these 3.5 years. . .resulting in the performance for which Buy & Hold Method would have been better, if I had used the simple ROI Yield Calculation. . .as some of you use: The ROI Method without considering a variable amount of Investment that over the years applies.
My approach was as follows, as of 03-01-2011 with $ 20000 Inlay:
Parameters are
* Cash Fraction = 0,72
* Buy Threshold = 7%
* Sell Threshold = 7%
* Buy Aggression = 0,8
* Sell Aggression = 0,6 . . .This means that I buy more aggressively than I sell, which drives the Portfolio towards Share Accumulation (Increasing Equity Value).
If I reverse the Aggression Factors then that drives the Portfolio towards Liquidation (This interesting if it is to generate cash income).
1) January 2011 I started with Parameters more or less as I had found best the previous periods with a volatile SPY. As the time goes on. . .during say 6 months or so I monitor the volatility and if it proves to be too low I lower the Buy-Sell Thresholds a bit and at 6 months or so I run an optimization with VOP. . .Vortex Optimization Program . . . on the last 6 months history and then I resets the Vortex parameters for optimized Yield %.
The Cash Fraction can then be rebalanced to suit, if judged necessary. I use my "fingerspietzinggeful" for that smile.
The Vortex Program also allows for adding Cash at any time and adjusts the total investment to an Period Average that as the Investment for the period. The Optimization Process uses a fixed CER that is started with for that Run.
2) After this a new Staring condition is defined for VOP. . . Essentially the Test Portfolio is Reset to a New Start Condition for the Next Optimization Run. The Vortex Portfolio itself runs from the Starting Date. Trading costs and Interest on Cash are accounted for in Vortex but also in the VOP. . . This prevents the yield to be suppressed by too frequent trading!
Starting Price = $ 127,05
3) Results after almost 1,5 year:
At the start volatility was much lower than expected and was adjusted somewhere during the period manually to
Buy = 3 %
Sell = 4%. . .Aggressions unchanged.
The subsequent VOP Runs showed it should have been around 5%. . .I had a snappy Trigger Finger J
Share Price = $ 137,4
Share Price Gain = 9,91% but for the ~1,5 year that is 6 annually.
Vortex ROTAC Yield = 6,68% Annually
This is based on Total Averaged Cash Inlay. . .which remains in this case at $ 20000, but If I had added $ 10000 at the 1-year point the capital base would be $ 30000 but for the yield calculation @ 61,5 year it would be [20000*1 + 10000*0,5]/1,5 = $25000/1,5 = $ 16667 for the 1,5-year average. In this case ANY cash injection is treated as an Cash Inlay and any withdrawal is treated as a Negative Inlay. I prefer this way as it models The real World Investment Environment.
Vortex ROTAI Yield = 14,01 % Annually
This is based on only The Money for which shares are bought and expenses required to maintain the investment. If shares are sold the investment base gets smaller. If cash is added or taken out NOTHING changes except the Yield on the Cash gets higher or lower.
The Cash in itself is NOT at RISK an is not treated as an investment for Equity. Obviously this method. . . .very similar to the ROCAR that some AIMers use but it is more realistic and is automatically calculated for the Portfolio.
Interesting to note that the trading cost in the first 1,5 years have NOT reduced the Buy & Hold Yield compared to the ROI Method but in spite of the trading costs the performance was 4% higher even with the low SPY volatility [In this example I had a constant € 20000 Cash Inlay]. Any AIM-trader would have had pay the same trading fees as the Vortex AIMer, so a regular AIMer might have had a higher yield for the same type of trading but the yield would have been overstated. Moreover, the high Vortex trading aggressions of 0,8 and 0,6 are considerably higher than for a standard Lichello AIM. It is therefore safe to state that a standard AIM for SPY between 03-01-2012 and 03-07-2012 would have had a much lower yield than the 6,68 % Annually that Vortex AIM scored. Does anyone that aimed SPY in that 1,5 year period still have any yield data thereof?
With the 14% ROTAI Yield that really shows that the Vortex AIM Method created an hypothetical Yield Improvement, due to intermediate trading on price changes. . .in spite of the trading costs incurred. . .by using this fundamental AIM Principal of
Buy Low Sell High
Again and again when prices fluctuate.
The end Position of the Spy Portfolio is at 03-07-2012 is:
Cash Reserve = $ 14093
Equity Value = $ 7941
Portfoli Value = $ 22034
Interest earned = $ 411
Trading cost = $ 120
Dividend paid = $ 227
[The dividend is, in this case, calculated in as Gain but it was not yet included here as intermediately added capital. . .Using the ROTAC method this could be treated as capital added. If you receive Cash dividend on your bank account it becomes a choice to add it to the Reserve if the Portfolio or not smile In this case it was added ro the Reserve but NOT treated as an extra Capital Injection but under the ROTAC Principle it could have been].
Of course, experienced AIMers know al these aspects already and accept the risk of Under-performance and AIM for the likely Gain of Over-performance, relative to the Buy & Hold Method.
I made a point of it here for Newcomers to AIMing that might find the Vortex Method an interesting alternative Automatic Investment Program that has an extensive Portfolio Administration Section, for managing their investment.
More results from between June 2012 to May 10, 2014, in the next posting.
Hi everyone, I am still alive!
Among Other things I have been struggling to get Windows 7 functioning properly. . .No success yet. Some errors prevent me to download some drivers(scanning and sound and Printing) 
Also O have an Error that causes the MS Back-up not to work . . .I have been ”suffering” this for 1,5 months now.
****************************
All the time I have continued running some 3 Demo's on the SP500 SPY, and on a set of Dutch Penny. . . a Calamity portfolio. . .just for Fun, since 03-01-2011 foe SPY to today, with VORTEX, trying to get an optimized strategy using our Optimization Program. . .(only Dutch language so far). People interested could buy a Copy of it for € 100 and experience the development as we go, getting free Updates.
SPY has not show a great deal of volatility and has been steadily rising in value these 3.5 years. . .resulting in the performance for which Buy & Hold Method would have been better, if I had used the simple ROI Yield Calculation. . .as some of you use: The ROI Method without considering a variable amount of Investment that over the years applies.
My approach was as follows, as of 03-01-2011 with $ 20000 Inlay:
Parameters are
* Cash Fraction = 0,72
* Buy Threshold = 7%
* Sell Threshold = 7%
* Buy Aggression = 0,8
* Sell Aggression = 0,6 . . .This means that I buy more aggressively than I sell, which drives the Portfolio towards Share Accumulation (Increasing Equity Value).
If I reverse the Aggression Factors then that drives the Portfolio towards Liquidation (This interesting if it is to generate cash income).
1) January 2011 I started with Parameters more or less as I had found best the previous periods with a volatile SPY. As the time goes on. . .during say 6 months or so I monitor the volatility and if it proves to be too low I lower the Buy-Sell Thresholds a bit and at 6 months or so I run an optimization with VOP. . .Vortex Optimization Program . . . on the last 6 months history and then I resets the Vortex parameters for optimized Yield %.
The Cash Fraction can then be rebalanced to suit, if judged necessary. I use my "fingerspietzing-geful" for that  .
.
The Vortex Program also allows for adding Cash at any time and adjusts the total investment to an Period Average that as the Investment for the period. The Optimization Process uses a fixed CER that is started with for that Run.
2) After this a new Staring condition is defined for VOP. . . Essentially the Test Portfolio is Reset to a New Start Condition for the Next Optimization Run. The Vortex Portfolio itself runs from the Starting Date. Trading costs and Interest on Cash are accounted for in Vortex but also in the VOP. . . This prevents the yield to be suppressed by too frequent trading!
Starting Price = $ 127,05
3) Results after 6 months:
At the start volatility was much lower than expected and was adjusted manually to
Buy = 3 %
Sell = 4%. . .Aggressions unchanged.
The subsequent VOP Run showed it should have bee around 5%. . .I had a snappy Trigger Finger J
Share Price = $ 137,4
Share Price Gain = 9,91% but for 1 year that is 18,02 %
ROTAC Yield = 6,68% Annually
This is based on Total Averaged Cash Inlay. . .which remains in this case at $ 20000, but If I had added $ 10000 at the 3-month point the capital base would be $ 30000 but for the yield calculation @ 6 month it would be [20000*3 + 10000*3]/6 = $90000/6 = $ 15000 for the 6-month average. In this case ANY cash injection is treated as an Cash Inlay and any withdrawal is treated as a Negative Inlay. I prefer this way as it models The real World Investment Environment.
ROTAI Yield = 14,01 % Annually
This is based on only The Money for which shares are bought and expenses required to maintain the investment. If shares are sold the investment base gets smaller. If cash is added or taken out NOTHING changes except the Yield on the Cash gets higher or lower.
The Cash in itself is NOT at RISK an is not treated as an investment for Equity. Obviously this method. . . .very similar to the ROCAR that some AIMers use but it is more realistic and is automatically calculated for the Portfolio.
Interesting to note that the trading cost in the first 6 months has reduced a Buy & Hold Yield by about 8 % compared to the ROI Method [In this example I had a constant € 20000 Cash Inlay]. Any AIM-trader would have had pay the same trading fees as the Vortex AIMer, so regular AIMer with the ROI @ say 12 % would overstate the ROI Yield which actually was about 10%.
With the 14% ROTAI Yield the really shows that the Vortex AIM Method created an actual Yield Improvement due to intermediate trading on price changes. . .in spite of the trading costs. . .by using
Buy Low Sell High
Frequently.
Of course, experienced AIMers know al this t and accept the risk of underperformance relative to the Buy & Hold Method.
I made a point of it here for Newcomers to AIMing that might find the Vortex Method an interesting alternative Automatic Investment Program that has an extensive Portfolio Administration Section for managing the investment.
More Results till 2014 in the next posting.
Hi everyone, I am still alive!
Among Other things I have been struggling to get Windows 7 functioning properly. . .No success yet. Some errors prevent me to download some drivers(scanning and sound and Printing)
Also O have an Error that causes the MS Back-up not to work . . .I have been ”suffering” this for 1,5 months now.
****************************
All the time I have continued running some 3 Demo's on the SP500 SPY, and on a set of Dutch Penny. . . a Calamity portfolio. . .just for Fun, since 03-01-2011 foe SPY to today, with VORTEX, trying to get an optimized strategy using our Optimization Program. . .(only Dutch language so far). People interested could buy a Copy of it for € 100 and experience the development as we go, getting free Updates.
SPY has not show a great deal of volatility and has been steadily rising in value these 3.5 years. . .resulting in the performance for which Buy & Hold Method would have been better, if I had used the simple ROI Yield Calculation. . .as some of you use: The ROI Method without considering a variable amount of Investment that over the years applies.
My approach was as follows, as of 03-01-2011 with $ 20000 Inlay:
Parameters are
* Cash Fraction = 0,72
* Buy Threshold = 7%
* Sell Threshold = 7%
* Buy Aggression = 0,8
* Sell Aggression = 0,6 . . .This means that I buy more aggressively than I sell, which drives the Portfolio towards Share Accumulation (Increasing Equity Value).
If I reverse the Aggression Factors then that drives the Portfolio towards Liquidation (This interesting if it is to generate cash income).
1) January 2011 I started with Parameters more or less as I had found best the previous periods with a volatile SPY. As the time goes on. . .during say 6 months or so I monitor the volatility and if it proves to be too low I lower the Buy-Sell Thresholds a bit and at 6 months or so I run an optimization with VOP. . .Vortex Optimization Program . . . on the last 6 months history and then I resets the Vortex parameters for optimized Yield %.
The Cash Fraction can then be rebalanced to suit, if judged necessary. I use my "fingerspietzing-geful" for that .
The Vortex Program also allows for adding Cash at any time and adjusts the total investment to an Period Average that as the Investment for the period. The Optimization Process uses a fixed CER that is started with for that Run.
2) After this a new Staring condition is defined for VOP. . . Essentially the Test Portfolio is Reset to a New Start Condition for the Next Optimization Run. The Vortex Portfolio itself runs from the Starting Date. Trading costs and Interest on Cash are accounted for in Vortex but also in the VOP. . . This prevents the yield to be suppressed by too frequent trading!
Starting Price = $ 127,05
3) Results after 6 months:
At the start volatility was much lower than expected and was adjusted manually to
Buy = 3 %
Sell = 4%. . .Aggressions unchanged.
The subsequent VOP Run showed it should have bee around 5%. . .I had a snappy Trigger Finger J
Share Price = $ 137,4
Share Price Gain = 9,91% but for 1 year that is 18,02 %
ROTAC Yield = 6,68% Annually
This is based on Total Averaged Cash Inlay. . .which remains in this case at $ 20000, but If I had added $ 10000 at the 3-month point the capital base would be $ 30000 but for the yield calculation @ 6 month it would be [20000*3 + 10000*3]/6 = $90000/6 = $ 15000 for the 6-month average. In this case ANY cash injection is treated as an Cash Inlay and any withdrawal is treated as a Negative Inlay. I prefer this way as it models The real World Investment Environment.
ROTAI Yield = 14,01 % Annually
This is based on only The Money for which shares are bought and expenses required to maintain the investment. If shares are sold the investment base gets smaller. If cash is added or taken out NOTHING changes except the Yield on the Cash gets higher or lower.
The Cash in itself is NOT at RISK an is not treated as an investment for Equity. Obviously this method. . . .very similar to the ROCAR that some AIMers use but it is more realistic and is automatically calculated for the Portfolio.
Interesting to note that the trading cost in the first 6 months has reduced a Buy & Hold Yield by about 8 % compared to the ROI Method [In this example I had a constant € 20000 Cash Inlay]. Any AIM-trader would have had pay the same trading fees as the Vortex AIMer, so regular AIMer with the ROI @ say 12 % would overstate the ROI Yield which actually was about 10%.
With the 14% ROTAI Yield the really shows that the Vortex AIM Method created an actual Yield Improvement due to intermediate trading on price changes. . .in spite of the trading costs. . .by using
Buy Low Sell High
Frequently.
Of course, experienced AIMers know al this t and accept the risk of underperformance relative to the Buy & Hold Method.
I made a point of it here for Newcomers to AIMing that might find the Vortex Method an interesting alternative Automatic Investment Program that has an extensive Portfolio Administration Section for managing the investment.
More Results till 2014 in the next posting.
>>>>This is why it is sometimes a good method to have Average Settings and leave things alone generally<<<
That is certainly my viewpoint. When the market has its next drop I don't want to be using AIM Hi and be holding only 20% cash.
I would rather be 50% cash now and 80% cash just before the next drop.
Toofuzzy
I agree Toof. . .
There are various conflicting ideas. . .I think all of them have been discussed at one time or more times on the Forums here.
This is why it is sometimes a good method to have Average Settings and leave things alone generally, and for others that have a good grip on something special they want to use to set the parameters that is specifically good for THAT and then keep a sharp eye on the prices or trends and re-adjust as required.
Hi Conrad
>>>>Clearly, delaying delaying the Buys using a MACRO Filter is not a form of Cash Burn Rate Reduction but rather it serves to invest the available cash more efficiently at a lower price. <<<<
It also allows you to sell at higher prices.
The advantages are well known but the disadvantages are that if the Trading Range is not very wide a lot of volatility capture could be missed if the Buy and Sell Limits with the MACRO filter are far apart.
I imagine this is true also and why I have not done it.
I have thought of using a 13 day and 30 MA crossover. With something like 50 and 200 day the price has to move too much against you before you trade. So you give up a lot whether buying or selling.
Toofuzzy
Hi Clive & Toofuzzy,
Interesting discussion on Not Buying when AIM indicates a Buy and there is still cash "on board".
For the Vortex AIM program this simply has to be an "external" decision of the Investor by way Market Indicators, like Moving Average Crossovers. . . like the MACRO Don Carson use to use some years ago. Such extra Management tools are not part of the Vortex Program. Do you know of anyone that includes such automatic Buy Delays in their AIM program itself? I would think it is not something that is required for AIMers. I would rather advise that the Investor himself decides not to execute such particular Buy Advices. That way he remains in conscious control of What he is doing and Why.
Clearly, delaying delaying the Buys using a MACRO Filter is not a form of Cash Burn Rate Reduction but rather it serves to invest the available cash more efficiently at a lower price. The advantages are well known but the disadvantages are that if the Trading Range is not very wide a lot of volatility capture could be missed if the Buy and Sell Limits with the MACRO filter are far apart. This can happen when these limits are set close to the Trading Range Limits. In using the Trading Limits the extra work to be done it to find out the optimum Trading Limit Settings may be beyond mist AIMers. I think this is where the Vortex Optimiser could be used, but then we would have to program these limits into the Algorithm as well which we have not done as yet. . .
Is there some other way to find the optimum Trading Limits for not executing buys and sells?
In regards to running out of money with Vortex AIM it automatically refuses to execute any Buy when the Reserve is too low. In the Excel version one can set the Buy Reduction Factor at any value to Reduce the Cash Burn Factor as the Cash starts to get low. For example if a Buy exceed the value of the Reserve then one can still execute the Buy with say 60% of the Reserve (Buy Factor = 0,6) or use any other fraction. This Buy Reduction Factor is build in as a variable parameter but is not available in the Windows Version. In the windows version this problem is solved by adding a small amount of money to the reserve but then Vortex gives the full Buy as an Advice but then the AIMer can simply execute a 60^% Buy himself! This way he has perfect control of the Cash Burn Rate.
Hi Toofuzzy
Am I Aiming the TLT or the gold? Am I using the gold as CASH?
Hi Clive
>>>>So even though AIM HI was out of cash for some periods when AIM was indicating to buy more shares, the overall outcome was still reasonable. <<<<
Yeah I have run out of cash with regular AIM and found it to be self - correcting. If you don't get a buy the next sale is delayed, the security needs to go higher, and you get a better price.
Of course you may miss a few round trips than way.
Toofuzzy
Hi Clive
>>>
Even if you hold just one AIM buy trade amount of TLT (and gold), then whenever AIM does indicate a buy trade you might find for whatever reason the share price is down the value of TLT (or gold) may have risen and be a more appropriate choice of 'cash' to deploy into more shares.
If for instance cash deposits had risen 4%, but TLT had risen 10% then that 'cash' buys the additional stock at a relatively cheaper price. <<<<<
You totally lost me.
Am I Aiming the TLT or the gold? Am I using the gold as CASH?
If TLT is up 10% how am I buying it at a relatively cheaper price?
Don't even TRY to answer my question. It will just confuse me more.
You need to start the example over.
Toofuzzy
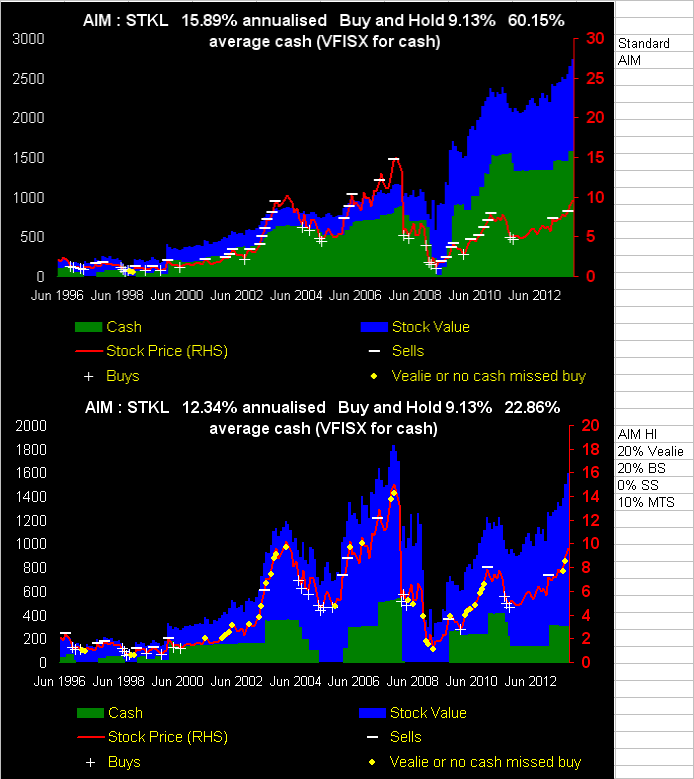
With AIM Hi AIMing STKL my guess is that you would have run out of cash to buy more stock with
Hi Toofuzzy
TLT is a 20 + year US Treasury Exchange Traded Fund
It tends to have spikes in value at times like 2003 and 2009 when stocks are going down.
I would not own it now as I expect it to drop 40% in value at some point when interest rates peak.
Hi Clive
With AIM Hi AIMing STKL my guess is that you would have run out of cash to buy more stock with unless you started when STKL was at a bottom .
Toofuzzy
Hi Toofuzzy
Regarding not buying more if something goes down a lot. I have done very well with STKL as it went from 6 to 15, back to 5 and is now just under 10
TLT is a 20 + year US Treasury Exchange Traded Fund
It tends to have spikes in value at times like 2003 and 2009 when stocks are going down.
I would not own it now as I expect it to drop 40% in value at some point when interest rates peak.
In the mean time I am not starting any new AIM accounts and am trying to increase my cash.
Toofuzzy
Hi Toofuzzy,
<In 2003 and 2009 my account was cut in half even though I was diversified>
What a Bummer! This can indeed go wrong for the best ones!. . .Crashes are by nature unmanagealble. We see that during earth quakes and tsunamies. . . people expect te be helped but many fall between wall and ship and suffer.
In that sense a Crash of market prices of a stock going to zero is different than simply experiencing a Dip. I am very conservative with my own money now. . I can not affort to losse big amounts so I simply Play with small amounts now and then. . . small enough that I can affort to loose it.
For example I Aimed Antonov Transmissions. . . A Penny Stock and it recently was taken off the exchange. . .the value stood as € 130 (sic) . . The stock will remain hanging around and it might betaken back or it might vanish. . . Generally with my Vortex Investing in the past I did quite well. The thing that killed me fianacially was thrusting "friend". . In the end I was chaeate out of % 50000. .you mat have read my story on that. . I am reluctant to trust people again.
On the Penny Stocks I am AIMing a Demo Port Folio with 8 stocks left in it on the Dutch Local Exchabes. . .Antonov was in it but I have removed it from the Portfolio. Each stocj is AIMed seprately but they are lumped in "Mutual Fund" portfolio. The Aiming is done more or less as I would normally do except that I use the Turbo Method. . .put in extra cash when it is needed. Of course I know this is not typicalfor most AImers but I do it to score a point on a Mutial Fund Portfolio about which I know nothing about the details of the stocks other than that they are penny Stocks and can go Bust, like Antonov did.
The "Fund" has been running since Feb-16-2012 till now. I strated with Antonov and added 8 stocks over a short time and recently removes Antonov The Dmo Antonov was much bigger that the Real one I had The paremeters have been mostly constant at the firts choices:
Fund Yield ROTAC (bases on time average capital inlay)= 314 % yr.
Fund Yield ROTAI (base on time averaged equity Buys)= **** % Off the Chart . Perhaps I can find the % in the Fund Report:
From extracted data in the Reportthe ROTAI = 1373,15 % yr for the 20 month period.
Three Stocks have negative yiels of - 0,07/-14,4/-22,7 % Thr est hight positive Yields the rest 30,6/78,5/****/**** %. There were not enough digits allocated for these **** percentages.
Trading cost = € 7875
Interest earned = € 32406
Of course this is not realistic. . I use it as a tool to get a feel of the mechanisms but it shows also what we know generally already. . .a Mutual Fund with a wide base will not likely disappear. . unless you let a guy like Bernie Madoff run the show .
Anyhow: What is TLT ?
It is clear, you have had enough exprience to form a valid opinion on the ups and downd on AIM Investing, so have I. I have lost very few accounts and have spend enough time looking at the traps that there are but also at the methods that give good results. . it takes time to do what I do, and I am fundamentally a more agressive investor as you appear to be. . when I have money to play with that is.
The most important thing is Risk Avoidance and that does not mean avoiding high Yield Stocks. . .it means understanding the dangers and to avoid them.
Thanks for the feed back.
In 2003 and 2009 my account was cut in half even though I was diversified. I thought CASH was enough of a diversifier. I now know better and will eventually add TLT as an AIMed account when interest rates invert.
I am also moving away from individual stocks, or at least that is my intention as funds can not go to zero and so I feel more confident in buying as they go down.
A few individual stocks I have owned have gone bankrupt (Meditrust, American Home Mortgage ) and Double Hull Tankers, Fuel Teck, Sunpower, Chiqita are deep divers for me.
Regarding not buying more if something goes down a lot. I have done very well with STKL as it went from 6 to 15, back to 5 and is now just under 10. Also have done well with SCCO and WRI
Toofuzzy
Toofuzzy,
You have made a claim as a generality without supporting the this is generally happening!
<If you have a security that stays relatively flat or just on a mild projectory and optimize for that, if the security then crashes, you have not allowed for enough cash>
When people are investing. . . with or without AIMing. . . equities do not generally "Crash" routinely. . .It is just the other way around. . .equity crashes are rare. No matter what you do when an equity crashes suddenly and deeply then there is something wrong and in most case the best thing is to Bail Out.
The case in which an equity is FLAT you better not invest in it at all. Let talk reality for AIMing
1 The equity must be volatile
2 The equity must be relatively safe so the likelihood for a crash is very low.
Lets take the perfect example for an AIM Equity such as a Saw Tooth or Sine Wave profile:
3 Such an theoretical equity optimises identically irregardless you start at the top or at the bottom. The optimised point are obvious at the top and the bottom of the Trading Range:
a. At the bottom 100% Equity
b. At the top 100% Reserve
You do not even need any optimisation. .it is a trivial case.
If the stock crashes at the top. . . @ 100 In the Money. . .to a point deeply below the bottom only a fool would invest any further and will wait what happens. If he stock drops to the normal bottom of the Trading Range there is generally no reason to assume it will crash so you go in 100% In the Equity. . .so far so good. . .that is what you want.
Should at that point the equity drop a little lower then there is no panic. .usually it will rebound. . .If you have chosen am equity that is regarded SAFE by any standard then you wait for the rebound OR better yet, buy extra equity from other resources that you have. . .Only a fool will put ALL his savings in an investment unless he had magical power to see that he will not lose it. . .people with magical power would be fools anyway if they us a system like AIM . . .Buying extra equity when the Reserve stand at 0 is an excellent investment method. With Vortex I call it Vortex TurboVest!
Anyway if an equity crashes deeply then something is very wrong and one should bail out. I there is only a drop beyond the normal bottom then waiting is advised. . A rebound usually occurs
There is nothing to worry about. If the stock has crashed and remains a penny stock or becomes worthless de money is lost anyway. The case you refer to would be a rarity and is therefore not relevant.
It is better, in such a case to run 10 years with an Optimised AIM than to play safe and use non-performing parameters. If one is scared for a 1 in a hundred cases that an Equity does not recover from a DEEP DIP then he should his money in a bank account and do gardening all day long.
In case a real stock does not at all follow the price behaviour that was used for the optimisation then the parameters should be changes anyway in a manner that is best for the occasion.
This type of AIM investing requires spending time on it .
The type of AIMing you advocate . . .with all sorts of conservative settings and looking at the market one per month. . . is fine too, for people that have no time to spend on their AIMing not to studying how to get an optimised yield.
Playing 100% Safe is a legitimate Life Style. . I am not arguing against that. . .It is a choice. . I grant you that.
Using one’s skill to Play the Stock Market with an optimised AIM, and to endeavour to maximize investment yield that way, is another choice
Retirement AIM:
In regards to AIMing specifically for Retirement purpose I have explained that in my book The Vortex Method and on this Forum as well. I call that application Vortex RAIM.
A Refresher on it is found on the AIM Users Forum:
http://investorshub.advfn.com/boards/read_msg.aspx?message_id=91934703.
>>>>>1 Start with optimization using historical data;
2 Run the real AIM with approximately the optimized data but temper the aggression factors of Vortex somewhat;
3 Run the AIM for say 6 months or so to see how the trend develops, if the Price behavior is drastically different then the optimized parameters will not be effective;
4 Redo the optimization after removing a 6 months data at the back-end of the old Data-Set and optimise to the current date. This would reset the Parameters with historical data shifted to the latest date. . .Then wait 6 month again and if required repeat the optimization.
In case the stock behavior remains “on “ target” then the result will be close to the optimum. . . if not then you keep re-optimizing. <<<<
The issue still remains:
If you have a security that stays relatively flat or just on a mild projectory and optimize for that, if the security then crashes, you have not allowed for enough cash. Even if you alter your parameters, it might be too late. If you then optimize for a security that is very volatile and the volatility decreases, yiu might be holding too much cash or did something to spread the trades out more than they need to be.
Personally I will always think of changing the parameters at the wrong time so I just leave them alone.
Toofuzzy
Hi Too Fuzzy,
You are addressing a well known issue that has been discussed in general many times. Your argument is quite valid but it does not fully apply to my post you are reacting to.
First let me state that the term "Back Testing" appears to be used in two different ways on the AIM Forum and no doubt I have not always been consistent as I used it too in a way it is probably not meant.
In various posts Back Testing with AIM appears simply to be Running of a set of historical stock prices with a standard parameter set and perhaps a run with another favourite parameter set suggested by others as being good too, and to compare the results with the Buy & Hold Results or to compare the AIM results with the results of another type of programme. . .This was, I believe the type of Back testing that was discussed lately by Ganaraska.
I have exclusively directed my self to the Optimisation of a historical Dataset and to use that Dataset for an actual Investment run. It is clear to all that have participated ion these discussions that these optimised parameters would only be useful if the future data was approximately repetition of the historical Dataset. I have had many discussion with Mark Hing of A.I. on the issue. There is no disagreement on the weak part of Optimisation. Mark and I discussed a method that was potentially useful:
1 Start with optimisation using historical data;
2 Run the real AIM with approximately the optimised data but temper the aggression factors of Vortex somewhat;
3 Run the AIM for say 6 months or so to see how the trend develops, if the Price behaviour is drastically different then the optimised parameters will not be effective;
4 Redo the optimisation after removing a 6 months data at the back-end of the old DataSet and optimise to the current date. This would reset the Parameters with historical data shifted to the latest date. . .Then wait 6 month again and if required repeat the optimisation.
In case the stock behaviour remains “on “ target” then the result will be close to the optimum. . . if not then you keep re-optimising.
In SPY1, using Windows Vortex AIM I had already started on 03-01-2011 using parameters from some manual optimisation of the Historical Dataset Long before that and I AIMed SPY1 for about 8 @ 9 months without changing any parameters. In the mean time we had started developed our Optimisation Program and started trials some times in 2012. Up In 2011 I still used the manual Optimisation method with the Vortex Excel Spread sheet and on that basis I modified the parameters based on a re-optimisation. All the Demo investment were made in Vortex Windows with parameter optimisation done with historical data in Excel. This was exactly the method developed by me in discussion with Mark Hing advice on the generalities that he had already developed himself for AI.
At the end of 2102 and for 2013 I repeated the optimisations about two times but these times with rather short historical periods. This is so because in Vortex I only had downloaded Spy prices since May 2011 and our Optimisation Program can only take prices out of the Vortex Windows Data Bank. So for the Spy1 Run the result are based on optimisations using historical data and the decision that a new optimisation was needed was an Overlay Management Decision. . this is something any Investment manger must do.
IN [b[SPY2 and SPY3 I used a different approach and altered the parameters 2 times. . .beyond what was indicated by the Optimisation Program ( Manager Interference) after the start-up, giving 3 parameter sets for a ~ 2,7 year Run.
This provides some extra information in regards to what I am doing. Most of the content was directed to present our Optimisation program and that I had started using it and that if anyone would be interested they could acquire a copy when they are using Vortex. It is of course clear that the short period I used for the Machine Optimisations that my numerical results may not be demonstrably indicative of a very high yield.
The Vortex SPY ROTAC Yields since January 2011 to now, that lie in the range of 10 to 12 % annually, may well be very similar to the results people on the AIM USER Forum have been getting. It is interesting to know what other AIM Investors have scored with their aim for the same period.
I can understand how backtesting can give you an education as to how AIMing works and what you might expect, but if you actually use any specific results, aren't you just data mining, as future results are not necessarily correlated to past results.
Look at C prior to 2009 vs after.
Toofuzzy
Hi Vortex AIM users and Forum Readers:
We have developed a Vortex AIM Parameter Optimisation program called Vortex Back Test . . .VBT . . . to be coupled onto the Vortex AIM Windows program (Vortex). This is the way it works:
1 Select an Equity: The Data Base of Vortex is used for loading up the stock prices into VBT. These prices were previously downloaded from Yahoo by the Vortex Investor. . .his choice. These stock prices are not necessarily all used in Vortex but are there to be used as the investor sees fit;
2 The investor opens the VBT Module and selects an Equity;
3 The Period for the Test Rub is selected,
4 The parameters for the Test Run are entered:
*Number of Shares
*Percentage Reserve
* Trading Cost: Fixed Min. + Percentage IF Min. Amount is exceeded;
5 Holding Zones %
* Buy: Start Value/Step size/Stop Value
* Sell: Start Value/Step size/Stop Value
6 Aggression Factor Fractions
* Buy: Start Value/Step size/Stop Value
* Sell: Start Value/Step size/Stop Value
Additionally various buttons are presented for:
* Run Results. . .It present the % ROTAC Yield for each Data Set in Chart form as well as in a List Form
* Sow File. . .Equity Details
* Make Test File. . .Make your own Test Data
* Example Test File. . .Here you can choose a number of standard equity rice profiles for a chosen period, such as: Sine Wave, Block Wave, Saw Tooth Wave and Random Prices.
The Back Test program optimises the 4 Parameter settings based on Yield Maximization.
**************************************************************************
At the moment I am Running 3 SPY Demo Portfolios using generally the optimised parameters as given by this program. In some cases intermediate Optimisation Runs are done for shorted periods in the Past and the parameters adjusted. The idea here is that is a trend deviates from the previously optimised Price History then a new optimisation of more recent price developments is required.
SPY1 is a long term Demo starting at 03-01-2011 till to date. There are 94 Datasets. Latest transaction on August 5
Equity + cash to start = 20000
Equity = 5600
Interest on Reserve = 2% Compounded at each Trade
Reserve = 14389,05. . . .Trading cost of 10,95 already deducted.
Shares N= 44,08. . .N could simply be truncated for integer ..values but are not in this run.
Buy Holding Zone = 7,5 %
Sell Holding Zone = 19 % till August 2012
***************************************
Buy Holding Zone = 7,0 %
Sell Holding Zone = 7,0 % till September 15-2012
**************************************
Buy Holding Zone = 5,5 %
Sell Holding Zone = 10 % till current date
Percentage Interest on Reserve =
Remark:
The changes in Holding Zone settings were based on the development at the time. I have not recorded the specific reasons for these changes but normally when I see some reason for a change I do change some settings. The Chart indicates a reduction in Volatility that would indicate lowering the Hold Zones.
The Aggression Factors remained as originally set.
Buy Aggression = 0,8
Sell Aggression = 0,6. . .the Aggression factors turned out to be rather high automatically as the stock volatility was rather low these + 2,5 years.
Results per 06-09-2013. . .No extra Capital was added but Costs and Dividends are recorded as time variable -/+ Cash additions.
ROTAC Profit & Yield = 6036,85 & 11,88% Annualised
ROTAI Profit & Yield = 5362,65 & 26.41 % Annualised
Trading Cost = 137
Dividend = 43 <------Forgotten to add most dividend Payments
Interest Earned = 630
______________________________________________________________
SPY2 is almost identical but has only 91 DatSets. On 01-06 2012 the Sell Aggression was increased form 0,6 to 0,85(very high selling aggression)as an experiment.
Interest on Reserve = 2 % but is Compounded at each Trading Point
ROTAC Profit & Yield = 5568,77 & 10,91 % Annualised
ROTAI profit & Yield = 4944,50 & 21,48 % Annualised
Trading Cost = 278
Dividend = 44 <-----Most dividend payment are Forgotten here
Interest Earned = 580
Clearly the increase in the Sell Aggression has minimally reduced the ROTAC Yield but more significantly reduced to the ROTAI Yield. Considering the rising trend that developed after June 2012 this result is logical. . .With a rising trend the Sell Aggression should be lowered so that the benefit of the rising price can be captured. . .as is the case for SPY1.
From the Price Chart it is shown that in June 2012 the price was in a dropping trend. . .the increased Sell Aggression was a logical Bet. . .. . .not from an AIM methodology consideration but from Trend Betting consideration. From the Price Chart it is clear that just beyond that point in June 2012 the prices started rising again and I should have lowered the Sell Aggression again . . .but I did not to see the effect of it.
____________________________________________________________
SPY 3 Is a run for the same period with more intuitive intermittent changes in Hold Zones, Aggression Factors and extra cash Addition.
The Run has 80 Datasets. Hold Zones varied frequently based on interpretations of perceived volatility. . which was rather low and generally fluctuated between 7 and 1 & but on the average around 3 or 4 %.
Aggression Factors Buy/Sell started at 0,8/0,6 and were gradually increased from Dec 2012 to currently 0,96/o,93
In July 2013 an extra 20000 was added to the Reserve due to Reserve depletion from the more aggressive trading.
The number off Trades was obviously higher due to the relatively low Holding Zones.
Interest on Reserve = 2%/yr is compounded at yacht Trade Point.
ROTAC Profit & Yield = 5713,14 & 10,33 %
ROTAI Profit & Yield = 4660,67 & 27,31 %
Trading Cost = 278
Dividend = 260
Interest Earned = 793
The ROTAC Yield has suffered a bit due to more frequent trading but the ROTAI Yield has benefited from the higher Trade aggressions and the more frequent Trading.
The Vortex Program provides to important Reports:
1 Portfolio Revue. This contains all relevant Financial and Trading Result Details that are necessary For Income Tax Reporting;
2 Activity Report. This shows all the individual Trades, Cash Mutations and Costs
Hi 1step, I know what you are saying is very very true!
A number of years ago I participated in a Investment System Exhibition and after that there was a definite uplift in the interest and extra sales for a while but after that interest faded again.
At this point in time I have been working on this off and on for 20 years on this specific Microsoft-based program, and countless hour of development work and debugging work we have put into it.
The underlying truth is that even though I have been worked on AIMing for more that 30 years since 1981 it has never left the Hobby Stage next to my other work. In order to gear up to get VORTEX to the level of a serious commercial product I would have to start competing with the commercial activities like that of Mark Hing with his AI, and others like him, and mount a similar marketing campaign. . .That seems to me like something similar to climbing to the top of Mount Everest. . .It is much easier and efficient to look at a documentary of others that got the top of that mountain.
I can not seriously compete on the level that is required for capturing a share of a market that Mark Hing is operating in. The type of marketing that is required to capture a part of the American market (for any product) seems to be a bit "dishonest" . . "Selling The Sizzle" instead of selling the steak". . .Every time I get confronted with American Marketing examples I find them almost "offensive" in regards to the fact that the Sizzle is being marketed and the quality and features of the "Steak" are not mentioned.
I have once discussed marketing techniques(generally) in relation to book-writing techniques and someone that knew how to separate the chaff from the grain told me this:
"The popularity of a book is inversely proportional to the number of formulas that are present therein. When people peruse a book and they see a lot of equations and charts they put it back very quickly and look for one that has only text and photographs in it".
Of course, if one is marketing via Internet the title of a book or the name of the product needs to catch the imagination of the readers. . in that sense the name Vortex Method appears to be meaningless to almost anyone. . .I would have to think of another name. . I hate to do that!
When I write something about a technique I need to enter the essentials of it in my promotion and that becomes a “book” with Formulas and Charts. Evidently that does little for marketing the product. . .people want to hear that they will get rich over night while they are sleeping. This would be a distorttion of the truth. Vortex Aiming is a lot of work that sleeping.
Honestly, I have no more steam on the kettle to start such a commercial campaign and to spend another 5 years on it to break into a markets that appears to be limited anyway. Somehow I feel: “I have tried it long enough”.
Would you like to buy the Vortex Program for a pittance and do the marketing for yourself?
I tried to sell it before and got no bites. For people that like AIMing it appears that they like to tinker just like I do and they rather develop their own “AIM Derivatives” than buy a program developed by others.
That is not a problem. . .
I am like that too
Hi Conrad
In marketing , everything is exsposure and catching your imagination. e.g. lichello's title of his book. With due respect few know anything about aim. Especially with Lichellos book not being published anymore.
You need to translate your book into English which has a larger speaker base. You can condense it,
Make sure it is readable and include your sample trial software program with it. Try different titles till you have a winner.
See what happened when Praveen changed his title it moved to a number one position. I think you have a worthy program.
praveen also kept it very simple in presentation. Though it was a well thought out plan.
You have a very analytical mind that is very sharp and a lot of readers aren't at your level.
I hope you didnt't give up.
1step
Being Back is relative.
There appears to be very few people showing interest in Vortex Aiming so I check the site less frequently.
It is mostly my own doing. . .I am not realy marketing the program in an agressive manner and this causes the interest in it to wane.
Anybody that is interested in taking over the program is welcome to do so!
I am runnung out of steam
Regards.
Was wondering what happened. Glad to see you are back.
Ray
I have been "off-line" here for a while.
Just want to let all of you know "I am Back".
Interesting new Development!
For he Vortex AIM Program(Vortex)a Back Testing & Optimization Subroutine has been developed. Currently Version 1.00 already works!
Its features are
1 Historical stock prices for any Equity are taken out of the stock prices already downloaded into the Vortex Data Bank;
2 The date-range for the Back Test and Optimization can be selected;
3 The Parameters of Vortex can be entered from a minimum to a maximum value in an Entry Matrix;
4 The simulation starts with a number of shares and automatically all the parameter values are used with a given step-size to calculate the Fund Yield Percentage for the Test Period. For simple back testing only single parameter-values that are considered important are entered. For an optimization you enter a range of parameter-values;
5 The Parameter Set for the Absolute Maximum Point(AMP) is given in an Output Matrix ;
6 The AMP Result may not be a practical operating point: It could be valid only for a very narrow range of share prices, or even only for a single price that may never return. If this is the case you can search in the numerical Output List for any Local Maximum Point(LMP). Often you will find that a local maximum will be valid for a wide range of prices so that the Maximum Yield occurs over a broad Parameter Set Range for your Investment. Such a Parameter Set gives a better operating point. The future price behavior around a broad historical optimum price range for any fund is more likely to repeat itself than for a very narrow AMP. . .such an AMP price range seldom (or never) repeats itself.
The current Subroutine does not cover all the Parameters in Vortex at this time. In the future it might use all of the following parameters:
- Initial Investment and Total Capital allocated
- Buy & Sell Hold Zones
- Buy & Sell Aggression Factors
- Minimum Trade Amount
- Trade Cost and Interest on Reserve
- Cash Burn Brake Point + Reduced Cash Burn Rate to a predefined point at Reserve Exhaustion.
The cost of this Subroutine, available as an Option, is not yet determined and depends strongly on how many parameter are to be included in the future.
Regards,
Hi Conrad,
Thank you. I understand. You have given me a lot to think about and I appreciate.
Best regards,
Ray
Hi HL99,
Thank you for your response. I was sure that was the case, but I thought I would check with you just in case to see if anything else might be involved.
Regards,
Ray
Hi Ray,
You seem to have a good grasp of the minimum buy interval, and Conrad already made some good points about using a less progressive step interval for higher priced stocks. (such as the 15%/16%/18% sequence)
You can continue to use AIM in an otherwise normal fashion. The system will keep track of your purchases, and you can follow the sell signals it issues once the price recovers. You don't have to use a "minimum sell interval" unless you want to.
As Conrad said, the minimum buy interval is really just a way to slow down the cash burn rate by ignoring buy signals that are above the predetermined price. It otherwise needn't interfere with the functioning of the system.
Hello Ray
I really like your suggestion of using a Dollar Amount decline for Consecutive Buy Indicators instead of using Percentage Declines as a method to slow down the Cash Burn rate.
To make sure I am understanding this correctly, please let me know if this is correct:
An investor has a stock which he purchased for $10 a share. He decides to let it decline 15% before he makes his first purchase. When the price declines to $8.50 he makes his first Buy (a decline of $1.50).
Now then, he doesn’t make his second consecutive Buy until it drops an additional $1.50, or down to $7.00 a share ($8.50 minus $1.50).
His third consecutive Buy would be around $5.50 ($7.00 minus $1.50).
Let me first point out that the method of using the
Minimum Buy Interval
Minimum Sell Interval
as is first suggested by Chuck Chakrapani in the Money Spinner and as I have outlined this on the AIM Forum See this for the Calculation Method:
http://investorshub.advfn.com/boards/read_msg.aspx?message_id=78924095
I seen to remember that this only used for small value stocks.
Note that according to this Money Spinner Method when you start with a price of 5 the Min. Buy Price =4,17 and that is a price drop of 16,7 %.
What you are doing, starting at a Hold Zone of 15%, is on principle the same thing but when you get to the price of 5 the %-drop in price is already 27 %
Price/New price/Price Drop
10,00 / 0,85 / 0,15
8,50 / 0,82 / 0,18
7,00 / 0,79 / 0,21
5,50 / 0,73 / 0,27
4,00 / 0,63 / 0,38
2,50 / 0,40 / 0,60
This would of course be a good way of reducing the Cash Burn Rate. I think I may have mentioned before that this amounts to an exponentially increasing Holding Zone. I had this idea on the past but at the time I tried to implement that as a mathematical formula. This a lot simpler. In Vortex AIM I have not formalised this. At the moment the User enters a percentage and the program advises a Trade at that percentage. The user can easily use the above table and after the Buy at 15% drop can enter the 18% drop and after a Buy at 18% he can enter 21%. . . etc. That is a few seconds work. This way you have to work your way back up the ladder when the price starts rising.
On the Selling side he can do the same thing. It takes a bit more work to adjust the Holding Zones. This could be automated. . .sure. . .but the question is: “What do you do if you use a Share Price of 100 to start with?”. You might want to start with 15% but is it effective to use 18/21/27/38 but the likelihood that a $ 100 stock will behave like that will be rare, and then you might want to be worried if it does J. Using a less progressive drop may then be better like 15/16/18/21/24.
In the AIM Forum we have discussed such Step Ladders quite a bit with ls7550 and he seems to think that it is a good way of sequencing the trades. The Step Sizes are calculated form the Trading Range Band.
In the Money Spinner it was done with a Manual Method but it could be changed into an algorithm so that the Ladder Step Size could be made more or less aggressive. .Using the Money Spinner basic approach you could use X% instead of 10% and us Y shares in stead of 100 shares. I think I discussed that option in one of my posts.
Of course, using the Filter Method. . .Ref. Ocroft. . . to not Buy until a price reversal occurs is also a very good way to reduce the Cash Burning.
Hello Ray
I really like your suggestion of using a Dollar Amount decline for Consecutive Buy Indicators instead of using Percentage Declines as a method to slow down the Cash Burn rate.
To make sure I am understanding this correctly, please let me know if this is correct:
An investor has a stock which he purchased for $10 a share. He decides to let it decline 15% before he makes his first purchase. When the price declines to $8.50 he makes his first Buy (a decline of $1.50).
Now then, he doesn’t make his second consecutive Buy until it drops an additional $1.50, or down to $7.00 a share ($8.50 minus $1.50).
His third consecutive Buy would be around $5.50 ($7.00 minus $1.50).
Let me first point out that the method of using the
Minimum Buy Interval
Minimum Sell Interval
as is first suggested by Chuck Chakrapani in the Money Spinner and as I have outlined this on the AIM Forum See this for the Calculation Method:
http://investorshub.advfn.com/boards/read_msg.aspx?message_id=78924095
I seen to remember that this only used for small value stocks.
Note that according to this Money Spinner Method when you start with a price of 5 the Min. Buy Price =4,17 and that is a price drop of 16,7 %.
What you are doing, starting at a Hold Zone of 15%, is on principle the same thing but when you get to the price of 5 the %-drop in price is already 27 %
Price/New price/Price Drop
10,00 / 0,85 / 0,15
8,50 / 0,82 / 0,18
7,00 / 0,79 / 0,21
5,50 / 0,73 / 0,27
4,00 / 0,63 / 0,38
2,50 / 0,40 / 0,60
This would of course be a good way of reducing the Cash Burn Rate. U think I may have mentioned before that this amount to an exponentially increasing Holding Zone. I had this idea on the past but at the time I tried to implement that as a mathematical formula. This a lot simpler. In Vortex Aim I have not formalised this. At the moment the User enters a percentage and the program advises a Trade at that percentage. The user can easily use the above table and after the Buy at 15% drop can enter the 18% drop and after a Buy at 18% he can enter 21%. . . etc. That is a few seconds work.
On the Selling side he can do the same thing. It takes a bit more work to adjust the Holding Zones. This could be automated. . .sure. . .but the question is: “What do you do if you use a Share Price of 100 to start with?”. You might want to start with 15% but is it effective to use 18/21/27/38 but the likelihood that a $ 100 stock will behave like that will be rare, and then you might want to be worried if it does J. Using a less progressive drop may then be better like 15/16/18/21/24.
In the AIM Forum we have discussed such Step Ladders quite a bit with ls7550 and he seems to think that it is a good way of sequencing the trades. The Step Sizes are calculated form the Trading Range Band.
Ref. Discussion on Hold Zones:
http://investorshub.advfn.com/boards/read_msg.aspx?message_id=80296664
Hi Karw,
I will try to interpret his with a data Set for SPY
Your suggestion for Hold Zones are:
Sell Hold Zone % = sigma / (PC/sh - sigma)
Buy Hold Zone % = sigma / (PC/sh + sigma)
I do this for 13 months data 14 data point.
I just want to see if this is the right method:
1-8-2011 / 122,22
1-9-2011 / 113,15
3-10-2011 / 125,5
1-11-2011 / 124,99
1-12-2011 / 125,5
3-1-2012 / 131,32
1-2-2012 / 137,02
1-3-2012 / 140,81
2-4-2012 / 139,87
1-5-2012 / 131,47
1-6-2012 / 136,1
2-7-2012 / 137,71
1-8-2012 / 141,16
31-8-2012 / 141,16
STDV Full Population: sigma =18,651 <-----Is this right with your Sigma calculation?
PC = 17475 @ 1-8-2011
PC/sh= Starting Price =122,22
S Holdzone = 18,651/(122,22-18,651) =0,180 ----> 18 %
B HoldZone = 18,651/(122,22+18,651) = 0,0,13 -----> 13 %
This appears reasonable for not having any other information.
**************************************************************
If I do the same thing for my latest optimization Run and actual prices in the Spy Demo Run I get this:
Demo Run SPY 20 Data Points
29-05-12 / 133,01
04-06-12 / 127,44
08-06-12 / 132,41
15-06-12 / 134,14
19-06-12 / 135,7
26-06-12 / 131,98
03-07-12 / 137,41
06-07-12 / 135,49
12-07-12 / 133,15
17-07-12 / 135,43
25-07-12 / 133,93
03-08-12 / 139,35
13-08-12 / 140,77
16-08-12 / 141,99
24-08-12 / 141,51
30-08-12 / 140,49
05-09-12 / 140,91
06-09-12 / 143,77
14-09-12 / 147,24
18-09-12 / 146,62
STDV Full Population: sigma = 5,1
PC = 8751 @ 29-05-12
PC/sh= Starting Price =133
S Holdzone = 5,1/(133-5,1) =0,04 ----> 4 %
B HoldZone = 5,1/(133+5,1) = 0,037 -----> 3,7 %
The optimization results for this run were
Sell Hold Zone = 13 % ------ Does not agree with Sigma Method
Buy Hold Zone = 4 % ------Does agree with Sigma Method
What do you make of this?
The SPY optimisation looks at the high price of 147 which gives an indication of the rising trend at the end of the run and finds the optimum Sell Hold Zone at 13 %
In the SPY Demo I had set the B Hold Zone at 3,5% and the Sell Hold Zone at 12 %.
Heartland 99:
I have been without a computer for about a week so I haven’t been able to ask you any questions.
I really like your suggestion of using a Dollar Amount decline for Consecutive Buy Indicators instead of using Percentage Declines as a method to slow down the Cash Burn rate.
To make sure I am understanding this correctly, please let me know if this is correct:
An investor has a stock which he purchased for $10 a share. He decides to let it decline 15% before he makes his first purchase. When the price declines to $8.50 he makes his first Buy (a decline of $1.50).
Now then, he doesn’t make his second consecutive Buy until it drops an additional $1.50, or down to $7.00 a share ($8.50 minus $1.50).
His third consecutive Buy would be around $5.50 ($7.00 minus $1.50).
Etc., etc.
My questions are do you use this method with the AIM formula….Portfolio Controls, SAFEs, etc.?
Or, do you use some methodology other than AIM to determine how many shares to purchase whenever the stock drops the predetermined Dollar Amount?
Thanks for your help.
Best Regards,
Ray
I got into this sort of investing in the early 1980-ties after reading the Money Spinner but did not take-up in that Min Trade Interval and then started reading Lichello. It was only after I discovered the Residual Buy(RB)that I wanted to get rid of it. . .not for the same reason you have though. . .My reason was more logical: "Why design a Trade Advisor Function and then have a Buy Advice again at the same price? That is silly. . .After one designs a Trade Advice then at the same price the Trade Advise=0 must come out of it. . .I am an Engineer A design must make sense! I called the RBf The Lichello Flaw . . .Got a lot of Flack on that.
I had not really analysed the effect of the RB but it was discussed then as a too great a Cash Burn Rate(CBR) for AIM. After I created Vortex AIM simply to get Advice= 0 after every Buy, using the PC-Update to give PC=V I automatically got a Bonus with the Buy Function
Buy = )PV-V)*M ---------> M= 1/(1-f)
With f being the PC-Update Fraction instead of the 0,5 for AIM. Using the value of f as a Trade Size Controller(Trade Aggression Factor) I had no longer a need for the SAFE because I could set the trade size as I wanted using the Aggression Factor.
But the problem of the Cash Burn Rate is still always there IF the trade size are too large, but to set P=V after a Buy has the Advantage of providing a natural Brake, similar to the SAFE acting as a brake on the buying with constant Hold Zone. Using a Hold Zone of 20 % for prise of 100 the Trade Prices become 80, 64, 52, 41. . . progressively smaller in an exponential decay manner . .this is good for preserving cash for declining prices but not good when the price decline reverses. This is the point where the use of a Filter comes in. . .you wait for an reversal and invest at close to the bottom
At one point I considered using Exponent ional Trade Multiplier that would make the Trades bigger as the price reached the limit of the Trading Range. . .but this does not work for Deep Divers and the Mathematics became too complex to get it done.
Recently I abandoned creating new mathematical adaptation to Vortex on . . I now think that frequent optimisation of the parameters is the solution. . I have a good way of doing it. Beyond that if the price get out of the trading range I tend to think the filter option is to be used.
That is a really good idea. Each incremental decline is a larger percentage decline than the previous purchased decline. In your example the first purchase was based upon a 17% decline, the second purchase would have been on a 20% decline, and the third purchase would have been on a 26% decline, etc.
This is something I had never thought about. Gives me something to serious consider.
Guess the first question that comes to mind is when do you sell after making a couple of consecutive purchases?
One thing comes to mind is that if you sold the shares bought on a decline when they recovered to the previous purchase price you would have a good LIFO profit. The shares bought at $4.15 would be sold when they reached $5.00 for a 20% profit; the shares bought at $3.30 would be sold when they reached $4.15 for a profit of 26% profit, etc.
Is that the way one would do their Sells? Or, do you have another method?
Thanks for sharing this idea with me.
Regards,
Ray
Hi Ray,
In his book Lichello warns against spending money like a "drunken sailor", however it is my opinion that is exactly what happens by doing AIM by the book. The first purchase is usually meaningful, but subsequent purchases are not a prudent use of the cash reserve....they are actually a foolish use of one's money because of the Residual Buy problem.
I tend to agree with you on this matter--I would prefer to buy just once at each price level, and wait for a subsequent drop before investing more.
In addition to Conrad's Vortex, I like the Minimum Buying Increment idea that Conrad and I discussed here in previous posts (under the Money Spinner subject lines). The general idea is to figure an initial drop, in stock price, where you would be comfortable purchasing and then requiring that same drop before investing more.
For example, if a $5.00 stock drops 17%, that would be $5.00 - $0.85= $4.15 for the initial purchase price.
Any subsequent purchase would require a drop of at least $0.85, so for example the next purchase at $3.30, then $2.45, etc.
This seems to accomodate a large drop (such as 2008-09) quite well.
I guess the reason I think like this is because when I first began investing many years ago, (I'm 70), I learned the "Constant Value or Constant Dollar" method of investing. I am sure that you are aware of this money management method of buying and selling around a "constant" or set dollar investment. For instance, one might have $100,000 in a fund or stock. They decide that they will buy or sell anytime the stock gains or losses $5,000. So if the value increases to $105,000 they would sell $5,000 and bring the value back to its "constant" $100,000 value. Reverse that action if it should decline to $95,000.
The problem with investing that way is because it requires someone to keep a very large cash reserve in case of a large market decline.
Now then, when I read Lichello's book back in 2004 I like the idea of using a SAFE value to dampen down the buying as a stock declined. I never did like the idea of using a Portfolio Control and increasing it whenever a purchase is made. That is more or less market timing because that is telling an investor that the decline will be over soon and to make as many purchases as possible and make each purchase as large as possible. An investor can't predict how far the market will fall. Also, the idea of waiting 30 days between purchases might leave a lot of money on the table that might otherwise have been made if the investor had a better way of making his purchase.
I got burned in 2008-2009 and ran out of cash way too early before the market finally bottomed out. I then decided there had to be a better way.
One other thing I thought about this morning. That is, since every purchase is a more meaningful purchase doing it the way I suggested, then one does not need to keep such a large cash reserve on hand.
For instance, suppose one decides to use a 10% SAFE and a 10% Minimum Transaction for their settings. This means that their stock has to decline 17% to trigger the first purchase. It also means that the stock will need to decline 17% for each additional purchase after that if the Portfolio Control is reset to the Stock Value after each purchase. So, an investor might figure that he will keep a cash reserve on hand to handle a 50% decline in value. All he needs to do is figure out how much 3 Buys would cost (17% X 3 = 51%) and that is how much cash he would need to keep in reserve. I know those numbers aren't exact, but they are close enough.
In his book Lichello warns against spending money like a "drunken sailor", however it is my opinion that is exactly what happens by doing AIM by the book. The first purchase is usually meaningful, but subsequent purchases are not a prudent use of the cash reserve....they are actually a foolish use of one's money because of the Residual Buy problem.
Anyway, this is my opinion.
Regards,
Ray
You are welcome any time Ray to explore the differences I have have created between AIM and Vortex. The more interesting thing in your approach is that you are the first to think on this like I do!
Take your time. . .
Regards
Hi Conrad,
It will take me a few days to digest all of this. I am unfamiliar with the terminology you are using. Chances are that I will have some questions for you.
Regards,
Ray
Ref Post # 35885 on AIM Users Bulletin Board.
Hi Ray. . .Your question caught my attention.
I the past a great number of discussion have been held in this. I was the one that originally found the Residual Buy very illogical. . . and coined the term “The Lichello Flaw”. In the meantime I no longer call it a flaw and agree that it is feature.
I have specifically created Vortex AIM to get rid of the Residual Buy and created the following method to do so. . .it appears exactly what you have in mind:
PC2 = PC1 + f*Buy
And from this I formalised the analysis andI caluclated the value of f to make the Buy to Include the Residual Buy. All he time I had in mind simply to modify AIM a bit, not really intending to createa comopletely different method. . .For example I had no intention right-a-way to update the PC after a Sell.
The analysis showed that the Buy contained the f-factor and became
Buy =(PC1-V)* 1/(1-f) = (PC1-V)*Mb. . . Mb = Multiplication Factor for the Buy
and so the PC Update modification became
PC2=PC1 + f*(PC1-V)/(1-f)
PC2=PC1 + f/(1-f)*(PC1-V)------> This results in PC = V2
And the Residual buy is gone!
Buy = (PC1-V1)*Mb = 0
Having found this result I liked it so much that I have also introduced that format also for the Selling, although for the selling the rationale behind it is simply to create a Sell Multiplication factor
Sell = (PC1-V)*Ms. . . .Ms = 1/(1-v)
and the PC Update formula becomes. . .of you want to do so:
PC2=PC1 + v/(1-v)*(PC1-V)
f= Buy Aggression Factor
v= Sell Aggression Factor
Using f=v= 0 gives the Default Option. . .(Standard Vortex AIM)
These are very conservative aggression values resulting in Buy amounts much smaller than for Standard AIM because the PC remains the same after a Buy. See Note (1)
For f> 0 and v>0 the trade amounts grow strongly and one can select the trade aggression as is desired so that the trade amount are large. . .for example for Low Volatility equity.
The is the Vortex Method
(1) Suppose you use the following Aggression factors:
f= 0,6
v=0
The Buy would become (PC1-V)* 1/(1-0,6) = (PC1 – V)* 2.5
1)This a rather aggressive Buying
2)This gives an almost identical Sell performance as AIM. . .No PC Update after a Sell.
Response to a potential Vortex Customer:
Dear Sir,
Good to hear you are interested in the Vortex Dynamic Investment Program.
Allow me to introduce myself: I am the original developer of Vortex Program in Excel and Chris Kruidenier has skilfully converted it to a modern Windows program. The basis for the Methodology of the investment technique is described in my book The Vortex Method.
Let me explain the significant changes that have been introduced
over time.
1 A Real Time Dollar and Real Time Euro exchange rate. . .updated every minute. You can switch that on or off as desired;
2 Return on Investment. . .ROI was previously defined in Vortex as a Time Averaged Investment calculation called ROTAI(1). This considered strictly only the investment of the "Capital at Risk", and not the Reserve that was kept on the books. As some people define as their investment also as the Reserve. . .this results in the Simple ROI. . and does not consider the dynamic nature of the investing, so I concluded that:
A ) The simple ROI is not a good indicator of the Yield of an dynamic investment in which the invested amount of money changes over time. I have therefore introduced a Yield Function that considered a time averaged inlay capital so that the yield percentage is calculated 100% accurately in the average amount of money invested.
This is called the ROTAC Yield: Return On Time Averaged Capital. One can spread the capital injections and withdrawals over time and the ROTAC Yield is always calculated over that variable amount of money that remains invested. If you take cash out of the Portfolio this reduces the invested capital and this increases the yield over time;
B) The ROTAI Yield formula: Return on Time Averaged Investment. . . is modified recently to be more accurate than it previously was. It now only uses the money that is used for buying equity.
The Reserve that is kept available for the Portfolio is not at risk in the equity that is bought. . . This Reserve is simply allocated for buying equity in the future, IF that becomes desirable. The interest that is earned on the Reserve is added to the Reserve and this increases the yield of the Portfolio only on account of the profit on the capital. This is a fair method because normally one gets a "savings account" yield on the money in the bank. . these interest earnings are now considered in the Portfolio Profit because the Reserve is. . .in a sense. . . dedicated to the Portfolio, but not as an investment in equity purchases. Dividend however is a special case as it is sometimes issued as shares and sometimes as cash. It is however a yield on the equity in either case and is entered into the Portfolio Input manually, according to the manner in which it is received.
There you have it. In Vortex one can simply switch from looking at ROTAC Yield to ROTAI Yield at a click on a button and that provides a very accurate representation of the fundamental difference between the two yield concepts.
At the moment the variable settings for proper investing are to be determined by the investor, although there is a conservative Default Mode that gives out rather small trade recommendations. I am working on a method to set the Hold Zones and the Trade Aggression Factors to optimised values on the basis of Price behaviour of the Equity. . .for example using the Trading Limits of the equity in the recent past. These method can now be communicated to you in general via the I-Hub Forum or in private via e-mail. Automation of this may be done in the future. For the private instruction in which I will do the calculation a fee-structure is set up as it involves considerable time to do. This fee-structure has been defined on this Forum already in Post # 571 on September 25 2012
I hope this information is useful to you.
Should you have any questions on the Vortex methodologies you can put the question on my I-Hub Forum:
http://investorshub.advfn.com/boards/board.aspx?board_id=1341
Regards,
(1) This is generally defined as the Internal Rate of Return(IRR). I have used a rather informal mathematical symbolism but that in not visible to Vortex Users. I have developed the formula myself from fundamentals and which factors to include or not is bases on my personal judgement.
Recently various discussions have been held in the AIM User Forum on calculating Hold Zones and SAFES for the AIM Method using Equity Price information.
Since Vortex AIM is in some respects quite different from Standard AIM these specific AIM settings have no real meaning for Vortex AIM.
Nevertheless I have been working on developing an algorithmic system which would calculate the Hold Zones and the Trade Aggression Factors based on Historical Equity Price Data.
At the moment Vortex has set up a manual method that is rather time-consuming but will be able to [b[optimise all the variable parameters on the Vortex program
1 The Cash Equity Ratio with which the Portfolio should be started;
2 The Buy & Sell Hold Zones. This is the Price Spread between which no trading should be done;
3 The Buy & Sell Trade Aggression Factors;
4 The Cash Burn Factor for cases that the Buy Advice is larger than the Reserve. This variable will stretch the buying into lower prices more effectively to increase yield.(*)
In all this it must be recognised that this optimisation will realise a maximised Yield for as long the historical price behaviour will approximately be repeated. The absolute parameter settings from the optimisation procedure will be “tempered” so that the settings will respond best to the approximate price behaviours of the Historical Data Set. The absolute yield figure for the portfolio will therefore be somewhat lower that was calculated in the optimisation. . .This a necessary procedure because future price behaviour will never be identical to past price behaviour.
When prices start to move significantly outside the boundaries of the Historical Data Set a new optimisation procedure must be executed with an updated data set.
Vortex AIM users will be able to purchase an Optimisation Kit for doing this optimisation themselves or they can sign up for a Optimisation Service Package.
Prices
Optimisation Kit:
1 A Vortex Excel Program prepared for the Equity that the Vortex Investor is using;
2 An Instruction Brochure for doing the optimisation.
The purchaser should have preferably identified the period for the Historical Data Set for which there is a definite Trading Range identifiable. . .if the historical data is very chaotic they the optimisation is less likely to be accurate. You can of course still buy the Optimisation Kit and get used to the procedure and use it for another equity. The Data Set can be arbitrarily changed for a different equity that shows good Trading Range behaviour.
The purchaser should provide en Excel list of the Historical Data Set.
Price = € 100 based on a 2-hour work load to prepare the Kit with the Equity prices provided by the Purchaser on an Excel File.
Should the Purchaser prefer that I get the prices myself for the chosen Equity then they must send me the exact Ticker Symbol, I will then select the proper period for the historical data Set and set the parameters intuitively for a good starting point for an optimisation (**). This extra work requires minimally 1 extra hour. To provide a margin for time overrun I charge 1,5 hour extra.
Price = € 175
Optimisation Service
The Optimisation will run over a 6-variable set of values that can cover a wide range of values. Sometime one can “hit” upon an optimises set of parameters rather quickly but in other case with larger data sets times if can take 6 hours or so. To be fair I will state that large data set that cover a long period are not to be used. I set m s fixed price.
a) Purchaser provides the Data Set no larger than weekly prices for a 6-month period.
Optimisation Price = € 200 for 1 hour Set-up and 3 hours of optimisation work. If the optimisation happens to go quickly you will receive a credit for the next Service;
b) Purchaser does not provide the Data Set but only the Ticker Symbol of the equity. I will then select the data set. Dat is ¾ hour extra:
Optimisation Price = € 275 for Service as in (a)
Prices are Net ex. Sales Tax
You must add money transfer fees to the Price.
For purchase from outside of The Netherlands no Sales Tax applies.
For purchase from the Netherlands 21 % Sales Tax must be added on the total amount. When money transfer fees are applied within The Netherlands they are subject to Sales Tax levies.(***)
Satisfaction on services guaranteed. If you have trouble with understanding what is to be done after the optimisation I help you out.
Note
My guarantee does not apply to achieving a certain yield result on you Portfolio. There are too many things that can happen over which I have no control. At best I can do is that after the optimisation I will run the a Mirror Portfolio if you send me a copy of your Vortex Portfolio File (Either Excel or Windows) and I will check out what happened and let you know what to do different if any. It could be that the prices have changed in such a way that the optimised Parameter set is no longer valid.
For ordering you can go to:
http://www.vortexcw.nl/vortex/index.html -------> Order Form
and describe the Product you want in the Information Box. These Optimisation products are not yet on The Product List.
(*) The Cash Burn Limit Factor is only present in my Vortex Excel Program. In Vortex Windows Program this works slightly diffrently and is a manual adaption if the Trade Asdvice is too large.
(**) In any optimisation procedure it is important to select a “good” starting point that will lead to the Absolute Maximum Result. Normally multiple Optimised Sets can be found and with starting with an examination of the process in the set one can select the best parameter settings to find the Optimised Parameter Set.
(***) The 21% Sales Tax applies from 1 October 2012
http://www.vortexcw.nl/vortex/index.html
VORTEX AIMing is a discussion and promotion platform for the VORTEX Automatic Investment Method and for the sale of the Vortex programs and booklets and services. I created the VORTEX Method after reading about anAIM-like investment technique known as theMoney Spinner, a name coined by Canadian investment expert Chuck Chakrapani in 1980. Thereafter I read How to make a million dollars. . .Automatically by Robert Lichello-1977. The Chakrapani method is in virtually identical to the Lichello AIM.
For a useful start on the Lichello Standard AIM there are spread-sheet available that shows you the basics of AIM(you do not have to read any difficult books if you want to invest with this basic method right away!):
http://www.dofusdaddy.com/aim_internet.htm
The Money Spinner presents an investment technique that has similar features as the Standard Lichello-AIM. These investment techniques are specifically created for investors that are not yet very experienced and want to be conservative with investing as they venture into the investment world. The VORTEX program belongs in the AIM-family of Automatic Investment Management systems, a name coined by Lichello but now-a-days it is used by various people that use AIM-like investment techniques. The Vortex Method is a neat derivative of the Lichello AIM in that it 1) provides for conservative(safe) trading as well as for aggressive trading and 2) eliminates what I call "The Lichello Flaw " in regards to Lichello's Residual Buy Advice that is given even if the share price is identical to the share price at the previous trade. For more information on standard AIM contact the AIM-website of Tom Veale:
http://investorshub.advfn.com/AIM-Users-Bulletin-Board-(AIMUSERS)-AIMUSERS-949/
with many interesting links on the topic.
*************************************************************************************************************************************************************************
New for Dutch Readers
It is a detailed presentation prepared for my attendance at the Dutch HCC Computer Club Investment Symposium in Geldermalsen:
http://www.beleggersonline.nl/index.php?option=com_content&task=view&id=220&Itemid=9
**************************************************************************************************************************************************************************
In this text: VORTEX means either any one the VORTEX investment technique or any of the the VORTEX computer programs - for Excel or for Windows.
The unique features of VORTEX are:
1 The trade Multiplication factor (M) sets the trade size relative to a Portfolio Reference point (PR) based on equity price changes after an initial trade. For an initial trade you simply select the amount of money you want to start your Investment with and the amount of money you want to keep as a Reserve for buying opportunities. In VORTEX the Trade Size = M*(PR-EV). . . .EV is Equity Value (value of shares or any type of tradeable equity). . .The value of M (multiplier) is calculated by a buying factor Fb for and a selling factor Fs. These non-linear factors simply indicate how aggressive or how conservative the trading is carries out. Experienced investors could use very aggressive factors like > 0.8 but less than 1.0, while inexperienced investors should start out with with conservative factors between 0 and 0.3 or so. In case negative values are used the trade recommendations can be set lower than the minimum recommended trade so that effectively the investor carries out a Buy and Hold investment techniekque which is recommended if one suspects a long rising price trend.
With any setting of the Fb <1 the value of M can be varied from 0 (Buy & Hold) to infinity for Fb=1. For the recommended Trade Size =M*(PR-EV) the PR is a Portfolio Reference, (a sort Set Point as is used in control theories), or as it is usually called in America, the Portfolio Control point = PC, is the new Equity Value after any trade is completed and is calculated by the Vortex program. The meaning of this name is interesting: In control theory a System is controlled by use of a controller Set Point. . . it is the reference point at which the controller takes corrective action to maintain the system on its desirable operating value. In the an AIM investment system the PR (or PC) does essentially the very same thing: it provided a reference point from which corrective action is executed to maintain the investment strategy on its growth-path. In investing it is usual to have a target for the future. . .if you do not have "target" be careful when investing any money! Read the section below on FOREX Trading on the dangers of losing money easily.. ..Forex trading uses a very aggressive investment technique by means of a high leverage factor (buying a lot of equity with little money).
For technical people the PR is a very important concept and this is also the reason that AIM-like programs are referred to as machines or engines. . .they work like car engines that are controlled by the drivers: the Fb and the Fs in Vortex are simply activity factors that makes the Vortex Engine work like a Fiat Panda with a 300 cc engine (the Conservative Mode), or like a Ferrari with a 6000 cc monster-engine (the Tiger Mode). Essentially a high activity factor allows you to trade equity that shows very low volatility as if it was a volatile stock. . .Vortex thrives on volatility.
2 After any trade the Trade Size Advice is automatically set to zero because then PR=EV. . . .after you just have executed a trade it would be obvious that you would not want to trade again, at the same price! By setting the Fb for buying and the Fs for selling separately you can control your trade activity for Portfolio Growth (saving mode) or for Portfolio Wind-down (retirement mode) exactly as YOU decide it. . these are two of the targets of the four investments modes you should have in mind when you start investing, in order to choose between them! The other two investment modes are a mix of aggressive & conservative buying or aggressive & conservative selling. In the technical Pamphlet The Vortex Method these four investment methods are explained in detail.
A least one more obvious target is the "maximized yield mode" . . . this target achieves the greatest Time Averaged Return on Investment (ROTAI) . . .but it this is only to be recommended for equity that is rather safe as well as stable.
3 An auxiliary Vortex trading module TurboVest is available as an "add-on" feature for effective "cutting edge" investing using equity credit. This a safe technique of investing with borrowed money. This technique is applied only in a Bear Market. TurboVest is not to be confused with "margin investing" which is normally only used for Bull Market conditions. Margin investing can wipe you out is a flash if the trend suddenly reverses! Margin investing is only an option if you can be VERY sure the equity prices are not going to reverse before a certain Profit Point is reached. If you can not ber certain of that such a point exists stay away from marging investing! The Turbovest Method is based on the requirement that 1) you invest only in funds or in a currency that can not go to zero value en 2) that your portfolio has already acquired a considerable positive value. The method is based on a\using an internally created leverage that is based on equity credit. The Turbovest Leverage at most 10 that arises out of the intrinsic value of your portfolio is very moderate compared to the aggressive FOREX trade leverage factors of 50 or 100 that are typically used. The Vortex Turbovest Module with special instructions is avalailable at moderate extra cost and we recommend this method only for people that alreaday are used to AIM-like investing
4 An auxiliary Vortex installment plan module PremiVest is available for periodic Lay-Away-Investing . . . small investments. . .at regular or irregular intervals without necessarily starting with a larger initial investment. The tLay-A-Way entry-amount can be any amount that a fund lets you buy at very low trading costs. Very interesting for applying to Mutual Funds for which the trading costs are say 0.1 to 0.3 % per trade and minimum starting amounts of say € 20. These low cost funds are ideal for frequent AIM-like dynamic trading and especially for trading with small amounts. Obvious this is an investment mode created for people with little extra extra money but can "lay-away" small amounts periodically. The Vortex PremiVest is meant for people that might want to invest small amounts irregulary. . .thus when they get the extra money.
For Dutch Readers see how to orderThe Vortex Method book (Dutch only), and it's short English Edition(only the bare bones Details of the Vortex Method) and the Vortex Windows Program; the Vortex Excel sheets (for Back-testing and for getting Vortex AIMing experience), on my website's Order Form:
http://www.vortexcw.nl/vortex/index.html
Back-testing is particularly effective for finding the optimum values for the activity factors and the trading thresholds(minimum buys and price intervals). . . The limits within which no trading should occur- this is also called the Dead Band.If you do not understand any of this do not panic! . . .just ask me a question on this forum or on my e-mail and I will answer you immediately.
Power Point Presentations
Additional information on the Vortex Methode with examples are presented.
The Power Point presentations are available in Dutch as well as in English. Direct downmoading information(to come). Englisch version viae-mail : eng@vortex.de[remove red text &brackets]mon.nl.
Right now you can request the Dutch Power Point document via the DOWNLOAD link in : http://www.vortexcw.nl/vortex/index.html ;
****************************************************************************************************************************************
The Vortex FOREX Method (Excel as well as for Windows ) has been adapted. The program manages the Portfolio Value in terms of currency in which the foreign currency pairs are bought. . . .In Excel this can be any currency and in the Windows program this is Euro or US Dollar. The "pip" definition for triggering trades can be used but also one can retain the percentage rate change as a trade trigger. The programs provides an input for the desirable FOREX margin leverage and an extra variable parameters, and offers the same unique features for variable trade multipliers for buying as well as for selling as in the standard Vortex Method program. . .a total of 6 variables apart from the standard Vortex features this gives:
-trading cost fixed fee...enter as applicable. . . often this not applicable for online FOREX trading but is relevant for other equity trading: set to 0 for Forex trading;
-trading cost: fee as a percentage of the trade amount . . .enter as applicable;
- setting the Reserve fraction that is to remain as a Reserve Buffer preventing the Reserve to go all the way to zero (Portfolio Value Factor);
-setting the buy/sell holding zones for the trading below which no trade is advised; - the Cash Equity Ratio to start a portfolio;
-interest received on Reserve Capital...enter as a simple interest for Credit Balance and for Debit Balance for the TurboVest Option. The program compounds the interest automatically on each trading event and adds it to the Portfolio Value;
-Setting the margin percentage for margin investing
The leverage or margin percentage determines the amount of foreign currency that you can buy with 1 unit of your account currency. This ratio is the Leverage or Margin Ratio.
In effect this parameter defines the percentage of the pre-financing the the Forex Agent provides. For example if you buy fan amount of equity for € 100 and the leverage is 100 the investor pays € 1 and the Forex Agent lends you € 99, frequently even at zero lending cost!!!!!
With the Vortex FOREX trading the Reserve(or Deposit to the Agent) is calculated on the inverse leveraged amount: For example id you buy € 100 equity your Vortex Reserve is reduced bu only €1 because € 99 is provided by the Agent. When a margin position is liquidated the net proceeds of the position are added to the Reserve just like in ant other Vortex Sell. The net value of a margin position is called the Net Asset Value of your position. As the currency value rises or drops the profit is added to the Reserve so that the Reserve is an actual indication of the Deposit of your account. As you are trading you can see directly the margin you have on you account for buying foreign currency as well as the point at which you will get and automatic Position Closure so that you can prevent getting a Margin Call from your broker. . .this is your broker warning you that unless you deposit extra money into your account ALL your positions might be closed very soon if the equity value drops further.
For a more instructive explanation on FOREX trading see for example this Link:
http://fxtrade.oanda.com/tools/fxcalculators/units_available_calculator.shtml
The Vortex FOREX Method version is available as a Trade Limiter Investment Machine(TurboVest) as well as the Standard Option which prevents a negative Reserve. . .If the Reserve approaches 0 the Trade Advise is zero in the Standard Vortex method. With the Turbovest Method you can set the Portfolio Value Factor in such a way that a certain amount of Portfolio Vaue is protected so that you will not get a Trade Advice to get you in Negative Portfolio Value. The Portfolio Value Factor can be set to trade all the way down to zero or to leave a residual amount of value available at all times.
The Vortex FOREX TurboVest Method is actually an Equity Credit Trading Manager. . . It allows trading up to a specified Equity Credit Level ( ECL). This limiting amount can be set to zero ( No equity credit buying) or as high as you can afford it). The Turbovest Method is NOT a margin trading method. The equity credit arises from your own equity in your portfolio. If you have no equity to start with you can not invoke the TurboVest Method. The net value of your portfolio must be greater than zero in order to use the TurboVest Method. If you use the TurboVest method in combination with the Margin Trading method then your equity credit can be used to increase the margin deposit so that you can keep buying at a deeper equity price dip.
******************************************************************************************************************************************************************************
Price information for Vortex programs and booklets is available on the Order Form Page on http://www.vortexcw.nl/vortex/index.html
All prices are listed in Euro but you can also pay in Dollars, or even in other currencies, but you have to provide your own exchange rate conversion and transfer cost figures. Paying via PayPal is the preferred method from foreign countries as the currency conversion fees are low. Paying with Euro currency to my bank account in The Netherlands is also possible but you would have to ad € 16 extra per payment. for the bank charges.
My PayPal account name is C.L.H. Winkelman and/or Vortex Engineering. The e-mail address is eng@vort{remove red text & brackets}ex.demon.nl
***************************************************************
Conrad L H Winkelman
Vortex Technologies
Prinsessenweg 31-A
3433 AB Nieuwegein
The Netherlands
E-mail: See above and also Home page on http://www.vortexcw.nl if you are interested in other things I do or did.
Vortex Windows Program Website:
http://www.ckweb.nl/vortex_us/index.php Free Download Standard Vortex Method for 30 days. . . full capabilities. For the Forex Version request via e-mail.
Remark: VORTEX is a bilingual program: English & Dutch for all the user text . Simply select the language of your choice during installation or in the pull-down menu ----> Options/Settings and from there selecting the language of the interface and the Reports is explained. For free downloading the latest 30-day complete version of Vortex Version 1.26 click on:
http://www.ckweb.nl/vortex_us/index.php
In VORTEX it is possible to download various equity prices from the USA and/or European providers. You can inspect charts of the Portfolio Value and Share Values. You can use the full program for 30 days at no cost to you.
The VORTEX Help-File is formatted in Windows Style. Changes are being implemented as the development continues and you get a message as a new version is available.
Excel basic-versions of Standard VORTEX are available. They show the principal features without all the portfolio features of the the Windows version . The cost of these Excel sheets are €25 including Order Processing costs but not exchanging foreign currency payments to Euro. These programs an be used for testing strategies of Portfolio Management so that the Activity Factors, Trade Dead Band, and the Cash Equity Ratio (CER) can be optimized on the basis of anticipated share price swings or price histories. Also the actual Return On Time Averaged Investment (ROTAI) is calculated on these Vortex Excel sheets(See Note below):
a) The Turbovest Version (can use cash positions for money borrowed on Equity Value). The Leverage is typically 5.
b) Cash Limiter Version(Cash can be limited all the way to 0). This reduces the value of the trade executing when the Reserve gets close to zero..
FOREX trading programs cost € 60
Order Form on:
http://www.vortexcw.nl/vortex/index.html
Updated: March 31 , 2015
NB: The ROTAI method for return on investment calculation is used instead of the simple ROI-method (which is based on the assumption that at intermediate moments capital is added or withdrawn from the Portfolio, and is really only representative for a Buy & Hold investments for which the investeg capital does not change in value, and for which there are no trading costs involved). The ROTAI-method accommodates intermediate Buy & Sells to calculate the real ROI of the average invested capital over time. Investment additions or withdrawals are calculated on the actual dates the trades are executed and interest gained is added or subtracted if paid (for borrowed money, if applicable) as this is entered into the VORTEX registry. Likewise all costs and investment earnings are included in the ROTAI-calculation so that it gives a true representation of the yield on an annual basis.
| Volume | |
| Day Range: | |
| Bid Price | |
| Ask Price | |
| Last Trade Time: |


