 News
News  Market Data
  Discover
Support: 888-992-3836
Copyright © 2023 InvestorsHub Inc.


Register for free to join our community of investors and share your ideas. You will also get access to streaming quotes, interactive charts, trades, portfolio, live options flow and more tools.
DGAZF "Redemption" ... CASH OUT RATE 90.162400 .
https://otce.finra.org/otce/dailyList
thanks, it was amusing
DGAZF - all shares to be redeemed at fair value as per a Credit Suisse press release at 5pm today -
The last trade was at $15,000 .... the next trade will be near fair value of $120.
https://2deaa804a6dc693855a0-eba658c6bc03668a61900f643427d64d.ssl.cf1.rackcdn.com/Documents/product/velocityshares/news/Credit%20Suisse%20AG%20Announces%20the%20Acceleration%20at%20Its%20Option%20of%20its%20Previously%20Delisted%20VelocitySharesTM%203x%20Inverse%20Natural%20Gas%20ETNs.pdf
I'm mystified by the DGAZF price action .... now at $13,000 yet volume a mere 741 shares when there are 305,000 shares outstanding .... where are the sellers ???? If I owned any shares I'd be selling most if not all at these prices. It's a mystery why some selling pressure doesn't develop. I'd be very interested to know what's going on.
Someone explain the current price of DGAZF ? Monopoly $$ ??
EIA reports a build of 56 Bcf versus expectations for a build of 58 Bcf and the 5 year average of 68 Bcf.
NG drops from $1.87 to $1.86/mcf when the news hits.
Current storage is 3,133 Bcf which is 454 Bcf above the five-year average of 2,679 Bcf.
NG surplus to shrink over the next 10 weeks according to this article -
https://seekingalpha.com/article/4356604-natural-gas-storage-annual-surplus-will-continue-to-shrink-for-another-10-weeks-least
EIA reports a build of 65 Bcf versus expectations for a build of 78 Bcf and the 5 year average of 65 Bcf.
NG rises from $1.70 to $1.73/mcf when the news hits.
Current storage is 3,077 Bcf which is 466 Bcf above the five-year average of 2,611 Bcf.
EIA reports a build of 120 Bcf versus expectations for a build of 106 Bcf and the 5 year average of 73 Bcf.
NG drops from $1.53 to $1.51/mcf when the news hits.
Current storage is 3,012 Bcf which is 466 Bcf above the five-year average of 2,546 Bcf.
WTF WHY!!. Azz Hole!!
EIA reports a build of 85 Bcf versus expectations for a build of 85 Bcf and the 5 year average of 87 Bcf.
NG rises from $1.62 to $1.63/mcf when the news hits.
Current storage is 2,892 Bcf which is 419 Bcf above the five-year average of 2,473 Bcf.
$1.66 NG Trendline support test underway and $1.65 gap test.
dude iligence Wednesday, 05/13/20 10:40:32 AM
Re: None 0
Post #
18953
of 18964
DGAZ has been doing quite well for the last 7 days. NG $1.67 ish low on bottom trend line. fall below double bottom test $1.52-$1.61 .25 contango contract expires 5/27/20 13%x3 39% UGAZ/DGAZ. Plan accordingly
---------------------
Current Contango is.09 $1.677/$1.767 =5.4%x3=16.2% UGAZ/DGAZ bleed/boost for any given NG price+bleed. Possible scenario, NG stays in tight range chart rolls, .09 contango gap up then price bleeds back down to close the gap. NG doesnt really go anywhere price wise but DGAZ gains and UGAZ loses. Last month DGAZ gained aprox 44% month before over 50%. Contango is NG traders best friend if you understand how to play it. If you don't simply move to the sideline when the fwd month volume exceed the front month contract volume and wait for the contango to unwind paying close attention the change in UGAZ/DGAZ pricing in relation to NG prices as contango unwinds.
The NG trade has forever changed. How? LNG exports. US natgas market pre-LNG exports was not affected by the world NG market price. Whether or not the LNG exports have much effect on demand the perception is there.
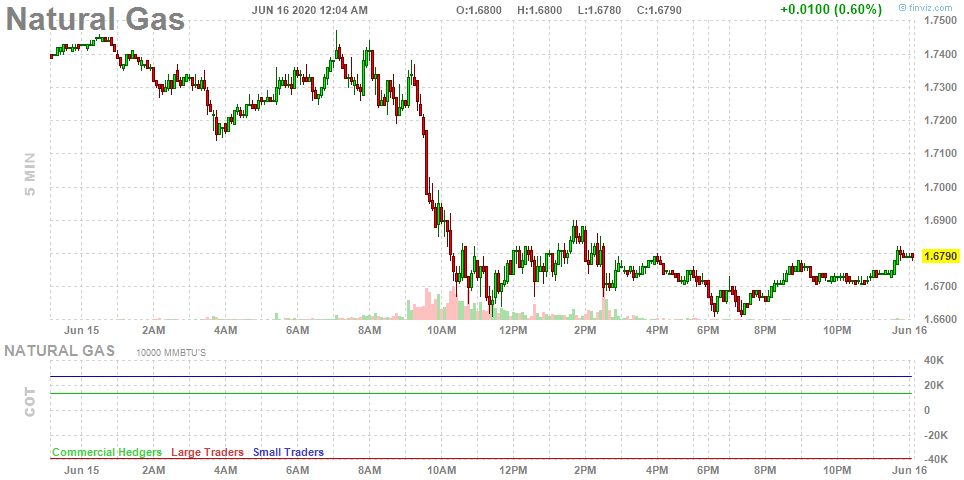
Natural Gas Jul '20 (NGN20)
1.678 +0.009 (+0.54%) 23:38 CT [NYMEX]
1.677 x 10 1.678 x 5
for Tue, Jun 16th, 2020Alerts Watch Help
Back to Futures / Quotes / NGN20 / Futures PricesShare
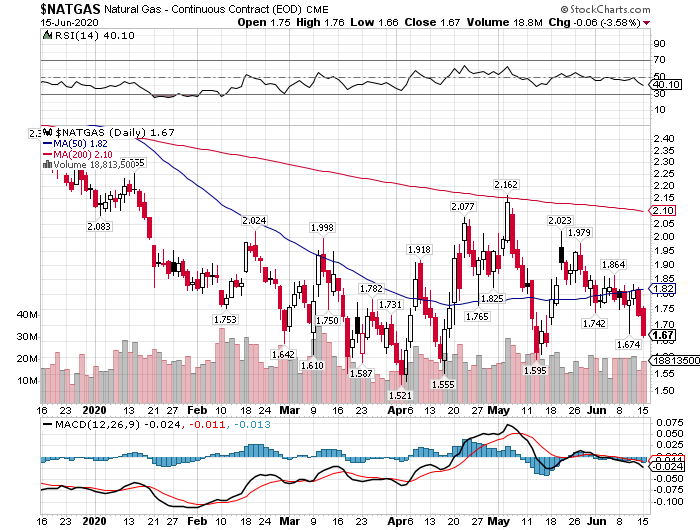
Natural Gas Closes At A 1-Month Low On Weak Export Demand
cmdtyNewswires - Mon Jun 15, 3:32PM CDT
Jul Nymex natural gas (NGN20) on Monday closed down -0.062 (-3.58%).
Nat-gas prices on Monday dropped to a 1-month nearest-futures low. Weak export demand is weighing on nat-gas prices as BNEF data showed that scheduled natural gas flows to LNG export plants on Monday at 3.81 bcf/d, down -38% this month and just above the 14-month low of 3.5 bcf/d posted on June 9.
Industrial demand for nat-gas remains weak, with the U.S. economy still slowed by the pandemic. BNEF reported that nat-gas demand from U.S. industrial consumers in May fell -4 bcf/d from a year earlier.
Additional losses in nat-gas may be limited in the near-term by above-normal temperatures in the U.S. Maxar last Friday said that temperatures will be above-normal across most of the lower 48 U.S. states June 17-21, although the intensity of the heat eased in updated weather forecasts. The Commodity Weather Group last Thursday said that temperatures may be above-normal in the central and northeastern U.S. during June 16-20 and that the heat may linger on the East Coast through June 25.
Jul nat-gas was undercut last Wednesday by the IEA's 2020 Gas report, which said that global nat-gas consumption will slump by a record -4% this year, or twice the amount lost after the 2008 financial crisis. The IEA said European nat-gas demand this year during Jan-May has already fallen -7% y/y due to the coronavirus pandemic.
U.S. nat-gas production continues to be weak, which is supportive for nat-gas prices. U.S. lower-48 state dry gas production on Monday fell by -6.3% y/y at 84.108 bcf/d, the 32ndt consecutive day that nat-gas production has fallen on a year-on-year basis, according to figures calculated by Bloomberg.
Baker Hughes last Friday reported that the number of active U.S. nat-gas drilling rigs rose by +2 rigs in the week of June 12 to 78 rigs, rebounding a bit from the record low (data from 1987) of 76 rigs seen in the week ended June 5
Last Thursday's weekly EIA report of +93 bcf was slightly below market expectations of +94 bcf and left total U.S. nat-gas supplies at 2,807 bcf in the week of June 5, down from the 2-1/4 year high of 3,732 bcf posted in the week of Nov 8. Inventories are up +34.4% y/y and are +17.6% above the 5-year average.
Dgaz is about to crash it's way too expensive. Look at that market cap. It doesn't make any sense at all. It's unreal.
EIA reports a build of 93 Bcf versus expectations for a build of 93 Bcf and the 5 year average of 94 Bcf.
NG drops from $1.81 to $1.79/mcf when the news hits.
Current storage is 2,807 Bcf which is 421 Bcf above the five-year average of 2,386 Bcf.
NG $1.72 contango gap closed as predicted and promised, REPEATEDLY. Further Proof I'm The Best GD Natgas Trader you'll have the opportunity to converse with.
There is a gap below the $1.72 we may see it tested tomorrow. $1.65-$1.7.
dude iligence Thursday, 05/21/20 10:23:59 AM
Re: dude iligence post# 18953 0
Post #
18957
of 18961
Dgaz $279+$17+6.55% Jun 1.72 July 1.86 contango .13-.14. Jul vol now greater than Jun vol, chart rolls, expiration 5/27/20 .13=7.%×3=22% ugaz/dgaz at any given ng price. Plan accordingly.
https://investorshub.advfn.com/boards/read_msg.aspx?message_id=155959448
https://investorshub.advfn.com/boards/read_msg.aspx?message_id=155792074
https://investorshub.advfn.com/boards/read_msg.aspx?message_id=155794862
https://investorshub.advfn.com/boards/read_msg.aspx?message_id=155915186
https://investorshub.advfn.com/boards/read_msg.aspx?message_id=155920687
https://investorshub.advfn.com/boards/read_msg.aspx?message_id=155959448
https://investorshub.advfn.com/boards/read_msg.aspx?message_id=155992039
The contango gap closer play $1.72 to $1.85 to $1.72 round trip resulted in aprox 45% gain in DGAZ $220 -$230ish May 20ish thru tomorrow. UGAZ lost about 28% during the same time. DGAZ benefits greatly during contango. Trading Contango is not something you can learn overnight. If you dont understand it simply go to the sideline when the fwd month NG contract volume exceeds the frt month vol. Then wait for Contango gap to close paying close attention to the change in UGAZ/DGAZ values at any given price of NG.
NG has been dropping since May 5th DGAZ has been going up since then.
I warned about knowing when a top was in as well. Some indicators never disappoint. DGAZ was $138 on May 5th at $330 its up 139%.
I repeatedly posted how to use this indicator.
https://investorshub.advfn.com/boards/read_msg.aspx?message_id=155599020
EIA reports a build of 102 Bcf versus expectations for a build of 110 Bcf and the 5 year average of 103 Bcf.
NG rises from $1.83 to $1.84/mcf when the news hits.
Current storage is 2,714 Bcf which is 422 Bcf above the five-year average of 2,292 Bcf.
Dgaz has been moving up nicely since my last post concerning contango.from $220 now $$316 up $23 +8% today ng is $1.78 .06 more to go till contango gap unwinds. Somwhere in that area will be dgaz exit time ugaz buy time. The best thing about contango is most people in natgas trade either dont know what it is or understand how to use it to your advantage. I'm seeing trades based on emotion or feelings. The widow maker cares how you feel. She's not happy till your not happy.
Finviz rolled the chart tonight .14s 8% contgap
up. 8x3=24% potential move dgaz ugaz as contango unwinds. Any closing of that gap is money made holders of dgaz money lost holders of ugaz.
EIA reports a build of 81 Bcf versus expectations for a build of 83 Bcf and the 5 year average of 87 Bcf.
NG rises from $1.73 to $1.74/mcf when the news hits.
Current storage is 2,503 Bcf which is 407 Bcf above the five-year average of 2,096 Bcf.
Dgaz $279+$17+6.55% Jun 1.72 July 1.86 contango .13-.14. Jul vol now greater than Jun vol, chart rolls, expiration 5/27/20 .13=7.%×3=22% ugaz/dgaz at any given ng price. Plan accordingly.
EIA reports a build of 103 Bcf versus expectations for a build of 107 Bcf and the 5 year average of 85 Bcf.
NG rises from $1.66 to $1.67/mcf when the news hits.
Current storage is 2,422 Bcf which is 413 Bcf above the five-year average of 2,009 Bcf.
Got my trailing stop order already in...
DGAZ has been doing quite well for the last 7 days. NG $1.67 ish low on bottom trend line. fall below double bottom test $1.52-$1.61 .25 contango contract expires 5/27/20 13%x3 39% UGAZ/DGAZ. Plan accordingly
EIA reports a build of 109 Bcf versus expectations for a build of 106 Bcf and the 5 year average of 74 Bcf.
NG drops from $1.94 to $1.91/mcf when the news hits.
Current storage is 2,319 Bcf which is 395 Bcf above the five-year average of 1,924 Bcf.
EIA reports a build of 70 Bcf versus expectations for a build of 69 Bcf and the 5 year average of 74 Bcf.
NG rises from $1.86 to $1.87/mcf when the news hits.
Current storage is 2,210 Bcf which is 360 Bcf above the five-year average of 1,850 Bcf.
At least 20 cargoes of US liquefied natural gas (LNG) have been cancelled by buyers in Asia and Europe, according to Reuters. The global pandemic and the unfolding economic crisis have slashed demand for gas worldwide. Cheniere Energy, one of the main exporters of US LNG, has seen an estimated 10 cargoes cancelled by buyers halfway around the world, Reuters said.
The price for LNG in Asia was already crashing before the pandemic, owing to a substantial increase in supply last year. Prices for LNG in Asia for June delivery have recently traded at $2/MMBtu (million British Thurmal Units), only slightly higher than Henry Hub prices in the US.
As recently as October, LNG prices in Asia traded at just under $7/MMBtu.
The problem for American gas exporters is that after factoring in the cost of liquefaction and transportation, gas breakeven prices for delivering to Asia are around $5.56/MMBtu, according to Reuters. But prices are trading at less than half of those levels.
EIA reports a build of 43 Bcf versus expectations for a build of 39 Bcf and the 5 year average of 49 Bcf.
NG rises from $1.89 to $1.92/mcf when the news hits.
Current storage is 2,140 Bcf which is 364 Bcf above the five-year average of 1,776 Bcf.
EIA reports a build of 73 Bcf versus expectations for a build of 64 Bcf and the 5 year average of 27 Bcf.
NG rises from $1.55 to $1.57/mcf when the news hits.
Current storage is 2,097 Bcf which is 370 Bcf above the five-year average of 1,727 Bcf.
EIA reports a build of 38 Bcf versus expectations for a build of 24 Bcf and the 5 year average of 6 Bcf.
NG rises from $1.76 to $1.78/mcf when the news hits.
Current storage is 2,024 Bcf which is 324 Bcf above the five-year average of 1,700 Bcf.
EIA reports a draw of 19 Bcf versus expectations for a draw of 24 Bcf and the 5 year average of 19 Bcf.
NG drops from $1.54 to $1.52/mcf when the news hits.
Current storage is 1,986 Bcf which is 292 Bcf above the five-year average of 1,694 Bcf.
EIA reports a draw of 29 Bcf versus expectations for a draw of 25 Bcf and the 5 year average of 40 Bcf.
NG rises from $1.65 to $1.67/mcf when the news hits.
Current storage is 2,005 Bcf which is 292 Bcf above the five-year average of 1,713 Bcf.
EIA reports a draw of 9 Bcf versus expectations for a draw of 7 Bcf and the 5 year average of 63 Bcf.
NG rises from $1.63 to $1.65/mcf when the news hits.
Current storage is 2,034 Bcf which is 281 Bcf above the five-year average of 1,753 Bcf.
EIA reports a draw of 48 Bcf versus expectations for a draw of 59 Bcf and the 5 year average of 99 Bcf.
NG drops from $1.81 to $1.79/mcf when the news hits.
Current storage is 2,043 Bcf which is 227 Bcf above the five-year average of 1,816 Bcf.
So much gas can't help prices.
EIA reports a draw of 109 Bcf versus expectations for a draw of 108 Bcf and the 5 year average of 106 Bcf.
NG holds steady at $1.81/mcf when the news hits.
Current storage is 2,091 Bcf which is 176 Bcf above the five-year average of 1,915 Bcf.
EIA reports a draw of 143 Bcf versus expectations for a draw of 158 Bcf and the 5 year average of 122 Bcf.
NG drops from $1.75 to $1.71/mcf when the news hits.
Current storage is 2,200 Bcf which is 179 Bcf above the five-year average of 2,021 Bcf.
EIA reports a draw of 151 Bcf versus expectations for a draw of 147 Bcf and the 5 year average of 136 Bcf.
NG rises from $1.94 to $1.96/mcf when the news hits.
Current storage is 2,343 Bcf which is 200 Bcf above the five-year average of 2,143 Bcf.
EIA reports a draw of 115 Bcf versus expectations for a draw of 110 Bcf and the 5 year average of 131 Bcf.
NG drops from $1.85 to $1.84/mcf when the news hits.
Current storage is 2,494 Bcf which is 215 Bcf above the five-year average of 2,279 Bcf.
EIA reports a draw of 137 Bcf versus expectations for a draw of 129 Bcf and the 5 year average of 143 Bcf.
NG rises from $1.85 to $1.86/mcf when the news hits.
Current storage is 2,609 Bcf which is 199 Bcf above the five-year average of 2,410 Bcf.
EIA reports a draw of 201 Bcf versus expectations for a draw of 195 Bcf and the 5 year average of 143 Bcf.
NG drops from $1.85 to $1.83/mcf when the news hits.
Current storage is 2,746 Bcf which is 193 Bcf above the five-year average of 2,553 Bcf.
UNG may start a position,Watching United States Natural Gas Fund, LPNYSE Arca:UNG
Morningstar rating: Not RatedCommodities Energy
Prospectus
Change fund Symbol lookup
UNG
Set TriggersView Option ChainSet AlertAdd to watch listIncome EstimatorETFs Glossary
$14.99 0.08 (0.54%)Bid
14.98
Ask
14.99
B/A Size
8400x8600
IIV
15.11
High
15.27
Low
14.95
Volume
1,730,664 (Above Avg)
As of January 23, 2020 11:11am ET
Summary
Performance
Ratings & Risk
Portfolio
Chart
Print All Tabs
Gross Expense Ratio*1.28%
Net Expense Ratio*1.28%
Total Assets$438M
SEC 30 Day Yield (as of 11/30/19 )--
Distribution Yield (TTM)0.00%
Ann. Dividend/YieldNo Regular Dividends
Ex-Dividend Date--
Premium/Discount0.41%
52-Wk Range
14.56 - 27.54
LowHigh
Leveraged ETF Factor100
Fund Inception04/18/2007
Historical Quotes & Splits
Current | 1mo | 3mo | 6mo | 1yrDJIAS&P 500NASDAQView Advanced Chart
About this ETF
The investment seeks to reflect the daily changes in percentage terms of the price of natural gas delivered at the Henry Hub, Louisiana, as measured by the daily changes in the price of a specified short-term futures contract.The fund invests primarily in futures contracts for natural gas that are traded on the NYMEX, ICE Futures Europe and ICE Futures U.S. (together, “ICE Futures”) or other U.S. and foreign exchanges. The Benchmark Futures Contract is the futures contract on natural gas as traded on the New York Mercantile Exchange that is the near month contract to expire, except when the near month contract is within two weeks of expiration.
Commodity ETFs may be affected by changes in overall market movements, commodity index volatility, changes in interest rates or factors affecting a particular industry or commodity. Commodity ETFs may be subject to greater volatility than traditional ETFs and may not be suitable for all investors. Unique risk factors of a commodity fund may include, but are not limited to the fund's use of aggressive investment techniques such as derivatives, options, forward contracts, correlation or inverse correlation, market price variance risk and leverage.
Learn more about Leveraged, Inverse and Commodity ETFs
Trailing Total Returns
Market Return %
(as of 12/31/2019) NAV Return %
(as of 12/31/2019) Market Return %
(as of 12/31/2019) NAV Return %
(as of 12/31/2019)
1-Month -5.44% -3.30% -5.44% -3.30%
3-Month -15.40% -15.15% -15.40% -15.15%
6-Month -15.23% -14.71% -15.23% -14.71%
Year-to-date -31.77% -30.54% -31.77% -30.54%
1-Year -31.77% -30.54% -31.77% -30.54%
3-Year -23.30% -23.09% -23.30% -23.09%
5-Year -22.18% -21.98% -22.18% -21.98%
10-Year -25.56% -25.52% -25.56% -25.52%
Since Inception -30.20% -30.17% -30.20% -30.17%
Inception Date: April 18, 2007
Performance Details
Total return reflects performance without adjusting for sales charges or the effects of taxation, but is adjusted to reflect all actual ongoing fund expenses and assumes reinvestment of dividends and capital gains. If adjusted, sales charges would reduce the performance quoted.
Performance data quoted represents past performance, is no guarantee of future results, and may not provide an adequate basis for evaluating the performance potential of the product over varying market conditions or economic cycles. Current performance may be higher or lower than the performance data quotes. The investment return and principal value of an investment will fluctuate so that an investor's shares, when redeemed, may be worth more or less than their original cost.
Standardized Returns
Market Return %
(as of 12/31/2019) NAV Return %
(as of 12/31/2019) Market Return %
(as of 12/31/2019) NAV Return %
(as of 12/31/2019)
1-Year -31.77% -30.54% -31.77% -30.54%
5-Year -22.18% -21.98% -22.18% -21.98%
10-Year -25.56% -25.52% -25.56% -25.52%
Since Inception -30.20% -30.17% -30.20% -30.17%
Inception Date: April 18, 2007
Sector Breakdown
No Sector Data Available.
Top 10 Holdings
Company YTD Return % of Assets
* United States Treasury Bills -- 3.00%
* United States Treasury Bills -- 1.51%
* United States Treasury Bills -- 1.50%
* United States Treasury Bills -- 1.50%
* United States Treasury Bills -- 1.50%
* United States Treasury Bills -- 1.50%
* United States Treasury Bills -- 1.50%
* United States Treasury Bills -- 1.50%
* United States Treasury Bills -- 1.50%
* represents an International company or one without a recognizable symbol.
Portfolio Details
Morningstar Wrap-Up
Morningstar Style Box
Not Available
As of --
Risk
Low High
Return
Low High
What's This?
As of 12/31/2019
Reports and Ratings
CFRA
Rating since 01/23/20
View 01/23/20
TheStreet
Rating since 01/17/20
View 01/13/20
MarketEdge
View
Rating since 01/17/20What's This?
Fees & Management
Manager Management Team
Manager Start 04/18/2007
Management Fee 0.60%
Expense Ratio 1.28
EIA reports a draw of 92 Bcf versus expectations for a draw of 91 Bcf and the 5 year average of 194 Bcf.
NG drops from $1.97 to $1.95/mcf when the news hits.
Current storage is 2,947 Bcf which is 251 Bcf above the five-year average of 2,696 Bcf.
Wow, I've been out for a while, dropped way too soon. Ugh.
The move away from nat gas and coal. The Wood Mackenzie report, titled China provincial renewables competitiveness report 2019, reveals that the average levelized cost of electricity (LOCE) of solar and wind power in China is already cheaper than that of natural gas-fired power and will also overtake coal by just 2026.
EIA reports a draw of 109 Bcf versus expectations for a draw of 95 Bcf and the 5 year average of 184 Bcf.
NG rises from $2.13 to $2.16/mcf when the news hits.
Current storage is 3,039 Bcf which is 149 Bcf above the five-year average of 2,890 Bcf.
|
Followers
|
133
|
Posters
|
|
|
Posts (Today)
|
0
|
Posts (Total)
|
18980
|
|
Created
|
08/02/12
|
Type
|
Free
|
| Moderators | |||
| Volume | |
| Day Range: | |
| Bid Price | |
| Ask Price | |
| Last Trade Time: |


