 News
News  Market Data
  Discover
Support: 888-992-3836
Copyright © 2023 InvestorsHub Inc.


Register for free to join our community of investors and share your ideas. You will also get access to streaming quotes, interactive charts, trades, portfolio, live options flow and more tools.
Chart Indicators:
• Bollinger Bands
• MACD (Moving Average Convergence Divergence)
• Parabolic SAR
• Stochastics
• RSI (Relative Strength Index)
• Moving Average
• RSI(SMA)
• RSI(EMI)
• Momentum
• MC
• Volume
• ADX
• OBV
• MFI
• Williams % Range
• ROC
• Volatility
• Standard Deviation
• Trend Line
• Elliott Wave

What is Sector Rotation?
Unsurprisingly, the business cycle influences the rotation of stock market sectors and industry groups. Certain sectors perform better than others during specific phases of the business cycle. Knowing the stage of the business cycle can help investors position themselves in the right sectors and avoid the wrong sectors.
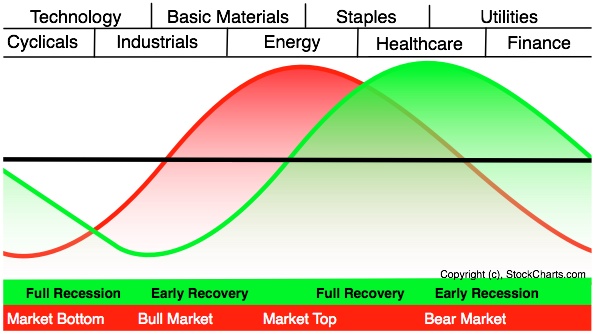
The graph above shows the economic cycle in green, the stock market cycle in red and the best performing sectors at the top. The green economic cycle corresponds to the business cycle shown above. The centerline marks the contraction/expansion threshold for the economy. Notice how the red market cycle leads the business cycle. The market turns up and crosses the centerline before the economic cycle turns. Similarly, the market turns down and crosses below the centerline ahead of the economic cycle.
Cyclicals, which is the same as the consumer discretionary sector, are the first to turn up in anticipation of a bottom in the economy. Technology stocks are not far behind. These two groups are the big leaders at the beginning of a bull run in the stock market.
The top of the market cycle is marked by relative strength in materials and energy. These sectors benefit from a rise in commodity prices and a rise in demand from an expanding economy. The tipping point for the market comes when leadership shifts from energy to consumer staples. This is a sign that commodity prices are starting to hurt the economy.
The market peak and downturn are followed by a contraction in the economy. At this stage, the Fed starts to lower interest rates and the yield curve steepens. Falling interest rates benefit debt-laden utilities and business at banks. The steepening yield curve also improves profitability at banks and encourages lending. Low interest rates and easy money eventually lead to a market bottom and the cycle repeats itself.
The two sector PerfCharts below show relative performance for the nine sector SPDRs near the 2007 peak and after the 2003 bottom. The S
Daily Candlestick Chart for GOVX
[img]stockcharts.com/c-sc/sc?s=GOVX
Book: An overall summary of a trader's positions.
Uptrend Line

An uptrend line has a positive slope and is formed by connecting two or more low points. The second low must be higher than the first for the line to have a positive slope. Uptrend lines act as support and indicate that net-demand (demand less supply) is increasing even as the price rises. A rising price combined with increasing demand is very bullish, and shows a strong determination on the part of the buyers. As long as prices remain above the trend line, the uptrend is considered solid and intact. A break below the uptrend line indicates that net-demand has weakened and a change in trend could be imminent.

Daily Candlestick Chart for GTRL
[img]stockcharts.com/c-sc/sc?s=GTRL
Bearish: The term "bearish" is used to describe that a person's, or group's, outlook on an asset is negative (i.e., that the asset will fall in value).
For example, Jane is "bearish" on the Swiss Franc, which means she thinks its value will go down in price.
Daily Candlestick Chart for NPFT
[img]stockcharts.com/c-sc/sc?s=NPFT
Daily Candlestick Chart for NTRR
[img]stockcharts.com/c-sc/sc?s=NTRR
Banking Institutions: Banking institutions cater to both the majority of commercial turnover and large amounts of speculative trading every day. The set of forex products offered by various banking institutions vary depending on their size. Some banks offer only spot exchange and currency forwards while the larger institutions offer currency options, currency swaps, currency futures, and option-dated currency forwards.
A large bank could trade billions of dollars daily, much of which is undertaken on behalf of customers, but some is conducted by proprietary desks, in other words: trading for the bank's own account.
A study by Greenwich Associates reveals that the top foreign exchange dealers are dominated by banking institutions such as Deutsche Bank, UBS, Citigroup, Barclays, and the Royal Bank of Scotland. The exact percentage of the daily global forex turnover accountable to banking institutions is not known but Deutsche Bank and UBS each comprise more than 10% of the market share. What’s for certain is that a sizeable part of daily forex trading is concentrated among the world’s top 10 foreign exchange banks. Around 90% of all foreign currency transactions are done by banks, companies, and individual traders.
Rocky Mountain High Brands Issues Chairman’s Open Letter To Shareholders
DALLAS, Jan. 03, 2018 (GLOBE NEWSWIRE) -- Rocky Mountain High Brands, Inc. (RMHB), a fully reporting consumer goods company specializing in brand development of health conscious, hemp-infused food and beverage products and a naturally high alkaline spring water, is pleased today to issue the following Chairman’s open letter to Shareholders from Michael Welch, Chairman, President and Chief Executive Officer of Rocky Mountain High Brands.
Dear RMHB Shareholders:
We are thrilled to mark the end of a challenging 2017 that ended on a very successful high note and are excited about our prospects for the coming year. This new year marks the start of our new, bold business strategy. It is our goal to transform Rocky Mountain High Brands to be the leader in the hemp-infused industry. We want to build on our legacy as one of the few publicly-traded, pure play hemp-infused brand companies in the U.S.
Our vision for Rocky Mountain High Brands is to become a major growth company by bringing healthy products to consumers that can improve the quality of their life and add value for our shareholders.
2017 Achievements:
Leadership. During 2017 our executive team identified a new burgeoning, fast-growing market: hemp-derived CBD products. To assist with the strategy and launch of this initiative, Rocky Mountain High Brands successfully recruited former Coca-Cola executive, John Blackington to lead the rollout of the new CBD products, and to oversee the strategic direction of the Company. John joined the Company in the fall of 2017 as Chief Commercialization Officer. The Company also recruited Michelle Krebsbach as its Director of Marketing. Mrs. Krebsbach has over twenty years of experience in marketing and advertising and has been involved in creating several brands from concept to shelf. Earlier in the year, noted beverage leader, Gerry David and serial marketer extraordinaire Kevin Harrington joined the Company as Consultants to the Board of Directors to advise us on this new CBD line, as well as general corporate and business matters.
Record Contract. In December 2017, Rocky Mountain High Brands announced a private label relationship that, upon completion, serves as the largest contract in our Company history. The Company entered into a three-year Master Manufacturer Agreement with CBD Alimentos SA de CV (“CBD”), a food and beverage distributor based in Mexico. During the term of the agreement, CBD has the exclusive right to distribute in Mexico the Company’s energy and soft drinks with hemp seed extract. In return, CBD will utilize the Company as its exclusive supplier of its hemp-infused drinks.
According to Reuters Health News on December 20, 2017, Mexico will legalize marijuana-based product sales in early 2018, which will pave the way for our products to be distributed and sold in Mexico (https://www.reuters.com/article/us-mexico-marijuana/mexico-to-legalize-marijuana-based-product-sales-next-year-idUSKBN1EF022.)
CBD’s initial purchase order will be 8,000,000 cans, worth up to an estimated $3,600,000 in revenue for the Company during late first quarter or early second quarter of 2018. The 2018 volume requirement is 16,000,000 cans including the initial purchase order. This translates to revenue for RMHB of up to an estimated $7,200,000 in 2018 under this contract.
Goals for 2018:
Rocky Mountain High Brands’ leadership team has outlined goals in four categories for 2018:
1. Products.
The Company plans to end 2018 with meaningful market share in the hemp-infused beverage and hemp-derived CBD product categories. With up to 16 million cans expected to be shipped to Mexico and a reformulation of our flagship energy drinks in the second quarter to improve on an already popular beverage offering, shareholders can expect 2018 to be a banner year for this segment.
New CBD Product Line
Leveraging our well-regarded brand, history, customer base, and channels, Rocky Mountain High Brands plans to release a series of hemp-derived CBD products that will carry our label and a CBD-focused name. Initial products include CBD-infused water, tinctures and other popular products. As confirmed by major organizations such as the National Institute of Health and World Health Organization, CBDs have been demonstrated to be useful to treat a number of major diseases and serious conditions while simultaneously having been found to be safe for use by consumers. Total hemp based sales in the U.S. are expected to grow from $1.0 billion in 2017 to over $1.8 billion by the end of 2020 – over $800 million in growth in just 3 years. We want Rocky Mountain High Brands to capture a significant part of this growth (https://www.hempbizjournal.com/market-size-hemp-industry-sales-grow-to-688-million-in-2016/.)
Eagle Spirit Water
The Company is implementing a new commercialization plan for Eagle Spirit Spring Water with the goal of having it placed in 250 major stores in Texas by the end of 2018. We want to make Eagle Spirit a strong part of our portfolio due to the continued growth of the water category, and Texas, our backyard, is a great place to start.
2. Financial Improvement
On the heels of the private label contract and new CBD offerings, the Company anticipates record revenue for calendar year 2018. In addition, management plans to work with CBD Alimentos SA de CV on a 2019 volume requirement to ensure meaningful quantities and sales beyond the initial contract. Additionally, shareholders will be pleased to learn that management has begun a debt reduction program in the first quarter of 2018 in order to improve the Company’s balance sheet. It should also be noted that effective as of January 1, 2018, Rocky Mountain High Brands has changed its fiscal year to a calendar year which will foster reporting that is more reflective of most publicly traded companies.
3. Business Development Execution
Management feels very confident in the prospects for 2018 and beyond. We believe that the Company is in a unique position to grow both organically and through strategic partnerships and acquisitions. We may, from time to time, explore opportunities that mesh with our short-term and long-term strategies and are potentially accretive to our financials. There is no assurance any transaction or agreement will be consummated, but we believe many favorable opportunities exist for the Company.
4. Investor Relations
Rocky Mountain High Brands plans to commence an investor visibility campaign in order to engage in broad-based investor awareness that we hope will result in the maximization of shareholder value. We believe that we have a great story to tell and we plan to keep you, our shareholders, apprised as we strive to achieve market leadership status in the hemp-based product market.
In Closing
On behalf of all of us at Rocky Mountain High Brands, I appreciate your investment in Rocky Mountain High Brands and your confidence in management. We recognize that your support is one of the primary reasons for our success to date and in the future. We feel great about our plan and prospects for growth this year and beyond.
Sincerely,
Michael R. Welch
Chairman, President and Chief Executive Officer
Rocky Mountain High Brands, Inc.
About Rocky Mountain High Brands:
ROCKY MOUNTAIN HIGH BRANDS, INC., (RMHB) is a publicly-traded brand management company. RMHB specializes in developing, manufacturing, marketing, and distributing high-quality, health conscious, hemp-infused products that span various “good for you categories”. The Company currently markets a lineup of four naturally flavored hemp-infused functional beverages (Citrus Energy, Black Tea, Mango Energy and Lemonade) and a low-calorie Coconut Lime Energy drink. In addition, the Company offers hemp-infused 2oz. Mango Energy Shots and Mixed Berry Energy Shots. RMHB also bottles and distributes a naturally high alkaline spring water under the name Eagle Spirit Spring Water. In 2018, the Company is expanding its product line to include CBD-infused waters and functional beverages, hemp and CBD-infused foods, a skin care line and nutraceuticals both containing CBD. The Company plans to expand its CBD offerings as new products are developed.
For corporate information please visit: RockyMountainHighBrands.com
For ordering information please visit: LiveRockyMountainHigh.com
For information on our high alkaline water visit: EagleSpiritWater.com
Visit us on Facebook: https://www.facebook.com/rockymountainhighbrands?fref=nf
Visit us on Twitter:
#GetYourHempOn
Contact:
Michael Welch, Chairman, President and Chief Executive Officer
michael@rockymountainhighbrands.com
Investor Relations:
Stuart T. Smith, CEO & President
SmallCapVoice.Com, Inc.
Phone: (512) 267-2430
Fax: (512) 267-2530
ssmith@smallcapvoice.com
Jack Eversull, President
The Eversull Group, Inc.
Phone: (972) 571-1624
Fax: (214) 469-2361
jack@theeversullgroup.com
Daily Candlestick Chart for EVPH
[img]stockcharts.com/c-sc/sc?s=EVPH
Dovish: Refers to the tone of language when describing a non-aggressive stance or viewpoint regarding a specific economic event or action. It’s often used when describing the economy or interest rates of a country.
Central bankers are described as "dovish" because they generally favor economic growth and employment over tightening interest rates.
Opposite of Hawkish (hawk).
Random Versus Non-Random
The great debate continues to rage between random walkers and non-random walkers. Two competing books best represent these theories. Originally written by Burton Malkiel in 1973, A Random Walk Down Wall Street has become a classic in investment literature. The book has been revised numerous times with new editions as recently as 2007. Malkiel, a Princeton Economist, argues that price movements are largely random and investors cannot outperform the major indices.

Written by Andrew W. Lo and A. Craig MacKinlay in 2001, the appropriately entitled A Non-Random Walk Down Wall Street provides the counter argument. Lo, an MIT Finance professor and MacKinlay, a Wharton Finance professor, argue that price movements are not all that random and that predictable components do indeed exist. Let the battle begin!
Descending Triangle: A descending triangle is a simple chart pattern used in technical analysis. The descending triangle is formed from two trendlines, one for high prices and one for lows. The upper trendline of the triangle is a descending trendline, while the lower trendline is a horizontal trendline. The resulting shape is a right triangle whose hypotenuse moves downward over time.
In order to confirm a descending triangle on an asset's chart, traders must note two reaction lows of similar magnitude and two reaction highs, each declining in price over time. There should be a reasonable amount of distance between each low or high. Descending triangles usually form and develop over a one to three month period.
The descending triangle is always a bearish pattern, indicating a strong sell signal. Prices on the upper trendline continue to decline, narrowing the triangle formation, until the level of support represented by the lower trendline is broken. When a level of support is broken, it becomes a level of resistance, confirming the overall downward trend of the asset's price over time.
Daily Candlestick Chart for APDN
[img]stockcharts.com/c-sc/sc?s=APDN
Price Scaling
There are two methods for displaying the price scale along the y-axis: arithmetic and logarithmic. An arithmetic scale displays 10 points (or dollars) as the same vertical distance no matter what the price level. Each unit of measure is the same throughout the entire scale. If a stock advances from 10 to 80 over a 6-month period, the move from 10 to 20 will appear to be the same distance as the move from 70 to 80. Even though this move is the same in absolute terms, it is not the same in percentage terms.
A logarithmic scale measures price movements in percentage terms. An advance from 10 to 20 would represent an increase of 100%. An advance from 20 to 40 would also be 100%, as would an advance from 40 to 80. All three of these advances would appear as the same vertical distance on a logarithmic scale. Most charting programs refer to the logarithmic scale as a semi-log scale, because the time axis is still displayed arithmetically.

The chart above uses the 4th-Quarter performance of VeriSign to illustrate the difference in scaling. On the semi-log scale, the distance between 50 and 100 is the same as the distance between 100 and 200. However, on the arithmetic scale, the distance between 100 and 200 is significantly greater than the distance between 50 and 100.
Key points on the benefits of arithmetic and semi-log scales:
• Arithmetic scales are useful when the price range is confined within a relatively tight range.
• Arithmetic scales are useful for short-term charts and trading. Price movements (particularly for stocks) are shown in absolute dollar terms and reflect movements dollar for dollar.
• Semi-log scales are useful when the price has moved significantly, be it over a short or extended time frame
• Trend lines tend to match lows better on semi-log scales.
• Semi-log scales are useful for long-term charts to gauge the percentage movements over a long period of time. Large movements are put into perspective.
• Stocks and many other securities are judged in relative terms through the use of ratios such as PE, Price/Revenues and Price/Book. With this in mind, it also makes sense to analyze price movements in percentage terms.
Deficit: Shortfall in the balance of trade, balance of payments, or government budgets.
Daily Candlestick Chart for BULM
[img]stockcharts.com/c-sc/sc?s=BULM
Arbitrage: Taking an equal and opposite position at the same time to benefit from small price differences between related markets.
Daily Candlestick Chart for NILA
[img]stockcharts.com/c-sc/sc?s=NILA
Contract: An agreement of trade.
Daily Candlestick Chart for RNGG
[img]stockcharts.com/c-sc/sc?s=RNGG
Bank of Japan (BOJ) Monetary Policy Meeting and Announcement: Release schedule : No set time, usually between 2:00 and 4:00 (GMT); monthly, in the middle of the month
Source of report : Bank of Japan
Web Address : http://www.boj.or.jp/en/index.htm
Address of Release : http://www.boj.or.jp/en/theme/seisaku/kettei/index.htm
Schedule of Meetings : http://www.boj.or.jp/en/theme/seisaku/index.htm
Pictorial Price History
Even if you are a tried and true fundamental analyst, a price chart can offer plenty of valuable information. The price chart is an easy to read historical account of a security's price movement over a period of time. Charts are much easier to read than a table of numbers. On most stock charts, volume bars are displayed at the bottom. With this historical picture, it is easy to identify the following:
• Reactions prior to and after important events.
• Past and present volatility.
• Historical volume or trading levels.
• Relative strength of a stock versus the overall market.
Daily Candlestick Chart for MSVS
[img]stockcharts.com/c-sc/sc?s=MSVS
Derivative: A financial contract that depends on the commodity's value and properties.
Psychological Factors Connected to Irrational Exuberance
Robert Shiller asserts that there is a human tendency towards "overconfidence in ones beliefs". Moreover, people often rely on intuition when making investment decisions. The decision process is not based on carefully considered facts backed by numbers and evidence. Instead, investors make investment decisions based on the opinion of others. This stems from the need to conform. Investors make decision based on "good stories" or stories that seem logical. Because people get their information from the same sources, there is little or no evidence of independent behavior. Instead, individuals getting the same information react the same way to produce a herd mentality.
Daily Candlestick Chart for CTLE
[img]stockcharts.com/c-sc/sc?s=CTLE
Asset: An item that has exchange value.
Dollar and Commodities
While the Dollar and currency markets are part of intermarket analysis, the Dollar is a bit of a wild card. As far as stocks are concerned, a weak Dollar is not bearish unless accompanied by a serious advance in commodity prices. Obviously, a big advance in commodities would be bearish for bonds. By extension, a weak Dollar is also generally bearish for bonds. A weak Dollar acts an economic stimulus by making US exports more competitive. This benefits large multinational stocks that derive a large portion of their sales overseas.

What are the effects of a rising Dollar? A countries currency is a reflection of its economy and national balance sheet. Countries with strong economies and strong balance sheets have stronger currencies. Countries with weak economies and big debt burdens are subject to weaker currencies. A rising Dollar puts downward pressure on commodity prices because many commodities are priced in Dollars, such as oil. Bonds benefit from a decline in commodity prices because this reduces inflationary pressures. Stocks can also benefit from a decline in commodity prices because this reduces the costs for raw materials.
Daily Candlestick Chart for LGBS
[img]stockcharts.com/c-sc/sc?s=LGBS
Directional Movement Index: The directional movement index (or DMI) was developed by J. Welles Wilder in order to determine the overall direction of a given asset's prices. DMI is composed of two lines, one representing positive direction ( DI) and one representing a negative direction (-DI).
To calculate the DMI, a trader first calculates the difference between the current high and the previous high (HiDiff), as well as the difference between the previous low and the current low (LowDiff). HiDiff and LowDiff are then compared. If HiDiff is greater in value, a variable DMI is set to HiDiff and a variable -DMI is set to 0. If LowDiff is greater, -DMI is set to LowDiff and DMI is set to 0. If the two values are equal, or if no trend is seen in either highs or lows, both values are set to 0. A calculation known as the Welles Summation is then performed on both DMI and -DMI, resulting in two numbers: DI and -DI, both ranging from 0 to 100. The directional movement index consists of these two points.
The DMI can be used in strongly trending markets to determine strong buy and sell signals. The DMI generates a strong buy signal when DI crosses above -DI at any point and generates a strong sell signal when DI crosses below -DI at any point. In non-trending markets, this indicator becomes less useful.
The directional movement index is the basic value from which the average directional index (or ADX) is derived.
Daily Candlestick Chart for MRNJ
[img]stockcharts.com/c-sc/sc?s=MRNJ
Accumulative Swing Index: The accumulative swing index, or ASI, is a tool developed by J. Welles Wilder to measure the breakout potential of a given market.
The ASI takes the form of a number from 100 to -100, with positive values indicating an upward trend and negative values indicating a downward trend. Once calculated, the ASI can be charted in conjunction with a candlestick chart. The chief value of the ASI is that it's susceptible to the same technical analysis tools as a candlestick chart, allowing traders to use trendlines, wedges, triangles and other tools in order to determine support and resistance levels. However, ASI charts are much simpler and smoother than candlestick charts, making them both easier to analyze and less susceptible to indicating false breakouts. If the absolute value of the ASI for a given day exceeds the absolute value of the ASI at the time of a previous breakout, a new breakout from the trend is imminent, and traders can take positions accordingly.
The ASI is based on Wilder's swing index, which is an extremely complex calculation that incorporates high, low and close prices for an asset along with numerous other variables, some of them specific to certain kinds of markets. On its own, the swing index isn't particularly useful as a predictive tool, but the swing indexes for several successive days can be incorporated by another calculation into the ASI, which fulfills Wilder's original intention for the measure. Full instructions for calculating the swing index and ASI are available in Wilder's "New Concepts in Technical Trading Systems", and a number of popular pieces of trading software are able to calculate the ASI automatically.
Daily Candlestick Chart for DKGR
[img]stockcharts.com/c-sc/sc?s=DKGR
How Are Charts Formed? Line Chart

Some investors and traders consider the closing level to be more important than the open, high or low. By paying attention to only the close, intraday swings can be ignored. Line charts are also used when open, high and low data points are not available. Sometimes only closing data are available for certain indices, thinly traded stocks and intraday prices.
How Are Charts Formed? Bar Chart
Perhaps the most popular charting method is the bar chart. The high, low and close are required to form the price plot for each period of a bar chart. The high and low are represented by the top and bottom of the vertical bar and the close is the short horizontal line crossing the vertical bar. On a daily chart, each bar represents the high, low and close for a particular day. Weekly charts would have a bar for each week based on Friday's close and the high and low for that week.

Bar charts can also be displayed using the open, high, low and close. The only difference is the addition of the open price, which is displayed as a short horizontal line extending to the left of the bar. Whether or not a bar chart includes the open depends on the data available

Bar charts can be effective for displaying a large amount of data. Using candlesticks, 200 data points can take up a lot of room and look cluttered. Line charts show less clutter, but do not offer as much detail (no high-low range). The individual bars that make up the bar chart are relatively skinny, which allows users the ability to fit more bars before the chart gets cluttered. If you are not interested in the opening price, bar charts are an ideal method for analyzing the close relative to the high and low. In addition, bar charts that include the open will tend to get cluttered quicker. If you are interested in the opening price, candlestick charts probably offer a better alternative.
How Are Charts Formed? Candlestick Chart
Originating in Japan over 300 years ago, candlestick charts have become quite popular in recent years. For a candlestick chart, the open, high, low and close are all required. A daily candlestick is based on the open price, the intraday high and low, and the close. A weekly candlestick is based on Monday's open, the weekly high-low range and Friday's close.

Many traders and investors believe that candlestick charts are easy to read, especially the relationship between the open and the close. White (clear) candlesticks form when the close is higher than the open and black (solid) candlesticks form when the close is lower than the open. The white and black portion formed from the open and close is called the body (white body or black body). The lines above and below are called shadows and represent the high and low.
How Are Charts Formed? Point
Chartest: One who uses charts and graphs to trade. Referred to as a technical trader.
Daily Candlestick Chart for DRWN
[img]stockcharts.com/c-sc/sc?s=DRWN
Ascending Trend Channel: An ascending trend channel is a basic chart pattern used in technical analysis.
Ascending trend channels are a useful tool due to their ability to predict overall changes in trend. As long as prices remain within the ascending trend channel, the upward trend in price can be expected to continue. As soon as prices exceed either trendline forming the channel, however, a strong signal either to buy or to sell is generated. A break through the upper trendline generates a strong buy signal, while a break through the lower trendline generates a strong sell signal.
Daily Candlestick Chart for AQOGF
[img]stockcharts.com/c-sc/sc?s=AQOGF
|
Followers
|
3289
|
Posters
|
|
|
Posts (Today)
|
0
|
Posts (Total)
|
2804248
|
|
Created
|
08/22/10
|
Type
|
Free
|
| Moderator Nilbud | |||
| Assistants mick ManicTrader PhotoChick Kirimi $Pistol Pete$ | |||
   Investor Hub Alerts: Sign up for 'STOCKGOODIES PLAYS OF THE WEEK ' E-Mail List Investor Hub Alerts: Sign up for 'STOCKGOODIES PLAYS OF THE WEEK ' E-Mail ListUPDATE; 5-1-22 courtesy of charting /\ wit tweezer top calls /\ Tony @Montana_Trades Really good study sheet on Candlestick Patterns [-chart]pbs.twimg.com/media/FRn8188XMAAdZvk?format=jpg&name=small[/chart] 

02-07-2021
|
|
Posts Today
|
0
|
|
Posts (Total)
|
2804248
|
|
Posters
|
|
|
Moderator
|
|
|
Assistants
|
| Volume | |
| Day Range: | |
| Bid Price | |
| Ask Price | |
| Last Trade Time: |


