 News
News  Market Data
  Discover
Support: 888-992-3836
Copyright © 2023 InvestorsHub Inc.


Register for free to join our community of investors and share your ideas. You will also get access to streaming quotes, interactive charts, trades, portfolio, live options flow and more tools.
Daily Candlestick Chart for ZMRK
[img]stockcharts.com/c-sc/sc?s=ZMRK
Bid/ask spread: The difference between the bid and offer price

Daily Candlestick Chart for AERO
[img]stockcharts.com/c-sc/sc?s=AERO
Armenian Drams: The currency of Armenia. Currency code (AMD)
Daily Candlestick Chart for PSID
[img]stockcharts.com/c-sc/sc?s=PSID
Double Bottom: A Double Bottom is a form of chart pattern used in technical analysis. This pattern is characterized by a distinct drop in price, followed by a slight reversal (or recovery) with a second drop occurring soon after to either the same or similar level as the first, before another, significant recovery so that the chart appears to take on the form of the letter 'W'.
The Double Bottom, along with its counterpart, the Double Top, is easily one of the most recognizable chart patterns. While both are reliable reversal patterns, highly indicative of chances in the market, the bullish Double Bottom reflects very strong levels of support and often indicates a strong change of trend.
The double low points are considered to be support levels, with the resistance level measured at the widest point of the 'W' formation. When the rise following the second low breaks the resistance point generally the rise will continue sharply, with these reversal trends garnering more reward following extended downtrends.
It is normally considered that the best entry point on a double bottom formation is around the secondary resistance level, which when broken tends to indicate a the confirmation of the price reversal.
Daily Candlestick Chart for EMPM
[img]stockcharts.com/c-sc/sc?s=EMPM
Broadening Formation: A broadening formation is an example of a consolidation pattern and a highly useful tool in the prediction of the likelihood of a reversal in the direction of a current trend. When found in an uptrend it indicates not a continuation of that trend, but a near-term reversal of the price action.
The broadening formation occurs when the fluctuation within the price produces a series of higher highs and of lower lows that steadily widen over time and are generally thought to be found only in found in topping formations where they are considered to be the result of unrealistic expectations of bullish investors.
Unlike the majority of other consolidation patterns, broadening formations feature increasingly wide ranges and are subject to much greater levels of volatility as time passes. Volume levels increase as the share price rises, which although normally indicates a bullish position rallies in this instance usually prove to be very short lived and the following declines are prone to decimating former support levels leading to an eventual collapse.
Commission: A transaction fee charged by a broker.
Form NT 10-Q ~ SEC Filings Explained
Notice under Rule 12b25 of inability to timely file all or part of a form 10-Q or 10-QSB

Form N-4 ~ SEC Filings Explained
Initial registration statement on Form N-4 for separate accounts (unit investment trusts)
United States Natural Gas (NYSE:UNG)
Funds can also provide a way to invest in natural resources. This investments gives a replication of natural gas prices , after expenses. It will try to follow the prices of natural gas by buying futures contracts on natural gas in the coming months. As with all funds you need to keep an eye on the total expense ratio before investing.
ETFs offer public investors an undivided interest in a pool of securities and other assets and thus are similar in many ways to traditional mutual funds, except that shares in an ETF can be bought and sold throughout the day like stocks on a securities exchange through a broker-dealer. Unlike traditional mutual funds, ETFs do not sell or redeem their individual shares at net asset value, or NAV. Instead, financial institutions purchase and redeem ETF shares directly from the ETF, but only in large blocks, varying in size by ETF from 25,000 to 200,000 shares, called "creation units". Purchases and redemptions of the creation units generally are in kind, with the institutional investor contributing or receiving a basket of securities of the same type and proportion held by the ETF, although some ETFs may require or permit a purchasing or redeeming shareholder to substitute cash for some or all of the securities in the basket of assets.[4]
The ability to purchase and redeem creation units gives ETFs an arbitrage mechanism intended to minimize the potential deviation between the market price and the net asset value of ETF shares. Existing ETFs have transparent portfolios, so institutional investors will know exactly what portfolio assets they must assemble if they wish to purchase a creation unit, and the exchange disseminates the updated net asset value of the shares throughout the trading day, typically at 15-second intervals.[4]
If there is strong investor demand for an ETF, its share price will (temporarily) rise above its net asset value per share, giving arbitrageurs an incentive to purchase additional creation units from the ETF and sell the component ETF shares in the open market. The additional supply of ETF shares reduces the market price per share, generally eliminating the premium over net asset value. A similar process applies when there is weak demand for an ETF and its shares trade at a discount from net asset value.
In the United States, most ETFs are structured as open-end management investment companies (the same structure used by mutual funds and money market funds), although a few ETFs, including some of the largest ones, are structured as unit investment trusts. ETFs structured as open-end funds have greater flexibility in constructing a portfolio and are not prohibited from participating in securities lending programs or from using futures and options in achieving their investment objectives.[5]
Under existing regulations, a new ETF must receive an order from the Securities and Exchange Commission, or SEC, giving it relief from provisions of the Investment Company Act of 1940 that would not otherwise allow the ETF structure. In 2008, however, the SEC proposed rules that would allow the creation of ETFs without the need for exemptive orders. Under the SEC proposal, an ETF would be defined as a registered open-end management investment company that:
? Issues (or redeems) creation units in exchange for the deposit (or delivery) of basket assets the current value of which is disseminated per share by a national securities exchange at regular intervals during the trading day;
? Identifies itself as an ETF in any sales literature;
? Issues shares that are approved for listing and trading on a securities exchange;
? Discloses each business day on its publicly available web site the prior business day's net asset value and closing market price of the fund's shares, and the premium or discount of the closing market price against the net asset value of the fund's shares as a percentage of net asset value; and
? Either is an index fund, or discloses each business day on its publicly available web site the identities and weighting of the component securities and other assets held by the fund.[4]
The SEC rule proposal would allow ETFs either to be index funds or to be fully transparent actively managed funds. Historically, all ETFs in the United States have been index funds. In 2008, however, the SEC began issuing exemptive orders to fully transparent actively managed ETFs. The first such order was to PowerShares Actively Managed Exchange-Traded Fund Trust,[6] and the first actively managed ETF in the United States was the Bear Stearns Current Yield Fund, a short-term income fund that began trading on the American Stock Exchange under the symbol YYY on 25 March 2008.[7] The SEC rule proposal indicates that the SEC may still consider future applications for exemptive orders for actively managed ETFs that do not satisfy the proposed rule's transparency requirements.[4]
Some ETFs invest primarily in commodities or commodity-based instruments, such as crude oil and precious metals. Although these commodity ETFs are similar in practice to ETFs that invest in securities, they are not "investment companies" under the Investment Company Act of 1940.[4]
Publicly traded grantor trusts, such as Merrill Lynch's HOLDRs securities, are sometimes considered to be ETFs, although they lack many of the characteristics of other ETFs. Investors in a grantor trust have a direct interest in the underlying basket of securities, which does not change except to reflect corporate actions such as stock splits and mergers. Funds of this type are not "investment companies" under the Investment Company Act of 1940.[8]
As of 2009, there were approximately 1,500 exchange-traded funds traded on US exchanges.[9] This count uses the wider definition of ETF, including HOLDRs and closed-end funds.
History of ETF’s
ETFs had their genesis in 1989 with Index Participation Shares, an S
Form N-PX ~ SEC Filings Explained
Annual Report of Proxy Voting Record of Registered Management Investment Companies
Form S-6 ~ SEC Filings Explained
Initial registration statement filed on Form S-6 for unit investment trusts
Doji Star
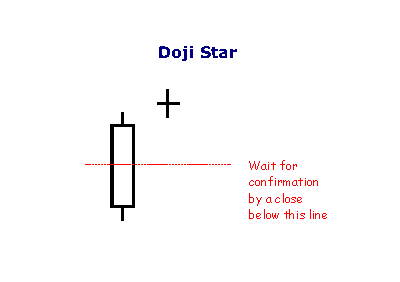
A Doji Star is weaker than the Morning or Evening Star: the doji represents indecision. The doji star requires confirmation from the next candlestick closing in the bottom half of the body of the first candlestick.
Form N-8B-2 ~ SEC Filings Explained
Initial registration statement for unit investment trusts
BULLISH STICK SANDWICH
The Bullish Stick Sandwich Pattern is characterized by consecutive higher opens for three days, but results in an eventual close equal to the first day's close. It may warn that prices are now finding a support price. We may then see a reversal from this support level.

Recognition Criteria:
1. Market is characterized by downtrend.
2. We see a Black Closing Marubozu in the first day.
3. Then we see a white candlestick, which is above the close of the first day.
4. Then we again see a Black Closing Marubozu characterized with a close equal to the close of the first day.
Explanation:
In the Bullish Stick Sandwich Pattern, there is a downtrend going on. Then prices open higher on the next trading day and they reach to higher levels all day, closing at or near the high. This bullish act suggests that the previous downtrend may now reverse implying that the shorts need protection. The next day, prices open at a higher level leading some shorts to cover their positions initially but then the prices start moving lower to close at the same price as two days ago. This pattern shows that the market is finding a support level and now the trend may reverse from this support level.
Important Factors:
A confirmation on the fourth day is required to be sure that the downtrend is reversed. Confirmation may be in the form of a white candlestick, a large gap up or a higher close on the fourth day.
Index ETFs
Most ETFs are index funds that attempt to replicate the performance of a specific index. Indexes may be based on stocks, bonds, commodities, or currencies. An index fund seeks to track the performance of an index by holding in its portfolio either the contents of the index or a representative sample of the securities in the index.[5] As of June 2012, in the United States, about 1200 index ETFs exist, with about 50 actively managed ETFs. Index ETF assets are about $1200 billion, compared with about $7 billion for actively managed ETFs.[18] Some index ETFs, known as leveraged ETFs or inverse ETFs, use investments in derivatives to seek a return that corresponds to a multiple of, or the inverse (opposite) of, the daily performance of the index.[19]
Some index ETFs invest 100% of their assets proportionately in the securities underlying an index, a manner of investing called "replication". Other index ETFs use "representative sampling", investing 80% to 95% of their assets in the securities of an underlying index and investing the remaining 5% to 20% of their assets in other holdings, such as futures, option and swap contracts, and securities not in the underlying index, that the fund's adviser believes will help the ETF to achieve its investment objective. For index ETFs that invest in indices with thousands of underlying securities, some index ETFs employ "aggressive sampling" and invest in only a tiny percentage of the underlying securities
Actively managed ETFs
Actively managed ETFs (AMETFs) are quite recent in the United States. The first one was offered in March 2008, but it was liquidated in October 2008. The actively managed ETFs approved to date are fully transparent, publishing their current securities portfolios on their web sites daily. However, the SEC has indicated that it is willing to consider allowing actively managed ETFs that are not fully transparent in the future.[4]
The fully transparent nature of existing ETFs means that an actively managed ETF is at risk from arbitrage activities by market participants who might choose to front run its trades[citation needed]. The initial actively traded equity ETFs have addressed this problem by trading only weekly or monthly, however today, actively managed ETFs trade at the discretion of the manager and to date, there have been no instances of front running. Actively traded debt ETFs, which are less susceptible to front-running, trade their holdings more frequently.[30]
Actively managed ETFs have grown faster in their first three years of existence than index ETFs did in their first three years of existence. However, as track records develop, many see actively managed ETFs as a significant competitive threat to actively managed mutual funds
Leveraged ETFs
Leveraged exchange-traded funds (LETFs), or simply leveraged ETFs, are a special type of ETF that attempt to achieve returns that are more sensitive to market movements than non-leveraged ETFs.[33] Leveraged index ETFs are often marketed as bull or bear funds. A leveraged bull ETF fund might for example attempt to achieve daily returns that are 2x or 3x more pronounced than the Dow Jones Industrial Average or the S
Tweezer Tops

The Tweezer Top formation is a bearish reversal pattern seen at the top of uptrends.
Tweezer Top formation consists of two candlesticks:
Bullish Candle (Day 1)
Bearish Candle (Day 2)
Sometimes Tweezer Tops have three candlesticks.
A bearish Tweezer Top occurs during an uptrend when bulls take prices higher, often closing the day off near the highs (a bullish sign). However, on the second day, how traders feel (i.e. their sentiment) reverses completely. The market opens and goes straight down, often eliminating the entire gains of Day One.

On Day 1, the bulls were in charge of the Russell 2000 E-mini. On Day 2, however, the bulls began the day trying to make a new high, but were rejected by the overhead resistance created by the prior day's highs. The market then sank quickly only to recover halfway by the end of the close on Day 2. Day 3 opened with a spectacular gap up, but the bulls were promptly rejected by the bears at the now established resistance line. The Russell 2000 E-mini then fell for the rest of the day. Many classic chartists will recognize this triple Tweezer Top as a Double Top formation (see: Double Top).
The Tweezer Top and Bottom reversal pattern is extremely helpful because it visually indicates a transfer of power and sentiment from the bulls and the bears. Of course other technical indicators should be consulted before making a buy or sell signal based on the Tweezer patterns.
Form 10-12B, 10-12B/A ~ SEC Filings Explained
Initial general form for registration of a class of securities pursuant to section 12(b) (and amendment thereto)
SEC Filings Explained ~ S-1
Form S-1 is an SEC filing used by public companies to register their securities with the U.S. Securities and Exchange Commission (SEC) as the "registration statement by the Securities Act of 1933". The S-1 contains the basic business and financial information on an issuer with respect to a specific securities offering. Investors may use the prospectus to consider the merits of an offering and make educated investment decisions. A prospectus is one of the main documents used by an investor to research a company prior to an initial public offering (IPO). Other less detailed registration forms, such as Form S-3 may be used for certain registrations.
Every business day from 10 to 5, S-1 forms are filed with the SEC's EDGAR filing system, the required filing format of the U.S. Securities and Exchange Commission. However many of these (typically 30% to 90%) are of the related Form S-1/A, which is used for filing amendments to a previously filed Form S-1.
The S-1 form has an OMB Approval Number of 3234-0065 and the online form is only 8 pages. However the simplicity of the form's design is belied by theOMB Office's figure of the Estimated Average Burden - 972.32 hours. This means that long time and effort has been used to collect and display information about the filer (a corporate registrant or new registrant who intends to offer securities). The S-1 form requires that the registrant provide information from diverse sources and incorporate this information using many rules or regulations, such as General Rules and Regulations under the Securities Act, Regulation C,Regulation S-K and Regulation S-X.
Dark Cloud
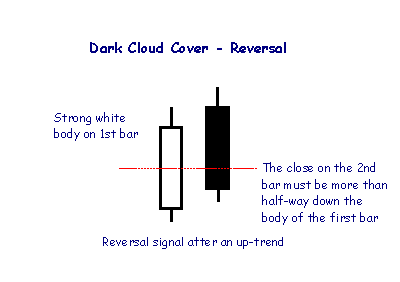
A Dark Cloud pattern encountered after an up-trend is a reversal signal, warning of "rainy days" ahead.
THREE STAR IN THE SOUTH
We see three consecutive black candlesticks during a downtrend. These candlesticks show that each day is consecutively weaker in a bearish sense and possibly some buying is occurring. Daily small rallies keep the market’s lows from reaching that of the first day. These indications suggest that tide is turning in a bullish direction.

Recognition Criteria:
1. Market is characterized by downtrend.
2. We see a long Black Opening Marubozu in the first day characterized by a long lower shadow just like a Hammer.
3. Then we see a Black Opening Marubozu on the second day similar to the first day however smaller in body with a low above the first day’s low.
4. We finally see a small Black Marubozu on the third day that lies within the second day’s trading range.
Explanation:
The Bullish Three Stars in the South Pattern shows a slowly deteriorating downtrend, which is characterized by less and less daily price movement and consecutively higher lows. Buying enthusiasm is reflected by the long lower shadow of the first day. The next day opens at a higher level, trades lower, but its low is not lower than the previous day's low. This second day also closes off its low. Then we see a black Marubozu, which is engulfed by the previous day's range on the third day. Higher lows cause uneasiness among shorts. The last day of the pattern reflects market indecision, with hardly any price movement. Shorts are now ready to cover positions if they see anything in the upside. Everything points out that the tide is slowly turning toward the bull side.
Important Factors:
A confirmation on fourth day is required to be sure that the downtrend has reversed. This confirmation may be in the form of a white candlestick, a large gap up or a higher close on the fourth day.
Form TA-1 ~ SEC Filings Explained
Application for registration as a transfer agent filed pursuant to the Securities Exchange Act of 1934
Definitions For The Fifth Letter Of Ticker Symbols
Have you ever wondered what that fifth letter at the end of the stock symbol is? It signifies that the issuer may have additional circumstances involved with the stock. Most recognizable is the infamous "E".
Complete "Letter" list enclosed below. You may want to print it out for your own reference.
The Eligibility Rule protects investors by ensuring that they have access to companies current financial information when considering investments in OTCBB-eligible securities.
Nasdaq will continue to monitor the filing status of all OTCBB issuers. In the event of a filing delinquency, Nasdaq will append the trading symbol(s) of the delinquent issuer's security with an "E". The fifth character "E" will be removed from the symbol once Nasdaq receives notification that the security meets the requirements of the Eligibility Rule. After 30 days (60 days for non-SEC filers), if Nasdaq has not been notified that the appropriate filing has been made with the issuer's regulatory authority, the issuer's security will be removed from the OTCBB.
Code: Meaning
A: Class A.
B: Class B.
C: Exempt from Nasdaq listing requirements for a limited period of time.
D: A new issue of an existing stock. (Often the result of a reverse split.)
E: Delinquent in required filings with the SEC as determined by the NASD.
F: Foreign.
G: First Convertible Bond.
H: Second Convertible Bond, same company.
I: Third Convertible Bond, same company.
J: Voting.
K Non-voting.
L: Miscellaneous situations such as foreign preferred, preferred when-issued, a second class of units, a third class of warrants, or a sixth class of preferred stock.
M: Fourth preferred, same company.
N: Third preferred, same company.
O: Second preferred, same company.
P: First preferred.
Q: In bankruptcy proceedings.
R: Rights.
S: Beneficial interest.
T: With warrants or with rights.
U: Units.
V: When-issued and when-distributed.
W: Warrants.
X: Mutual Fund.
Y: ADR (American Depositary Receipts).
Z: Miscellaneous situations such as a second class of warrants, a fifth class of preferred stock, a stub, a foreign preferred when-issued, or any unit, receipt, or certificate representing a limited partnership interest."
Form N-23C-2 ~ SEC Filings Explained
Notice by closed-end investment companies of intention to call or redeem their own securities
Form N-14/A ~ SEC Filings Explained
Initial registration statement for open-end investment company (Amendment)
Form TA-2 ~ SEC Filings Explained
Annual report of transfer agent activities filed pursuant to the Securities Exchange Act of 1934
SEC Filings Explained ~ Form 3
Form 3 is an SEC filing filed with the US Securities and Exchange Commission to indicate a preliminary insider transaction by an officer, director, or beneficial (10%) owner of the company's securities. These are typically seen after a company IPOs when insiders make their first transactions. After a Form 3 is filed, future filings of the same nature are filed under Form 4 (standard disclosure) or Form 5 (annual disclosure).
BEARISH DELIBERATION
The Bearish Deliberation Pattern is a derivative of the Bearish Three White Soldiers Pattern. This pattern also shows a weakness similar to the Bearish Advance Block Pattern since it becomes weaker in a short period of time. However here the weakness occurs all at once on the third day. The small third body of the pattern shows that the rally is losing strength and a reversal is possible.
Recognition Criteria:
1. Market is characterized by uptrend.
2. We see long white bodies in the first and second days.
3. The second day has a higher close than the first day.
4. Then the third day opens near the second day's close.
5. The third day is typically a short white candlestick, a spinning top or a star that gaps above the second day.
Explanation:
The Bearish Deliberation Pattern appears after a sustained upward move and is suggestive of the fact that the rally is losing strength and a reversal is possible. The formation is a proof that the bulls’ strength is at least temporarily exhausted.
Important Factors:
The last small white candlestick may show a gap away from the long white body, thus becoming a star, or it can be riding on the shoulder of the long white real body.
The Bearish Deliberation Pattern is not normally a top reversal pattern but it has potential to precede a meaningful price decline. This pattern is more important at higher price levels. It must be used to liquidate long positions but it is yet too early for short positions.
A confirmation on fourth day is required to confirm that the uptrend has reversed. This may be in the form of a black candlestick, a large gap down or a lower close on the fourth day.
Form N-30B-2 ~ SEC Filings Explained
Periodic and interim reports mailed to investment company shareholders
Commodity ETFs or ETCs
Commodity ETFs (ETCs or CETFs) invest in commodities, such as precious metals and futures. Among the first commodity ETFs were gold exchange-traded funds, which have been offered in a number of countries. The idea of a Gold ETF was first officially conceptualised by Benchmark Asset Management Company Private Ltd in India when they filed a proposal with the SEBI in May 2002.[24] The first gold exchange-traded fund was Gold Bullion Securities launched on the ASX in 2003, and the firstsilver exchange-traded fund was iShares Silver Trust launched on the NYSE in 2006. As of November 2010 a commodity ETF, namely SPDR Gold Shares, was the second-largest ETF by market capitalization.[25]
However, generally commodity ETFs are index funds tracking non-security indices. Because they do not invest in securities, commodity ETFs are not regulated as investment companies under the Investment Company Act of 1940 in the United States, although their public offering is subject to SEC review and they need an SEC no-action letter under the Securities Exchange Act of 1934. They may, however, be subject to regulation by the Commodity Futures Trading Commission.[26][27]
Exchange-traded commodities (ETCs) are investment vehicles (asset backed bonds, fully collateralised) that track the performance of an underlying commodity index including total return indices based on a single commodity. Similar to ETFs and traded and settled exactly like normal shares on their own dedicated segment, ETCs have market maker support with guaranteed liquidity, enabling investors to gain exposure to commodities, on-exchange, during market hours.
The earliest commodity ETFs (e.g., GLD and SLV) actually owned the physical commodity (e.g., gold and silver bars). Similar to these are NYSE: PALL (palladium) and NYSE: PPLT (platinum). However, most ETCs implement a futures tradingstrategy, which may produce quite different results from owning the commodity.
Commodity ETFs trade just like shares, are simple and efficient and provide exposure to an ever-increasing range of commodities and commodity indices, including energy, metals, softs and agriculture. However, it is important for an investor to realize that there are often other factors that affect the price of a commodity ETF that might not be immediately apparent. For example, buyers of an oil ETF such as USO might think that as long as oil goes up, they will profit roughly linearly. What isn't clear to the novice investor is the method by which these funds gain exposure to their underlying commodities. In the case of many commodity funds, they simply roll so-called front-month futures contracts from month to month. This does give exposure to the commodity, but subjects the investor to risks involved in different prices along the term structure, such as a high cost to roll
Form 18-K, 18-K/A ~ SEC Filings Explained
Annual report for foreign governments (and amendment thereto)
WHITE SPINNING TOP
The White Spinning Top is a single candlestick pattern. Its shape is a small white body with upper and lower shadows that have a greater length than the body's length.
Recognition Criteria:
1. The real body of the pattern is white and small.
2. The upper and lower shadows are longer than the real body's length.
Explanation:
The market moves higher and then sharply lower, or vice versa. It then closes above the opening price creating a white body. This represents complete indecision between the bulls and the bears. The actual length of the shadows is not important. The small body relative to the shadows is what makes the spinning top.
Important Factors:
If a White Spinning Top is observed after a long rally or a long white candlestick, this implies weakness among the bulls and it is a warning about a potential change or interruption in trend.
If a White Spinning Top is observed after a long decline or a long black candlestick, this implies weakness among the bears and it is a warning about a potential change or interruption in trend.
Like most other single candlestick patterns, the White Spinning Top has low reliability. It reflects only one day's trading and can be interpreted both as a continuation and a reversal pattern. This candlestick needs to be used with other candlesticks for a healthier confirmation of a trend.
BULLISH MATCHING LOW
Bullish Matching Low Pattern occurs when two black days appear with equal closes in a downtrend. The pattern is suggestive of a short-term support, and it may cause a reversal on the next day of trading.
Recognition Criteria:
1. The market moves in downtrend.
2. We then see a long black candlestick on the first day.
3. Second day follows with another black candlestick whose closing price is equal or extremely close to the closing price of the first day.
Explanation:
Market continues to move down as evidenced by first black candlestick. Next day; prices open at a higher level, they then continue to go up during the day but the day closes at a price which is equal to the closing price of the previous day. This pattern suggests a short-term support. Shorts should be aware of this fact. If they ignore Bullish Matching Low Pattern as a possible reversal signal, they may pay for it soon. Two days closing at the same price is indicative of short-term support and this support may be followed by a reversal on the next day of trading.
Important Factors:
The reversal of downtrend requires a confirmation on the third day. The confirmation of the trend reversal may be in the form of a white candlestick, a large gap up or a higher close on the next trading day (on the third day).
CONCEALING BABY SWALLOW
This Bullish pattern is highlighted by two consecutive Black Marubozu. They are characterized by the fact that a gapping black candlestick trades into the body of the previous day and it is seen during a downtrend. Then there is another Black Marubozu on the third day showing sale of positions since it closes at a new low. However this may give incentive to the shorts to cover their positions implying that a bullish reversal is now possible.

Recognition Criteria:
1. Market is characterized by downtrend.
2. We see two consecutive Black Marubozu in the first and second days.
3. Then we see a black candlestick on the third day opening with a downward gap but trading into the body of the second day and it is characterized by a long upper shadow.
4. Finally we see another Black Marubozu on the fourth day that completely engulfs the candlestick of the third day including the shadow.
Explanation:
Two black Marubozu show that downtrend is continuing to the satisfaction of the bears. On the third day, we see a downward gap further confirming the downtrend. However, prices on the third day start going above the close of the previous day causing some doubts about the bearish direction even though the day closes at or near its low. The next day shows us a significantly higher gap in the opening. After the opening, however, prices again go down closing at a new low. This last day may be interpreted as a good chance for the short-sellers to cover their short positions.
Candlestick Charts
The Japanese have been using candlestick charts since the 17th century to analyze rice prices. Candlesticks were introduced into modern technical analysis by Steve Nison in his book Japanese Candlestick Charting Techniques.
Candlesticks contain the same data as a normal bar chart but highlight the relationship between opening and closing prices. The narrow stick represents the range of prices traded during the period (high to low) while the broad mid-section represents the opening and closing prices for the period.
If the close is higher than the open - the candlestick mid-section is hollow or shaded blue/green.
If the open is higher than the close - the candlestick mid-section is filled in or shaded red.
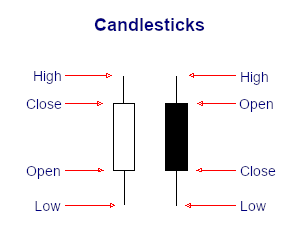
The advantage of candlestick charts is the ability to highlight trend weakness and reversal signals that may not be apparent on a normal bar chart.
Form TA-W ~ SEC Filings Explained
Notice of withdrawal from registration as transfer agent filed pursuant to the Securities Exchange Act of 1934
Candlestick Colors
For improved presentation, Incredible Charts uses colors such as red and blue/green to indicate filled or hollow candlesticks:
Blue (or green) candlestick if the close is higher than the open;
Red candlestick if the open is higher than the close (i.e. the candlestick is filled);
The same color as the previous day, if the open is equal to the close.
ETF’s Explained
An exchange-traded fund (ETF) is an investment fund traded on stock exchanges, much like stocks.[1] An ETF holds assets such as stocks, commodities, or bonds, and trades close to its net asset value over the course of the trading day. Most ETFs track an index, such as a stock index or bond index. ETFs may be attractive as investments because of their low costs, tax efficiency, and stock-like features.[2][3] ETFs are the most popular type of exchange-traded product.[citation needed]
Only so-called authorized participants (typically, large institutional investors) actually buy or sell shares of an ETF directly from or to the fund manager, and then only in creation units, which are large blocks of tens of thousands of ETF shares, usually exchanged in-kind with baskets of the underlying securities. Authorized participants may wish to invest in the ETF shares for the long-term, but they usually act as market makers on the open market, using their ability to exchange creation units with their underlying securities to provide liquidity of the ETF shares and help ensure that their intraday market price approximates to the net asset value of the underlying assets.[4] Other investors, such as individuals using a retail broker, trade ETF shares on this secondary market.
An ETF combines the valuation feature of a mutual fund or unit investment trust, which can be bought or sold at the end of each trading day for its net asset value, with the tradability feature of a closed-end fund, which trades throughout the trading day at prices that may be more or less than its net asset value. Closed-end funds are not considered to be "ETFs", even though they are funds and are traded on an exchange. ETFs have been available in the US since 1993 and in Europe since 1999. ETFs traditionally have been index funds, but in 2008 the U.S. Securities and Exchange Commission began to authorize the creation of actively managed ETFs.
UPSIDE GAP TWO CROWS
The Bearish Upside Gap Two Crows Pattern is a three-candlestick pattern and it signals a top reversal. The first candlestick is a long white candlestick followed by a real body that gaps higher. Then another black real body appears, which opens above the second day’s open and closes under the second day’s close, completing the pattern
Recognition Criteria:
1. Market is characterized by uptrend.
2. We see a long white candlestick in the first day that signals the continuation of uptrend.
3. Then we see a black body with a gap up on second day.
4. The third day is characterized by another black candlestick having an opening above the first black day and also closing below the body of the first black day. The body of third day engulfs the body of the first day.
5. The close of the second black candlestick is still above the close of the first long white candlestick.
Explanation:
The market is in an uptrend and it displays a higher opening with a gap. However the new highs of the day cannot hold and the market forms a black candlestick. However the bulls still comfort themselves by the fact that the close on this black candlestick day is still above the prior day’s close. The third day however increases the bearish sentiment displaying another new high but failing to hold these highs until the close. Also the day closes below the prior day’s close, which is another bearish sign. . So the following question becomes relevant. If the market is so strong, why the new highs fail to hold and why market closes lower? The answer is clear. Market is not now as strong as the bulls would like to believe.
THREE OUTSIDE UP
The Bearish Upside Gap Two Crows Pattern is a three-candlestick pattern and it signals a top reversal. The first candlestick is a long white candlestick followed by a real body that gaps higher. Then another black real body appears, which opens above the second day’s open and closes under the second day’s close, completing the pattern
Recognition Criteria:
1. Market is characterized by downtrend.
2. We see a Bullish Engulfing Pattern in the first two days.
3. The third day is a white candlestick with a higher close than the second day.
Explanation:
The first two days of this three-day pattern is simply a Bullish Engulfing Pattern, and the third day confirms the reversal suggested by the Bullish Engulfing Pattern since it is a white candlestick closing with a new high for the last three days.
Form N-23C3A ~ SEC Filings Explained
Notification of periodic repurchase offer Filed pursuant to Rule 23c-3(b) only
SEC Filings Explained ~ Rule 144
On December 6, 2007, the SEC published final rules revising Rule 144 under the Securities Act of 1933, which regulates the resale of restricted securities and securities held by affiliates. The amendments to Rule 144, among other things:
1. Shorten the holding period for affiliate and non-affiliate holders of restricted securities of SEC-reporting companies to six months, subject to certain conditions
2. Permit unlimited resale by non-affiliate holders of restricted securities by complying only with the current public information condition for resale of restricted securities issued by SEC reporting companies made after the six-month holding period; and without complying with any Rule 144 conditions for resale of restricted securities issued by both SEC reporting and non-reporting companies made after a one-year holding period.
3. permit resale of equity securities by affiliates that meet certain conditions through riskless principal transactions and brokers’ transactions in which the broker has published bid and asked quotations for the security in an alternative trading system.
4. Eliminate the manner of sale conditions and ease the volume limitations for resale of debt securities by affiliates.
5. Increase the thresholds that trigger the Form 144 filing requirement to 5,000 shares or $50,000.
The SEC did not adopt previously proposed provisions relating to the tolling of holding periods in connection with hedging transactions.
The amendments will become effective on February 15, 2008, and will apply to securities acquired before or after that date. Background
Rule 144 regulates the resale of “restricted securities”1 and “control securities,”2 by establishing certain conditions that must be satisfied in order for the resale to be exempt from the Securities Act registration requirements pursuant to Section 4(1) of the Securities Act—a safe harbor from “underwriter” status for the selling security holder.
The conditions include the following:
? There must be adequate current public information available about the issuer;
? If the securities being sold are restricted securities, the security holder must have held the security for a specified holding period;
? The resale must be within specified sales volume limitations;
? The resale must comply with the manner of sale requirements of the rule; and
? The selling security holder must file Form 144 with the SEC if the amount of securities being sold exceeds specified thresholds.
Amendments to Conditions for Resale of Restricted Securities
Restricted Securities of SEC-Reporting Companies. The SEC has reduced the holding period under Rule 144 for restricted securities of SEC-reporting companies held by both affiliates and non-affiliates from one year to six months. Affiliate holders of reporting company securities may now resell their restricted securities after six months, subject to the other Rule 144 requirements. Non-affiliate holders of reporting company securities (who have also not been affiliates during the prior three months) may now resell their restricted securities held between six months and one year subject only to Rule 144’s current public information requirement. Any such resale by a non-affiliate after one year will be exempt from all Rule 144 requirements.
Restricted Securities of Non-Reporting Companies. There is still a one-year holding period for affiliate and non-affiliate holders of restricted securities in non-reporting companies under amended Rule 144. After the one-year holding period, non-affiliates may now resell their restricted securities without having to comply with any other Rule 144 requirements; affiliates seeking to resell their restricted securities must still meet all Rule 144 requirements.
The manner of sale requirements of Rule 144 require securities to be sold in “brokers’ transactions” or in transactions directly with a “market maker.”
The rule includes restrictions on (1) soliciting or arranging for the solicitation of orders to buy the securities in anticipation of, or in connection with, the Rule 144 transaction or (2) making any payment in connection with the offer or sale of the securities to any person other than the broker who executes the order to sell the securities.
The SEC amended these rules to also permit the resale of restricted equity securities by affiliates through riskless principal transactions in which trades are executed at the same price, exclusive of any explicitly disclosed markup or markdown, commission equivalent or other fee, and the rules for a self-regulatory organization permit the transaction to be reported as riskless.3 The amended rule also expands the definition of a “brokers’ transaction” for purposes of such resale by permitting a broker to insert bid and ask quotations for the security in an alternative trading system, provided that the broker has published bona fide bid and ask quotations for such security on each of the last 12 business days. Resale of Restricted Debt Securities The SEC has eliminated the manner-of-sale requirements for affiliate resale of debt securities, including non-participatory preferred stock (which has debt-like characteristics) and asset-backed securities. The SEC also raised the volume limitations for the resale of debt securities to permit resale in an amount that does not exceed ten percent of a tranche (or a class with respect to non-participatory preferred stock), together with all sales of securities of the same tranche sold for the selling debt security holder within a three-month period. Form 144 Filing Triggers
The sales thresholds for filing Form 144 have been increased from 500 shares or $10,000 worth of securities to 5,000 shares or $50,000. Codified
SEC Staff Interpretations
The SEC has also codified various staff interpretations relating to Rule 144, including the following:
1. Stating that securities acquired by accredited investors pursuant to Section 4(6) of the Securities Act are considered restricted securities
2. Permitting tacking of holding periods when a company reorganizes into a holding company structure
3. Permitting tacking of holding periods for conversions and exchanges of securities
4. Deeming the acquisition dates for securities acquired pursuant to the cashless exercise of options and warrants as the dates the options or warrants were acquired
5. Permitting a pledgee of restricted securities to sell the pledged securities without having to aggregate the sale with sales by other pledgees from the same pledgor (as long as there is no concerted action by those pledgees), for purposes of the Rule 144 volume limitation condition
6. Permitting the Form 144 representations required from security holders relying on Exchange Act Rule 10b5-1 to be made as of the date the holder adopted a trading plan or gave trading instructions
7. Confirming the unavailability of Rule 144 for the resale of securities by reporting and non-reporting firms
Three White Soldiers (Bullish)
Bullish Three White Soldiers Pattern is indicative of a strong reversal in the market. It is characterized by three long candlesticks stepping upward like a staircase. The opening of each day is slightly lower than previous close rallying then to a short term high.
Recognition Criteria:
1. Market is characterized by downtrend.
2. We see three consecutive long white candlesticks.
3. Each candlestick closes at a new high.
4. The opening of each candlestick is within the body of the previous day.
5. Each consecutive day closes near or at its highs.
Explanation:
The Bullish Three White Soldiers Pattern appears in a context where the market stayed at a low price for too long. The market is still falling down and it is now approaching a bottom or already at bottom. Then we see a decisive attempt upward shown by the long white candlestick. Rally continues in the next two days characterized by higher closes. Bears are now forced to cover short positions.
Important Factors:
The opening prices of the second and third days can be anywhere within the previous day's body. However, it is better to see the opening prices above the middle of the previous day's body.
If the white candlesticks are very extended, one should be cautious about an overbought market.
The reliability of this pattern is very high, but still a confirmation in the form of a white candlestick with a higher close or a gap-up is suggested.
|
Followers
|
3289
|
Posters
|
|
|
Posts (Today)
|
0
|
Posts (Total)
|
2804248
|
|
Created
|
08/22/10
|
Type
|
Free
|
| Moderator Nilbud | |||
| Assistants mick ManicTrader PhotoChick Kirimi $Pistol Pete$ | |||
   Investor Hub Alerts: Sign up for 'STOCKGOODIES PLAYS OF THE WEEK ' E-Mail List Investor Hub Alerts: Sign up for 'STOCKGOODIES PLAYS OF THE WEEK ' E-Mail ListUPDATE; 5-1-22 courtesy of charting /\ wit tweezer top calls /\ Tony @Montana_Trades Really good study sheet on Candlestick Patterns [-chart]pbs.twimg.com/media/FRn8188XMAAdZvk?format=jpg&name=small[/chart] 

02-07-2021
|
|
Posts Today
|
0
|
|
Posts (Total)
|
2804248
|
|
Posters
|
|
|
Moderator
|
|
|
Assistants
|
| Volume | |
| Day Range: | |
| Bid Price | |
| Ask Price | |
| Last Trade Time: |


