 News
News  Market Data
  Discover
Support: 888-992-3836
Copyright © 2023 InvestorsHub Inc.


Register for free to join our community of investors and share your ideas. You will also get access to streaming quotes, interactive charts, trades, portfolio, live options flow and more tools.
BEARISH TRI STAR
The Bearish Deliberation Pattern is a derivative of the Bearish Three White Soldiers Pattern. This pattern also shows a weakness similar to the Bearish Advance Block Pattern since it becomes weaker in a short period of time. However here the weakness occurs all at once on the third day. The small third body of the pattern shows that the rally is losing strength and a reversal is possible.

Recognition Criteria:
1. Market is characterized by uptrend.
2. We see three Dojis on three consecutive days.
3. The second day Doji has a gap above the first and third.
Explanation:
The Bearish Tri Star Pattern appears in a market characterized by uptrend for a long time. When the trend starts to show weakness, we see smaller real bodies. The first Doji is already a matter of considerable concern. The second Doji shows that market now lost its direction. Finally, the third Doji announces the end of uptrend since this now shows utmost indecision leading to reversal of the positions.
Important Factors:
A confirmation on the fourth day is required to show that the uptrend has reversed. This may be in the form of a black candlestick, a large gap down or a lower close on the fourth day. 
Form 15F-15D, 15F-15D/A ~ SEC Filings Explained
Notice of a foreign private issuers suspension of duty to file reports pursuant to Section 13 and 15(d) of the Act (and amendment thereto)
Form 20-F, 20-F/A ~ SEC Filings Explained
Annual and transition report of foreign private issuerspursuant to sections 13 or 15(d) (and amendment thereto)
Exponential Moving Average (EMA)
EMA helps with the lag we get on Simple Moving Averages (SMA) by giving more weight to the more recent price information. The weight given to the most recent price will depend on the number of periods in the moving average. EMA is calculated using 3 steps:
1st - get the SMA by adding the closing prices over the specified period i.e. 5 SMA on a daily chart is the closing price each day over a 5 day period, divided by 5.
2nd - Calculate the weighting multiplier by dividing 2 by the time period 1 and multiplying that answer by 100 to get the percentage i.e. 5 EMA = 2/(5 1) = 0.3333 X 100 = 33.33%
3rd - Calculate the EMA using the % that applies to the time period you are using. Here is the formula:
EMA: {Close - EMA(previous day)} x multiplier EMA(previous day).
Your head may be hurting right now, don't worry most trading platforms will calculate the EMA for you. The important thing is that you remember that the lagging we get with SMA is counteracted with the EMA, giving us a stronger trend indicator.
For those of you who are math freaks like myself, below is an example of how to calculate EMA:
A 10-period exponential moving average applies an 18.18% weighting to the most recent price. A 10-period EMA can also be called an 18.18% EMA. A 20-period EMA applies a 9.52% weighing to the most recent price (2/(20 1) = .0952). Notice that the weighting for the shorter time period is more than the weighting for the longer time period. In fact, the weighting drops by half every time the moving average period doubles.
Below is a spreadsheet example of a 10-day simple moving average and a 10-day exponential moving average for Intel. Simple moving averages are straight forward and require little explanation. The 10-day average simply moves as new prices become available and old prices drop off. The exponential moving average starts with the simple moving average value (22.22) in the first calculation. After the first calculation, the normal formula takes over. Because an EMA begins with a simple moving average, its true value will not be realized until 20 or so periods later. In other words, the value on the excel spreadsheet may differ from the chart value because of the short look-back period. This spreadsheet only goes back 30 periods, which means the affect of the simple moving average has had 20 periods to dissipate.

Below is an example of a chart with both the SMA
iShares MSCI Emerging Market Index (NYSE:EEM)
This investment attempts to mimic the returns seen in the MSCI Emerging Markets index which was created as an equity benchmark for international security performance. If you would like to gain some international exposure, specifically to emerging markets, this ETF might be for you.
Form TA-W ~ SEC Filings Explained
Notice of withdrawal from registration as transfer agent filed pursuant to the Securities Exchange Act of 1934
Form 10-12G, 10-12G/A ~ SEC Filings Explained
Initial general form for registration of a class of securities pursuant to section 12(g) (and amendment thereto)
Form 13F-HR, 13F-HR/A ~ SEC Filings Explained
Initial Quarterly Form 13F Holdings report filed by institutional managers (and amendment thereto)
Form F-7 ~ SEC Filings Explained
Registration statement for securities of certain Canadian issuers offered for cash upon the exercise of rights granted to existing security holders
Below is a table in order of the sum of the 3, 6, and 12 month returns for individual country ETFs. Each column represents returns for various timeframes and the percent each ETF is above (or below) the 200 day moving averages as of January's close. This list is tracked monthly on the right hand side of my blog Scott's Investments.
Note that all country ETFs are above their 200 day moving average except PGJ (China), GXC (China), FXI (China), EWP (Spain), EWG (Germany), and EWI (Italy). This is a significant change versus last month when none of the ETFs were below the 200 day SMA.
The top 5 based on the sum of the 3-6-12 month returns are below. There are some familiar names: RSX (Russia), [[[TUR]] (Turkey), EIS (Israel), EWZ (Brazil), and ECH (Chile). At the end of December the top 5 were the same 5 ETFs in slightly different order.
One potential strategy investors could use would be to purchase the top ETFs based on the sum of their returns over 3, 6, and 12 months. Or, one could purchase ETFs based solely on 6 month returns (a strategy featured on ETF Screen). An additional twist would be to only purchase the top performing ETFs if they are also above the 200 day moving average.
The data source for the information below is Finviz, which has some of the best free financial data on the web (as well as a new elite service).
Ticker Company Free Trend Analysis Performance (Quarter) Half Year Year Sum 200-Day SMA Price
RSX
Market Vectors Russia ETF Here
12.94% 38.50% 182.29% 233.73% 20.76% 31.08
TUR
iShares MSCI Turkey Invest Mkt Index Here
14.10% 24.74% 134.01% 172.85% 24.26% 55.67
EIS
iShares MSCI Israel Cap Invest Mkt Index Here
10.16% 15.36% 79.76% 105.28% 16.10% 54
EWZ
iShares MSCI Brazil Index Here
-0.19% 16.16% 87.45% 103.42% 5.79% 64.69
ECH
iShares MSCI Chile Investable Mkt Idx Here
15.11% 20.09% 67.13% 102.33% 17.48% 55.77
EWA
iShares MSCI Australia Index Here
-3.39% 16.57% 84.76% 97.94% 8.08% 21.1
PIN
PowerShares India Here
4.23% 8.42% 81.28% 93.93% 6.56% 20.72
THD
iShares MSCI Thailand Invest Mkt Index Here
1.35% 12.40% 80.09% 93.84% 7.61% 39.71
EWT
iShares MSCI Taiwan Index Here
3.43% 7.96% 79.61% 91.00% 6.98% 12.07
EWW
iShares MSCI Mexico Investable Mkt Idx Here
7.25% 15.35% 66.12% 88.72% 9.43% 46
EWY
iShares MSCI South Korea Index Here
4.85% 10.59% 71.28% 86.72% 9.01% 45.44
EWD
iShares MSCI Sweden Index Here
-2.11% 8.14% 76.67% 82.70% 5.41% 22.72
EWS
iShares MSCI Singapore Index Here
4.86% 5.69% 69.50% 80.05% 8.51% 10.78
EZA
iShares MSCI South Africa Index Here
4.72% 10.71% 62.04% 77.47% 5.40% 52.63
EWO
iShares MSCI Austria Investable Mkt Idx Here
-3.79% 13.32% 67.86% 77.39% 2.43% 18.8
EWK
iShares MSCI Belgium Investable Mkt Idx Here
1.37% 18.49% 56.41% 76.27% 7.73% 12.56
EWN
iShares MSCI Netherlands Invstbl Mkt Idx Here
2.65% 16.23% 49.42% 68.30% 9.26% 19.68
PGJ
PowerShares Gldn Dragon Halter USX China Here
0.14% -3.32% 71.34% 68.16% -0.44% 22.12
EWM
iShares MSCI Malaysia Index Here
1.44% 10.47% 54.92% 66.83% 8.63% 10.55
GXC
SPDR S
SEC Filings Explained ~ F-1
Registration statement for certain foreign private issuers.
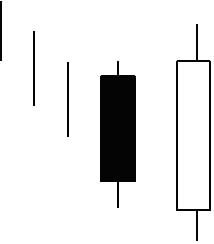
BLACK SPINNING TOP
The Black Spinning Top is a single candlestick pattern. Its shape is a small black body with upper and lower shadows having a greater length than the body's length.
Recognition Criteria:
1. The real body of the pattern is black and small.
2. The upper and lower shadows are longer than the real body's length.
Explanation:
The market moves higher and then sharply lower, or vice versa. It then closes below the opening price creating a black body. This represents complete indecision between the bulls and the bears. The actual length of the shadows is not important. The small body relative to the shadows is what makes the spinning top.
Important Factors:
If a Black Spinning Top is observed after a long rally or long white candlestick, this implies weakness among the bulls and it is a warning about a potential change or interruption in trend.
If a Black Spinning Top is observed after a long decline or a long black candlestick, this implies weakness among the bears and it is a warning about a potential change or interruption in trend.
Like most other single candlestick patterns, the Black Spinning Top has low reliability. It reflects only one day's trading and can be interpreted both as a continuation and a reversal pattern. This pattern must be used with other candlesticks for a better and healthier confirmation of a trend.
Form 15F-12G, 15F-12G/A ~ SEC Filings Explained
Notice of termination of a foreign private issuer's registration of a class of securities under Section 12(g) (and amendment thereto)
Three Black Crows (Bullish)
The Bearish Three Black Crows Pattern is indicative of a strong reversal during an uptrend. It consists of three long black candlesticks, which look like a stair stepping downward. The opening price of each day is higher than the previous day's closing price suggesting a move to a new short term low.

Recognition Criteria:
1. Market is characterized by uptrend.
2. Three consecutive long black candlesticks appear.
3. Each day closes at a new low.
4. Each day opens within the body of the previous day.
5. Each day closes near or at its lows.
Explanation:
The Bearish Three Black Crows Pattern is indicative of the fact that the market has been at a high price for too long and the market may be approaching a top or is already at the top. A decisive downward move is reflected by the first black candlestick. The next two days show further decline in prices due to profit taking. Bullish mood of the market cannot be sustained anymore.
Important Factors:
The opening prices of the second and third days can be anywhere within the previous day's body. However, it is better to see the opening prices below the middle of the previous day's body.
If the black candlesticks are very extended, one should be cautious about an oversold market.
The reliability of this pattern is very high, but still a confirmation in the form of a black candlestick with a lower close or a gap-down is suggested.
Fibonacci Pivot Points
Fibonacci Pivot Points start just the same as Standard Pivot Points. From the base Pivot Point, Fibonacci multiples of the high-low differential are added to form resistance levels and subtracted to form support levels.
Pivot Point (P) = (High Low Close)/3
Support 1 (S1) = P - {.382 * (High - Low)}
Support 2 (S2) = P - {.618 * (High - Low)}
Support 3 (S3) = P - {1 * (High - Low)}
Resistance 1 (R1) = P {.382 * (High - Low)}
Resistance 2 (R2) = P {.618 * (High - Low)}
Resistance 3 (R3) = P {1 * (High - Low)}
The chart below shows the Dow Industrials SPDR (DIA) with Fibonacci Pivot Points on a 15 minute chart. R1 and S1 are based on 38.2%. R2 and S2 are based on 61.8%. R3 and S3 are based on 100%.

Form N-14 8C ~ SEC Filings Explained
Initial registration statement filed on Form N14 by closed-end investment company (business combinations)
Trading ETF’s
Trading
Perhaps the most important benefit of an ETF is the stock-like features offered. A mutual fund is bought or sold at the end of a day's trading, whereas ETFs can be traded whenever the market is open. Since ETFs trade on the market, investors can carry out the same types of trades that they can with a stock. For instance, investors can sell short, use a limit order, use a stop-loss order, buy on margin, and invest as much or as little money as they wish (there is no minimum investment requirement).[47]Also, many ETFs have the capability for options (puts and calls) to be written against them. Covered call strategies allow investors and traders to potentially increase their returns on their ETF purchases by collecting premiums (the proceeds of a call sale or write) on calls written against them. Mutual funds do not offer those features
Form S-8 ~ SEC Filings Explained
Initial registration statement for securities to be offered to employees pursuant to employee benefit plans
Form NT 11-Q ~ SEC Filings Explained
Notice under Rule 12b25 of inability to timely file all or part of a form 11-K
Candlestick Patterns
Long Lines
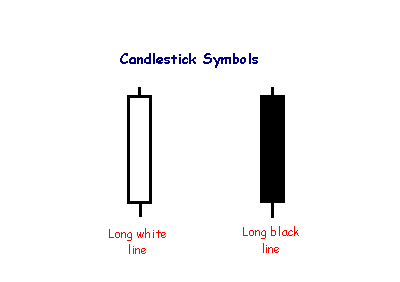
The long white line is a sign that buyers are firmly in control - a bullish candlestick.
A long black line shows that sellers are in control - definitely bearish.
Bond ETFs
Exchange-traded funds that invest in bonds are known as bond ETFs. They thrive during economic recessions because investors pull their money out of the stock market and into bonds (for example, government treasury bonds or those issues by companies regarded as financially stable). Because of this cause and effect relationship, the performance of bond ETFs may be indicative of broader economic conditions.[22] There are several advantages to bond ETFs such as the reasonable trading commissions, but this benefit can be negatively offset by fees if bought and sold through a third party
M-Tops Using Bollinger Bands
M-Tops were also part of Arthur Merrill's work that identified 16 patterns with a basic M shape. Bollinger uses these various M patterns with Bollinger Bands to identify M Bottoms. According to Bollinger, tops are usually more complicated and drawn out than bottoms. Double tops, head-and-shoulders patterns and diamonds represent evolving tops.
In its most basic form, an M-Top is similar to a double top. However, the reaction highs are not always equal. The first high can be higher or lower than the second high. Bollinger suggests looking for signs of non-confirmation when a security is making new highs. This is basically the opposite of the W-Bottom. A non-confirmation occurs with three steps. First, a security forges a reaction high above the upper band. Second, there is a pullback towards the middle band. Third, prices move above the prior high, but fail to reach the upper band. This is a warning sign. The inability of the second reaction high to reach the upper band shows waning momentum, which can foreshadow a trend reversal. Final confirmation comes with a support break or bearish indicator signal.

The chart shows Exxon Mobil (XOM) with an M-Top in April-May 2008. The stock moved above the upper band in April. There was a pullback in May and then another push above 90. Even though the stock moved above the upper band on an intraday basis, it did not CLOSE above the upper band. The M-Top was confirmed with a support break two weeks later. Also notice that MACD formed a bearish divergence and moved below its signal line for confirmation.
Form 1-E, 1-E/A ~ SEC Filings Explained
Notification under Regulation E by small business investment companies and business development companies (and amendment thereto)
Using Moving Averages to Find Support and Resistance
Moving averages can also act as support in an uptrend and resistance in a downtrend. A short-term uptrend might find support near the 20-day simple moving average, which is also used in Bollinger Bands. A long-term uptrend might find support near the 200-day simple moving average, which is the most popular long-term moving average. If fact, the 200-day moving average may offer support or resistance simply because it is so widely used. It is almost like a self-fulfilling prophecy.

The chart above shows the NY Composite with the 200-day simple moving average from mid 2004 until the end of 2008. The 200-day provided support numerous times during the advance. Once the trend reversed with a double top support break, the 200-day moving average acted as resistance around 9500.
Do not expect exact support and resistance levels from moving averages, especially longer moving averages. Markets are driven by emotion, which makes them prone to overshoots. Instead of exact levels, moving averages can be used to identify support or resistance zones.
Hammer and Gravestone
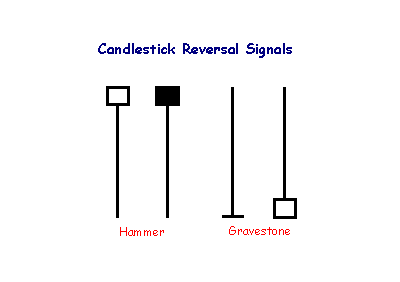
The hammer is not as strong as the dragonfly candlestick, but also signals reversal after a down-trend: control has shifted from sellers to buyers. The shadow of the candlestick should be at least twice the height of the body.
A gravestone is identified by open and close near the bottom of the trading range. The candlestick is the converse of a hammer and signals reversal when it occurs after an up-trend.
Pivot Points ~ Support and Resistance
Support and resistance levels based on Pivot Points can be used just like traditional support and resistance levels. The key is to watch price action closely when these levels come into play. Should prices decline to support and then firm, traders can look for a successful test and bounce off support. It often helps to look for a bullish chart pattern or indicator signal to confirm an upturn from support. Similarly, should prices advance to resistance and stall, traders can look for a failure at resistance and decline. Again, chartists should look for a bearish chart pattern or indicator signal to confirm a downturn from resistance.

The second support and resistance levels can also be used to identify potentially overbought and oversold situations. A move above the second resistance level would show strength, but it would also indicate an overbought situation that could give way to a pullback. Similarly, a move below the second support would show weakness, but would also suggest a short-term oversold condition that could give way to a bounce.

Dragon Fly Doji usually occurs when a downward change is about to break.

Long Legged Doji indicates a battle between the Bulls and Bears that resulted in a draw. When this happens trend is usually broken from an uptrend to a downturn OR from a downtrend to an upturn.

Simple Moving Average or (SMA)
The SMA does not predict the price direction but it smooths out the price action to give a trend indication.
Moving averages are lagging indicators because they are based on past prices. Despite this lag, moving averages help smooth price action and filter out the noise. They are also used to form the building blocks for many other technical indicators and overlays, such as Bollinger Bands, MACD and the McClellan Oscillator. Moving averages can be used to identify the direction of the trend or define potential support and resistance levels.
Here's a chart with a 5 day SMA on it:
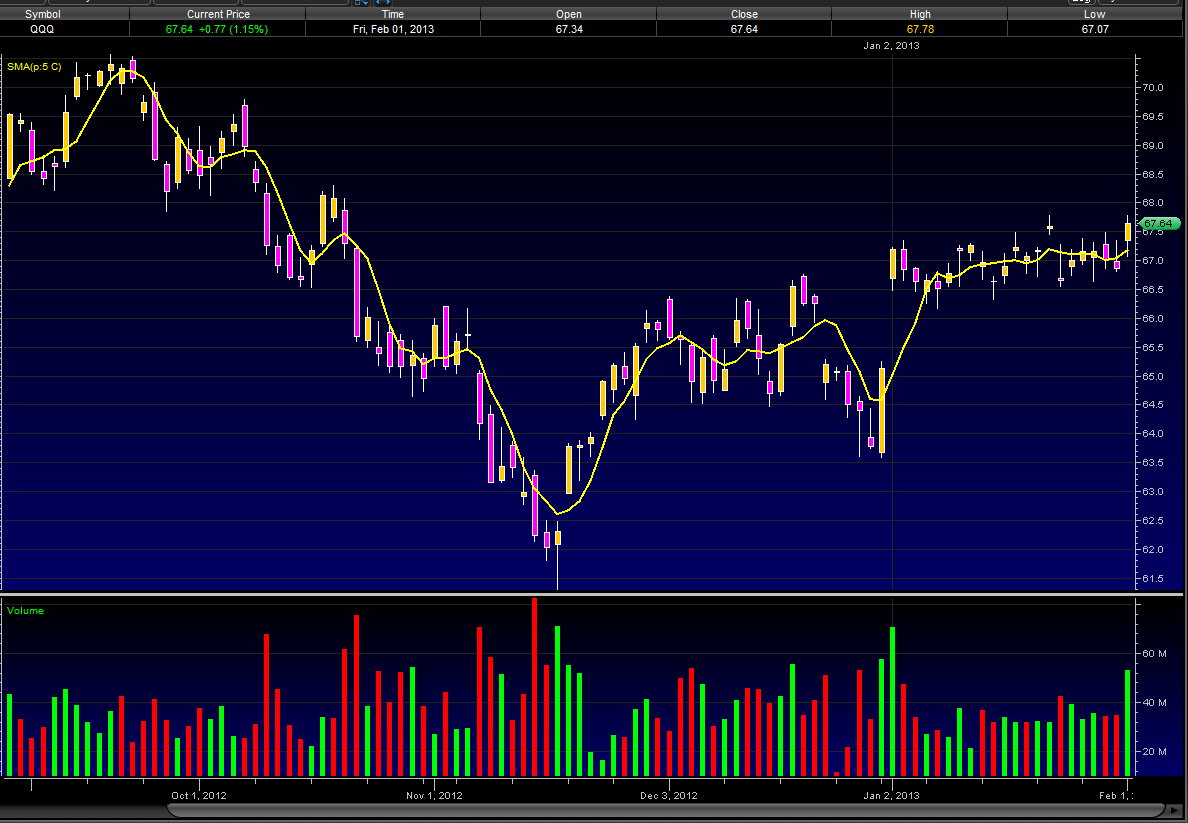
A simple moving average is made by calculating the average price of a security over a specific number of closing costs. The SMA will reflect the average closing cost, based on the time line of the chart you are looking at. i.e.: A 5 SMA on a daily chart will plot a line showing the average closing daily price, on a 60 minute chart that 5 SMA will plot a line showing the average hourly closing price. If the closing price changes so too does the SMA, hence the Moving part of Simple Moving Average. Old data is dropped and new data is added as it comes and goes, making the average move along the timeline. For those who need a visual take a look at how a SMA is plotted.
We will start our SMA on day 5
Daily Closing Prices:
Day 1 ------ 10
Day 2 ------ 12
Day 3 ------ 11
Day 4 ------ 14
Day 5 ------ 13
Day 6 ------ 15
Day 7 ------ 18
Day 8 ------ 19
SMA Plot points:
Day 5 ---- 10 12 11 14 13(closing price each day, 1 through 5) = 60 /5(# of days) = SMA of 12
Day 6 ---- Drop the 10 from day 1 and add the 15 from day 6 = 65 /5 = 13
Day 7 ---- Drop the 12 from day 2 and add 18 from day 7 = 71 /5 = 14.2
Day 8 ---- Drop the 11 from day 3 and add 19 from day 8 = 79 /5 = 15.8
Form 8-K~ SEC Filings Explained
Form 8-K is a very broad form used to notify investors of any material event that is important to shareholders or the United States Securities and Exchange Commission. This is one of the most common types of forms filed with the SEC. After a significant event like bankruptcy or departure of a CEO, a public company generally must file a Current Report on Form 8-K within four business days to provide an update to previously filed quarterly reports on Form 10-Qand/or Annual Reports on Form 10-K. Form 8-K is required to be filed by public companies with the SEC pursuant to the Securities Exchange Act of 1934, as amended. For a list of events that would trigger a Form 8-K to be filed, see the Official SEC Form 8-K Summary, reproduced below.
When Form 8-K is required
Form 8-K is used to notify investors of a current event. These types of events include:
? Material definitive agreements not made in the ordinary course of business
? Bankruptcies or receiverships
? Director is elected
? Director departs
? If a director departs because of a disagreement with the company on any matter relating to the registrant’s operations, policies, or practices then an 8-K must be filed to disclose a brief description of the circumstances representing the disagreement.[1]
? Asset movement: acquisition or sale
? Result of operations and financial condition
? Material Direct Financial obligations (bonds, debentures)
? Triggering events that accelerate material obligations (defaults on a loan)
? Exit or disposal plans
? Layoffs
? shutting down a plant
? material change in services or outlets
? Material impairments
? Delisting or transfer exchange notices
? Unregistered equity sales
? Modifications to shareholder rights
? Change in accountant - and good idea to explain why
? SEC investigations and internal reviews
? Financial non-reliance notices
? Changes in control of the company
? Someone takes a large equity position (more than 15%); shareholder also needs to file with SEC as to intent
? Someone takes a 51% position
? Changes in executive management
? Officer leaves
? Officer is fired
? Officer is hired
? Departure or appointment of company officers
? Amendments to company Governance Policies
? Code of Ethics
? Board Committee Governance Policies
? Trading suspension
? Change in credit
? Change in company status
? Other events
? Financial exhibits
Investors should always read any 8-K filings that are made by companies in which they are invested. These reports are both material and relevant to the company, and often contain information that will affect the share price.
Reading Form 8K
Typically an 8-K filing will only have two major parts. They are:
? The name and description of the event - this contains all the information that the company considers relevant to shareholders and the SEC. It is important to read this information, as it has been deemed "material" by the company.
? Any exhibits that are relevant - these exhibits may include financial statements, press releases, data tables, or other information that is referenced in the description of the event.
Price Crossovers using Moving Averages
Moving averages can also be used to generate signals with simple price crossovers. A bullish signal is generated when prices move above the moving average. A bearish signal is generated when prices move below the moving average. Price crossovers can be combined to trade within the bigger trend. The longer moving average sets the tone for the bigger trend and the shorter moving average is used to generate the signals. One would look for bullish price crosses only when prices are already above the longer moving average. This would be trading in harmony with the bigger trend. For example, if price is above the 200-day moving average, chartists would only focus on signals when price moves above the 50-day moving average. Obviously, a move below the 50-day moving average would precede such a signal, but such bearish crosses would be ignored because the bigger trend is up. A bearish cross would simply suggest a pullback within a bigger uptrend. A cross back above the 50-day moving average would signal an upturn in prices and continuation of the bigger uptrend.
The next chart shows Emerson Electric (EMR) with the 50-day EMA and 200-day EMA. The stock moved above and held above the 200-day moving average in August. There were dips below the 50-day EMA in early November and again in early February. Prices quickly moved back above the 50-day EMA to provide bullish signals (green arrows) in harmony with the bigger uptrend. MACD(1,50,1) is shown in the indicator window to confirm price crosses above or below the 50-day EMA. The 1-day EMA equals the closing price. MACD(1,50,1) is positive when the close is above the 50-day EMA and negative when the close is below the 50-day EMA.

Form 15-15D, 15-15D/A ~ SEC Filings Explained
Notice of suspension of duty to file reports pursuant to Section 13 and 15(d) of the Act (and amendment thereto)
SEC Filings Explained ~ Form 4
Form 4 is a United States SEC filing that relates to insider trading. Every director, officer or owner of more than ten percent of a class of equity securities registered under Section 12 of the Securities Exchange Act of 1934 must file with the United States Securities and Exchange Commission a statement of ownership regarding such security. The initial filing is on Form 3 and changes are reported on Form 4. The Annual Statement of beneficial ownership of securities is on Form 5. The forms contain information on the reporting person's relationship to the company and on purchases and sales of such equity securities.
Form 4 is stored in SEC's EDGAR database. EDGAR is Electronic Data Gathering, Analysis and Retrieval System. It is a registered trademark of the SEC.
A Form 4 must be filed before the end of the second business day following a change in ownership of securities or derivative securities (including the exercise or grant of stock options) for individuals subject to Section 16 of the Securities Exchange Act of 1934.
iShares
iShares is Barclay's (Barclay's Global Investors "BGI") brand of ETFs. In 2009 there were approximately 350 iShares trading with around $300 billion under management. Barclay has put out a number of iShares that follow many of the major indexes around the world including the Nasdaq, NYSE, Dow Jones, and Standard
Taxation on ETF’s
ETFs are structured for tax efficiency and can be more attractive than mutual funds. In the U.S., whenever a mutual fund realizes a capital gain that is not balanced by a realized loss, the mutual fund must distribute the capital gains to its shareholders. This can happen whenever the mutual fund sells portfolio securities, whether to reallocate its investments or to fund shareholder redemptions. These gains are taxable to all shareholders, even those who reinvest the gains distributions in more shares of the fund. In contrast, ETFs are not redeemed by holders (instead, holders simply sell their ETF shares on the stock market, as they would a stock, or effect a non-taxable redemption of a creation unit for portfolio securities), so that investors generally only realize capital gains when they sell their own shares or when the ETF trades to reflect changes in the underlying index.[5]
In most cases, ETFs are more tax-efficient than conventional mutual funds in the same asset classes or categories.[42] Because Vanguard's ETFs are a share-class of their mutual funds, they don't get all the tax advantages if there are net redemptions on the mutual fund shares.[43] Although they do not get all the tax advantages, they get an additional advantage from tax loss harvesting any capital losses from net redemptions.[44][45]
In the U.K., ETFs can be shielded from capital gains tax by placing them in an Individual Savings Account or self-invested personal pension, in the same manner as many other shares. Because UK-resident ETFs would be liable for UK corporation tax on non-UK dividends, most ETFs which hold non-UK companies sold to UK investors are issued in Ireland or Luxembourg
SEC Filings Explained ~ POS AM Form
Post-effective amendments to provide updated prospectus information.
Form 13F-NT, 13F-NT/A ~ SEC Filings Explained
Initial Quarterly Form 13F Notice Report filed by institutional managers (and amendment thereto)
Form 11-K, 11-K/A ~ SEC Filings Explained
Annual report of employee stock purchase, savings and similar plans (and amendment thereto)
Doji Candlesticks (General)
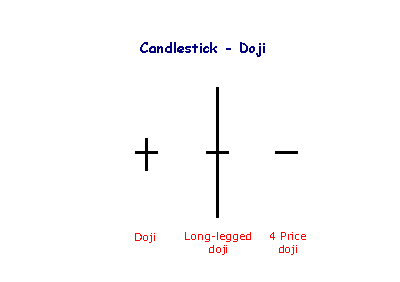
The doji candlestick occurs when the open and closing price are equal.
An open and close in the middle of the candlestick signal indecision. Long-legged dojis, when they occur after small candlesticks, indicate a surge in volatility and warn of a potential trend change. 4 Price dojis, where the high and low are equal, are normally only seen on thinly traded stocks.
BULLISH TRI STAR
The Bullish Tri Star Pattern is a very rare but significant bottom reversal pattern. Three Dojis form this pattern. The middle Doji is a Doji Star.

Recognition Criteria:
1. Market is characterized by downtrend.
2. Then we see three consecutive Doji.
3. The second day Doji gaps below the first and third.
Explanation:
In the case of a Bullish Tri Star Pattern, we have a market, which is in a downtrend for a long time. However the weakening trend shows itself by the fact that the real bodies are probably becoming smaller. The first Doji is a matter of concern. The second Doji clearly indicates that market is losing its direction. Finally, the third Doji warns that the downtrend is over. This pattern indicates too much indecision leading to reversal of positions.
Important Factors:
A confirmation on fourth day is required to be sure that the downtrend has reversed. Confirmation may be in the form of a white candlestick, a large gap up or a higher close on the fourth day.
Form 10-Q~ SEC Filings Explained
Form 10-Q, (also known as a 10-Q or 10Q) is a quarterly report mandated by the United States federalSecurities and Exchange Commission, to be filed by publicly traded corporations.
Pursuant to Section 13 or 15(d) of the Securities Exchange Act of 1934, it's an SEC filing that must be filed quarterly with the US Securities and Exchange Commission. It contains similar information to the annual form 10-K, however the information is generally less detailed, and the financial statements are generally unaudited. Information for the final quarter of a firm's fiscal year is included in the 10-K, so only three 10-Q filings are made each year.
These reports generally compare last quarter to the current quarter and last years quarter to this years quarter. The SEC put this form in place to facilitate better informed investors. The form 10-Q must be filed within 40 days for large accelerated filers and accelerated filers or 45 days after the end of the fiscal quarter for all other registrants (formerly 45 days)
Currency ETFs or ETCs
In 2005, Rydex Investments launched the first ever currency ETF called the Euro Currency Trust (NYSE: FXE) in New York. Since then Rydex has launched a series of funds tracking all major currencies under their brand CurrencyShares. In 2007Deutsche Bank's db x-trackers launched EONIA Total Return Index ETF in Frankfurt tracking the euro, and later in 2008 the Sterling Money Market ETF (LSE: XGBP) and US Dollar Money Market ETF (LSE: XUSD) in London. In 2009, ETF Securitieslaunched the world's largest FX platform tracking the MSFXSM Index covering 18 long or short USD ETC vs. single G10 currencies. The funds are total return products where the investor gets access to the FX spot change, local institutional interest rates and a collateral yield.
SEC Filings Explained ~ Form D
Form D is an SEC Filing form to be used to file a notice of an exempt offering of securities under Regulation D. Commission rules require the notice to be filed by companies and funds that have sold securities without registration under the Securities Act of 1933 in an offering based on a claim of exemption under Rule 504, 505 or 506 of Regulation D or Section 4(6) of that statute. Commission rules further require the notice to be filed within 15 days after the first sale of securities in the offering. For this purpose, the date of first sale is the date on which the first investor is irrevocably contractually committed to invest. If the due date falls on a Saturday, Sunday or holiday, it is moved to the next business day.
Privately held companies that raise capital are required to file a Form D with the SEC to declare exempt offering of securities. Many of these filings show investments in small, growing companies through venture capital and angel investors, as well as certain pooled investment funds.
Form T-3 ~ SEC Filings Explained
Initial application for qualification of trust indentures
Form 1-E AD, 1-E AD/A ~ SEC Filings Explained
Sales material filed pursuant to Rule 607 under Regulation E. (and amendment thereto)
List of Direxion ETF’s
Symbol Fund Index/Benchmark Daily Target Bloomberg Index Symbol
Long Term Investment
ETFs
KNOW
Direxion All Cap Insider Sentiment Shares
Sabrient Multi-Cap Insider/Analyst Quant-Weighted Index - SBRQAM
INSD
Direxion Large Cap Insider Sentiment Shares
Sabrient Large-Cap Insider/Analyst Quant-Weighted Index - SBRQAL
VSPY
Direxion S
BULLISH ENGULFING
Bullish Engulfing Pattern is a pattern characterized by a large white real body engulfing a preceding small black real body, which appears during a downtrend. The white body does not necessarily engulf the shadows of the black body but totally engulfs the body itself. The Bullish Engulfing Pattern is an important bottom reversal signal.
Recognition Criteria:
1. Market is characterized by downtrend.
2. Then we see a small black body.
3. Next day we see a white body that completely engulfs the black real body of the preceding day.
Explanation:
While the market sentiment is bearish; we see some subsided selling reflected by the short, black real body of the first day. Next day shows bull strength with a closing price at or above the previous day’s open. It means that the downtrend is now losing momentum and the bulls started to take the lead.
Important Factors:
The relative size of the bodies in the first and second days is important. If the first day of the Bullish Engulfing Pattern is characterized by a very small real body (it may even be a doji or nearly a doji) but the second day is characterized by a very long real body, this strongly indicates that the bearish power is diminishing and the disparity of white versus black body is indicative of the emerging bull power.
There is higher probability of a bullish reversal if there is heavy volume on the second real body or if the second day of the Bullish Engulfing Pattern engulfs more than one real body (which essentially means we see two or more small black bodies preceding the long white body).
The reversal of downtrend needs further confirmation on the third day. This confirmation may be in the form of a white candlestick, a large gap up or a higher close on the third day.
Inverted Hammer

The Inverted Hammer is a type of bullish reversal pattern. As its name implies, the Inverted Hammer looks like an upside down version of the hammer candlestick pattern. Like the hammer candlestick pattern, the Inverted Hammer consists of one candle and when found in a downtrend is considered a potential reversal pattern.
The pattern is made up of a candle with a small lower body and a long upper wick which is at least two times as large as the short lower body. The body of the candle should be at the low end of the trading range and there should be little or no lower wick in the candle.

The long upper wick of the candlestick pattern indicates that the buyers drove prices up at some point during the period in which the candle was formed but encountered selling pressure which drove prices back down for the period to close near to where they opened. As this occurred in an uptrend the selling pressure is seen as a potential reversal sign. When encountering the Inverted Hammer traders will look for a higher open on the next period before considering the pattern confirmed and potentially including it in their trading strategy.
Shooting Star
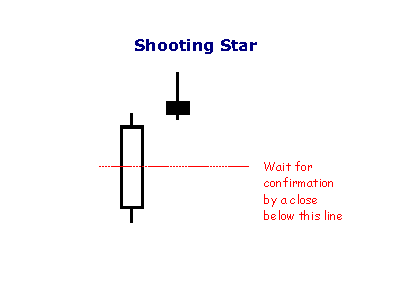
The shooting star is a type of bearish reversal pattern. The Shooting Star looks exactly the same as the Inverted hammer, but instead of being found in a downtrend it is found in an uptrend and thus has different implications. Like the Inverted hammer it is made up of a candle with a small lower body, little or no lower wick, and a long upper wick that is at least two times the size of the lower body.
The long upper wick of the candlestick pattern indicates that the buyers drove prices up at some point during the period in which the candle was formed but encountered selling pressure which drove prices back down for the period to close near to where they opened. As this occurred in an uptrend the selling pressure is seen as a potential reversal sign. When encountering this pattern traders will look for a lower open on the next period before considering the pattern valid and potentially including it in their trading strategy.
As with the Inverted hammer most traders will see a longer wick as a sign of a greater potential reversal and like to see an increase in volume on the day the Shooting Star forms.
3. Counterparty risk (Risks Associated with ETF’s)
A synthetic ETF has counterparty risk, because the counterparty is contractually obligated to match the return on the index. The deal is arranged with collateral posted by the swap counterparty. A potential hazard is that the investment bank offering the ETF might post its own collateral, and that collateral could be of dubious quality. Furthermore, the investment bank could use its own trading desk as counterparty. These types of set-ups are not allowed under the European guidelines, Undertakings for Collective Investment in Transferable Securities (UCITS), so the investor should look for UCITS III-compliant funds.
|
Followers
|
3289
|
Posters
|
|
|
Posts (Today)
|
0
|
Posts (Total)
|
2804248
|
|
Created
|
08/22/10
|
Type
|
Free
|
| Moderator Nilbud | |||
| Assistants mick ManicTrader PhotoChick Kirimi $Pistol Pete$ | |||
   Investor Hub Alerts: Sign up for 'STOCKGOODIES PLAYS OF THE WEEK ' E-Mail List Investor Hub Alerts: Sign up for 'STOCKGOODIES PLAYS OF THE WEEK ' E-Mail ListUPDATE; 5-1-22 courtesy of charting /\ wit tweezer top calls /\ Tony @Montana_Trades Really good study sheet on Candlestick Patterns [-chart]pbs.twimg.com/media/FRn8188XMAAdZvk?format=jpg&name=small[/chart] 

02-07-2021
|
|
Posts Today
|
0
|
|
Posts (Total)
|
2804248
|
|
Posters
|
|
|
Moderator
|
|
|
Assistants
|
| Volume | |
| Day Range: | |
| Bid Price | |
| Ask Price | |
| Last Trade Time: |


