 News
News  Market Data
  Discover

Support: 888-992-3836
Copyright © 2023 InvestorsHub Inc.


Register for free to join our community of investors and share your ideas. You will also get access to streaming quotes, interactive charts, trades, portfolio, live options flow and more tools.
Form TA-1 ~ SEC Filings Explained
Application for registration as a transfer agent filed pursuant to the Securities Exchange Act of 1934

$ALQA BarChart Technical Analysis
http://www.barchart.com/technicals/stocks/ALQA
The relative strength index (RSI) is a technical indicator used in the analysis of financial markets. It is intended to chart the current and historical strength or weakness of a stock or market based on the closing prices of a recent trading period. The indicator should not be confused with relative strength.
Form 15F-15D, 15F-15D/A ~ SEC Filings Explained
Notice of a foreign private issuers suspension of duty to file reports pursuant to Section 13 and 15(d) of the Act (and amendment thereto)
$RYPE BarChart Technical Analysis
http://www.barchart.com/technicals/stocks/RYPE
With its triple smoothing, TRIX is designed to filter insignificant price movements. Chartists can use TRIX to generate signals similar to MACD.
$MRVKF BarChart Technical Analysis
http://www.barchart.com/technicals/stocks/MRVKF
SEC Filings Explained ~ S-1
Form S-1 is an SEC filing used by public companies to register their securities with the U.S. Securities and Exchange Commission (SEC) as the "registration statement by the Securities Act of 1933". The S-1 contains the basic business and financial information on an issuer with respect to a specific securities offering. Investors may use the prospectus to consider the merits of an offering and make educated investment decisions. A prospectus is one of the main documents used by an investor to research a company prior to an initial public offering (IPO). Other less detailed registration forms, such as Form S-3 may be used for certain registrations.
Every business day from 10 to 5, S-1 forms are filed with the SEC's EDGAR filing system, the required filing format of the U.S. Securities and Exchange Commission. However many of these (typically 30% to 90%) are of the related Form S-1/A, which is used for filing amendments to a previously filed Form S-1.
The S-1 form has an OMB Approval Number of 3234-0065 and the online form is only 8 pages. However the simplicity of the form's design is belied by theOMB Office's figure of the Estimated Average Burden - 972.32 hours. This means that long time and effort has been used to collect and display information about the filer (a corporate registrant or new registrant who intends to offer securities). The S-1 form requires that the registrant provide information from diverse sources and incorporate this information using many rules or regulations, such as General Rules and Regulations under the Securities Act, Regulation C,Regulation S-K and Regulation S-X.
TRIX is an indicator that combines trend with momentum. The triple smoothed moving average covers the trend, while the 1-period percentage change measures momentum. In this regard, TRIX is similar to MACD and PPO.
$MZRTF BarChart Technical Analysis
http://www.barchart.com/technicals/stocks/MZRTF
Form N-1A ~ SEC Filings Explained
Initial registration statement for open-end management investment companies
The force index (FI) is an indicator used in technical analysis to illustrate how strong the actual buying or selling pressure is. High positive values mean there is a strong rising trend, and low values signify a strong downward trend.
$YLLC BarChart Technical Analysis
http://www.barchart.com/technicals/stocks/YLLC
2. Regulatory risk (Risks Associated with ETF’s)
Synthetic ETFs are attracting regulatory attention from the FSB, [52] the IMF, [53] and the BIS. [54] Areas of concern include the lack of transparency in products and increasing complexity; conflicts of interest; and lack of regulatory compliance.
Chaikin Money Flow sometimes only briefly crosses the zero line with a move that turns the indicator barely positive or negative. There is no follow through and this zero line cross ends up becoming a whipsaw (bad signal). Chartists can filter these signals with buffers by setting the bullish threshold a little above zero ( .05) and the bearish threshold a little below zero (-.05). These thresholds will not entirely eliminate bad signals, but can help reduce whipsaws and filter out weaker signals.
$ARCS BarChart Technical Analysis
http://www.barchart.com/technicals/stocks/ARCS
A buy signal is generated when the indicator is below zero and turns upwards from a trough. No sell signals are generated (that not being its design), but turns at the top have their uses in signalling danger. The indicator is trend-following, and based on averages, so by its nature it doesn't pick a absolute market bottom like our TroughFinder product, but rather shows when a rally has become established.
Harami Candlestick
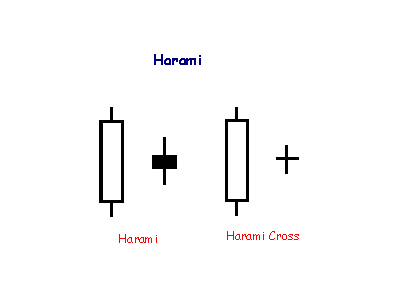
A Harami formation indicates loss of momentum and often warns of reversal after a strong trend. Harami means 'pregnant' which is quite descriptive. The second candlestick must be contained within the body of the first, though the shadows may protrude slightly.
$NHVCF BarChart Technical Analysis
http://www.barchart.com/technicals/stocks/NHVCF
The Coppock Curve is a momentum indicator developed by Edwin "Sedge" Coppock, who was an economist by training. Coppock introduced the indicator in Barron's in October 1965. The goal of this indicator is to identify long-term buying opportunities in the S
Form TA-W ~ SEC Filings Explained
Notice of withdrawal from registration as transfer agent filed pursuant to the Securities Exchange Act of 1934
$BAYN BarChart Technical Analysis
http://www.barchart.com/technicals/stocks/BAYN
Form 6-K~ SEC Filings Explained
Form 6K is an SEC filing submitted to the US Securities and Exchange Commission used by certain foreign private issuers to provide information that is:
? Required to be made public in the country of its domicile
? Filed with and made public by a foreign stock exchange on which its securities are traded
? Are distributed to security holders.
The report must be furnished promptly after such material is made public. The form is not considered "filed" because of Section 18 (for liability purposes). This is the only information furnished by foreign private issuers between annual reports, since such issuers are not required to file on Forms 10-Q or 8-K.
The Chaikin Money Flow (CMF) measures the amount of money flow over time. CMF is used to study the volume of money flow and form the basis for an Accumulation Distribution Line. The Chaikin Money Flow does not tally a cumulative total money flow volume instead it simply sums the money flow volume for a specific trading period.
$BULM BarChart Technical Analysis
http://www.barchart.com/technicals/stocks/BULM
Taxation on ETF’s
ETFs are structured for tax efficiency and can be more attractive than mutual funds. In the U.S., whenever a mutual fund realizes a capital gain that is not balanced by a realized loss, the mutual fund must distribute the capital gains to its shareholders. This can happen whenever the mutual fund sells portfolio securities, whether to reallocate its investments or to fund shareholder redemptions. These gains are taxable to all shareholders, even those who reinvest the gains distributions in more shares of the fund. In contrast, ETFs are not redeemed by holders (instead, holders simply sell their ETF shares on the stock market, as they would a stock, or effect a non-taxable redemption of a creation unit for portfolio securities), so that investors generally only realize capital gains when they sell their own shares or when the ETF trades to reflect changes in the underlying index.[5]
In most cases, ETFs are more tax-efficient than conventional mutual funds in the same asset classes or categories.[42] Because Vanguard's ETFs are a share-class of their mutual funds, they don't get all the tax advantages if there are net redemptions on the mutual fund shares.[43] Although they do not get all the tax advantages, they get an additional advantage from tax loss harvesting any capital losses from net redemptions.[44][45]
In the U.K., ETFs can be shielded from capital gains tax by placing them in an Individual Savings Account or self-invested personal pension, in the same manner as many other shares. Because UK-resident ETFs would be liable for UK corporation tax on non-UK dividends, most ETFs which hold non-UK companies sold to UK investors are issued in Ireland or Luxembourg
A fast EMA responds more quickly than a slow EMA to recent changes in a stock's price. By comparing EMAs of different periods, the MACD line can indicate changes in the trend of a stock. By comparing that difference to an average, an analyst can detect subtle shifts in the stock's trend.
$GDNEF BarChart Technical Analysis
http://www.barchart.com/technicals/stocks/GDNEF
Evening Star
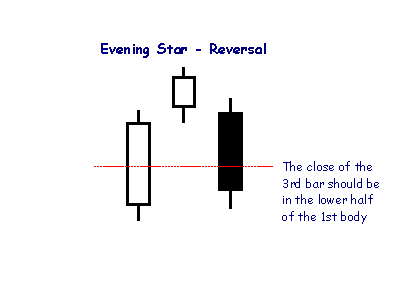
The Evening Star pattern is opposite to Morning Star and is a reversal signal at the end of an up-trend. The pattern is more bearish if the second candlestick is filled rather than hollow.
Positive Divergence: At the same time the price is declining we actually see a longer term Positive Divergence occurring from June to December. This essentially means that the “Gas in the tank of the sellers is slowly reducing”
$HOKU BarChart Technical Analysis
http://www.barchart.com/technicals/stocks/HOKU
Form S-4 ~ SEC Filings Explained
Registration of securities issued in business combination transactions
The Coppock indicator was originally designed for use on a monthly time scale. It is effectively an oscillator calculated from the sum of a 14 month rate of change and 11-month rate of change, smoothed by a 10-period weighted moving average.
$FRCN BarChart Technical Analysis
http://www.barchart.com/technicals/stocks/FRCN
Demark Pivot Points
Demark Pivot Points start with a different base and use different formulas for support and resistance. These Pivot Points are conditional on the relationship between the close and the open.
If Close < Open, then X = High (2 x Low) Close
If Close > Open, then X = (2 x High) Low Close
If Close = Open, then X = High Low (2 x Close)
Pivot Point (P) = X/4
Support 1 (S1) = X/2 - High
Resistance 1 (R1) = X/2 - Low
The chart below shows the Russell 2000 ETF (IWM) with Demark Pivot Points on a 15 minute chart. Notice that there is only one resistance (R1) and one support (S1). Demark Pivot Points do not have multiple support or resistance levels.

MFI starts with the typical price for each period. Money flow is positive when the typical price rises (buying pressure) and negative when the typical price declines (selling pressure).
$KADR BarChart Technical Analysis
http://www.barchart.com/technicals/stocks/KADR
Price Growing: Stock price is in growth mode almost doubling in the first quarter 2008.
Form N-14/A ~ SEC Filings Explained
Initial registration statement for open-end investment company (Amendment)
$CZICF BarChart Technical Analysis
http://www.barchart.com/technicals/stocks/CZICF
Overbought in Down Trend. This scan searches for stocks where the Force Index (100) is in negative territory and the Commodity Channel Index (20) is overbought. A negative Force Index establishes an overall down trend. An overbought CCI identifies a corrective bounce within this down trend. This scan is meant as a starting point. Further scrutiny and adjustment is advised.
Form 8-K~ SEC Filings Explained
Form 8-K is a very broad form used to notify investors of any material event that is important to shareholders or the United States Securities and Exchange Commission. This is one of the most common types of forms filed with the SEC. After a significant event like bankruptcy or departure of a CEO, a public company generally must file a Current Report on Form 8-K within four business days to provide an update to previously filed quarterly reports on Form 10-Qand/or Annual Reports on Form 10-K. Form 8-K is required to be filed by public companies with the SEC pursuant to the Securities Exchange Act of 1934, as amended. For a list of events that would trigger a Form 8-K to be filed, see the Official SEC Form 8-K Summary, reproduced below.
When Form 8-K is required
Form 8-K is used to notify investors of a current event. These types of events include:
? Material definitive agreements not made in the ordinary course of business
? Bankruptcies or receiverships
? Director is elected
? Director departs
? If a director departs because of a disagreement with the company on any matter relating to the registrant’s operations, policies, or practices then an 8-K must be filed to disclose a brief description of the circumstances representing the disagreement.[1]
? Asset movement: acquisition or sale
? Result of operations and financial condition
? Material Direct Financial obligations (bonds, debentures)
? Triggering events that accelerate material obligations (defaults on a loan)
? Exit or disposal plans
? Layoffs
? shutting down a plant
? material change in services or outlets
? Material impairments
? Delisting or transfer exchange notices
? Unregistered equity sales
? Modifications to shareholder rights
? Change in accountant - and good idea to explain why
? SEC investigations and internal reviews
? Financial non-reliance notices
? Changes in control of the company
? Someone takes a large equity position (more than 15%); shareholder also needs to file with SEC as to intent
? Someone takes a 51% position
? Changes in executive management
? Officer leaves
? Officer is fired
? Officer is hired
? Departure or appointment of company officers
? Amendments to company Governance Policies
? Code of Ethics
? Board Committee Governance Policies
? Trading suspension
? Change in credit
? Change in company status
? Other events
? Financial exhibits
Investors should always read any 8-K filings that are made by companies in which they are invested. These reports are both material and relevant to the company, and often contain information that will affect the share price.
Reading Form 8K
Typically an 8-K filing will only have two major parts. They are:
? The name and description of the event - this contains all the information that the company considers relevant to shareholders and the SEC. It is important to read this information, as it has been deemed "material" by the company.
? Any exhibits that are relevant - these exhibits may include financial statements, press releases, data tables, or other information that is referenced in the description of the event.
$RFMK BarChart Technical Analysis
http://www.barchart.com/technicals/stocks/RFMK
With an exponential moving average as its foundation, Keltner Channels are a trend following indicator. As with moving averages and trend following indicators, Keltner Channels lag price action. The direction of the moving average dictates the direction of the channel. In general, a downtrend is present when the channel moves lower, while an uptrend exists when the channel moves higher. The trend is flat when the channel moves sideways.
Hanging Man
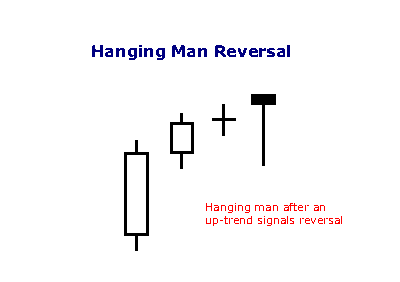
A hammer that occurs after an up trend is called a 'hanging man' and is a bearish signal.
$IXMD BarChart Technical Analysis
http://www.barchart.com/technicals/stocks/IXMD
RSI is considered overbought when above 70 and oversold when below 30. These traditional levels can also be adjusted to better fit the security or analytical requirements. Raising overbought to 80 or lowering oversold to 20 will reduce the number of overbought/oversold readings. Short-term traders sometimes use 2-period RSI to look for overbought readings above 80 and oversold readings below 20.
Form TA-2 ~ SEC Filings Explained
Annual report of transfer agent activities filed pursuant to the Securities Exchange Act of 1934
$MDXG BarChart Technical Analysis
http://www.barchart.com/technicals/stocks/MDXG
Centerline crossovers are the next most common MACD signals. A bullish centerline crossover occurs when the MACD Line moves above the zero line to turn positive. This happens when the 12-day EMA of the underlying security moves above the 26-day EMA. A bearish centerline crossover occurs when the MACD moves below the zero line to turn negative. This happens when the 12-day EMA moves below the 26-day EMA.
|
Followers
|
3289
|
Posters
|
|
|
Posts (Today)
|
0
|
Posts (Total)
|
2804248
|
|
Created
|
08/22/10
|
Type
|
Free
|
| Moderator Nilbud | |||
| Assistants mick ManicTrader PhotoChick Kirimi $Pistol Pete$ | |||
   Investor Hub Alerts: Sign up for 'STOCKGOODIES PLAYS OF THE WEEK ' E-Mail List Investor Hub Alerts: Sign up for 'STOCKGOODIES PLAYS OF THE WEEK ' E-Mail ListUPDATE; 5-1-22 courtesy of charting /\ wit tweezer top calls /\ Tony @Montana_Trades Really good study sheet on Candlestick Patterns [-chart]pbs.twimg.com/media/FRn8188XMAAdZvk?format=jpg&name=small[/chart] 

02-07-2021
|
|
Posts Today
|
0
|
|
Posts (Total)
|
2804248
|
|
Posters
|
|
|
Moderator
|
|
|
Assistants
|
| Volume | |
| Day Range: | |
| Bid Price | |
| Ask Price | |
| Last Trade Time: |


