 News
News  Market Data
  Discover
Support: 888-992-3836
Copyright © 2023 InvestorsHub Inc.


Register for free to join our community of investors and share your ideas. You will also get access to streaming quotes, interactive charts, trades, portfolio, live options flow and more tools.
Fibonacci Pivot Points
Fibonacci Pivot Points start just the same as Standard Pivot Points. From the base Pivot Point, Fibonacci multiples of the high-low differential are added to form resistance levels and subtracted to form support levels.
Pivot Point (P) = (High Low Close)/3
Support 1 (S1) = P - {.382 * (High - Low)}
Support 2 (S2) = P - {.618 * (High - Low)}
Support 3 (S3) = P - {1 * (High - Low)}
Resistance 1 (R1) = P {.382 * (High - Low)}
Resistance 2 (R2) = P {.618 * (High - Low)}
Resistance 3 (R3) = P {1 * (High - Low)}
The chart below shows the Dow Industrials SPDR (DIA) with Fibonacci Pivot Points on a 15 minute chart. R1 and S1 are based on 38.2%. R2 and S2 are based on 61.8%. R3 and S3 are based on 100%.


$GRDO - on the lookout for News this week!
$HYSR BarChart Technical Analysis
http://www.barchart.com/technicals/stocks/HYSR
The Coppock Breadth Indicator, originally known as Trendex's Timing Technique for Texas Traders, is a little known indicator used to identify buy signals from around the bottom of a bear market. It is very good at discriminating between bear market rallies and true bottoms in the stock market and has proven to be remarkably resistant to "whipsaws".
Form 1-E, 1-E/A ~ SEC Filings Explained
Notification under Regulation E by small business investment companies and business development companies (and amendment thereto)
$STAU BarChart Technical Analysis
http://www.barchart.com/technicals/stocks/STAU
The Ulcer index can also be charted over time and used as a kind of technical analysis indicator, to show stocks going into ulcer-forming territory (for one's chosen time-frame), or to compare volatility in different stocks.[3] As with the Sharpe Ratio, a higher value is better than a lower value (investors prefer more return for less risk).
List of Direxion ETF’s
Symbol Fund Index/Benchmark Daily Target Bloomberg Index Symbol
Long Term Investment
ETFs
KNOW
Direxion All Cap Insider Sentiment Shares
Sabrient Multi-Cap Insider/Analyst Quant-Weighted Index - SBRQAM
INSD
Direxion Large Cap Insider Sentiment Shares
Sabrient Large-Cap Insider/Analyst Quant-Weighted Index - SBRQAL
VSPY
Direxion S
$SUTI BarChart Technical Analysis
http://www.barchart.com/technicals/stocks/SUTI
Positive Divergence: At the same time the price is declining we actually see a longer term Positive Divergence occurring from June to December. This essentially means that the “Gas in the tank of the sellers is slowly reducing”
Shooting Star
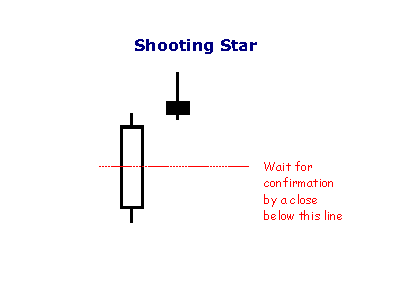
The shooting star is a type of bearish reversal pattern. The Shooting Star looks exactly the same as the Inverted hammer, but instead of being found in a downtrend it is found in an uptrend and thus has different implications. Like the Inverted hammer it is made up of a candle with a small lower body, little or no lower wick, and a long upper wick that is at least two times the size of the lower body.
The long upper wick of the candlestick pattern indicates that the buyers drove prices up at some point during the period in which the candle was formed but encountered selling pressure which drove prices back down for the period to close near to where they opened. As this occurred in an uptrend the selling pressure is seen as a potential reversal sign. When encountering this pattern traders will look for a lower open on the next period before considering the pattern valid and potentially including it in their trading strategy.
As with the Inverted hammer most traders will see a longer wick as a sign of a greater potential reversal and like to see an increase in volume on the day the Shooting Star forms.
$MTLI BarChart Technical Analysis
http://www.barchart.com/technicals/stocks/MTLI
Technical Indicators are the often squiggly lines found above, below and on-top-of the price information on a technical chart. Indicators that use the same scale as prices are typically plotted on top of the price bars and are therefore referred to as "Overlays."
Criticism of ETF’s
John C. Bogle, founder of the Vanguard Group, a leading issuer of index mutual funds (and, since Bogle's retirement, of ETFs), has argued that ETFs represent short-term speculation, that their trading expenses decrease returns to investors, and that most ETFs provide insufficient diversification. He concedes that a broadly diversified ETF that is held over time can be a good investment.
ETFs are dependent on the efficacy of the arbitrage mechanism in order for their share price to track net asset value. While the average deviation between the daily closing price and the daily NAV of ETFs that track domestic indices is generally less than 2%, the deviations may be more significant for ETFs that track certain foreign indices. The Wall Street Journal reported in November 2008, during a period of market turbulence, that some lightly traded ETFs frequently had deviations of 5% or more, exceeding 10% in a handful of cases, although even for these niche ETFs, the average deviation was only a little more than 1%. The trades with the greatest deviations tended to be made immediately after the market opened.
According to a study on ETF returns in 2009 by Morgan Stanley, ETFs missed in 2009 their targets by an average of 1.25 percentage points, a gap more than twice as wide as the 0.52-percentage-point average they posted in 2008. Part of this so-called tracking error is attributed to the proliferation of ETFs targeting exotic investments or areas where trading is less frequent, such as emerging-market stocks, future-contracts based commodity indices and junk bonds.[citation needed]
The tax advantages of ETFs are of no relevance for investors using tax-deferred accounts (or indeed, investors who are tax-exempt in the first place). However, the lower expense ratios are proving difficult for the proponents of traditional mutual funds to overcome.
In a survey of investment professionals, the most frequently cited disadvantage of ETFs was the unknown, untested indices used by many ETFs, followed by the overwhelming number of choices.
Some critics claim that ETFs can be, and have been, used to manipulate market prices, including having been used for short selling that has been asserted by some observers (including Jim Cramer of theStreet.com) to have contributed to the market collapse of 2008
The force index (FI) is an indicator used in technical analysis to illustrate how strong the actual buying or selling pressure is. High positive values mean there is a strong rising trend, and low values signify a strong downward trend.
$AMBEQ BarChart Technical Analysis
http://www.barchart.com/technicals/stocks/AMBEQ
Using Moving Averages to Find Support and Resistance
Moving averages can also act as support in an uptrend and resistance in a downtrend. A short-term uptrend might find support near the 20-day simple moving average, which is also used in Bollinger Bands. A long-term uptrend might find support near the 200-day simple moving average, which is the most popular long-term moving average. If fact, the 200-day moving average may offer support or resistance simply because it is so widely used. It is almost like a self-fulfilling prophecy.

The chart above shows the NY Composite with the 200-day simple moving average from mid 2004 until the end of 2008. The 200-day provided support numerous times during the advance. Once the trend reversed with a double top support break, the 200-day moving average acted as resistance around 9500.
Do not expect exact support and resistance levels from moving averages, especially longer moving averages. Markets are driven by emotion, which makes them prone to overshoots. Instead of exact levels, moving averages can be used to identify support or resistance zones.
The RSI is classified as a momentum oscillator, measuring the velocity and magnitude of directional price movements. Momentum is the rate of the rise or fall in price. The RSI computes momentum as the ratio of higher closes to lower closes: stocks which have had more or stronger positive changes have a higher RSI than stocks which have had more or stronger negative changes.
$TDEY BarChart Technical Analysis
http://www.barchart.com/technicals/stocks/TDEY
ARS~ SEC Filings Explained
Annual Report to Security Holders.
MFI is constructed in a similar fashion to the relative strength index. Both look at up days against total up plus down days, but the scale, i.e. what is accumulated on those days, is volume (or dollar volume approximation rather) for the MFI, as opposed to price change amounts for the RSI.
$GDNEF BarChart Technical Analysis
http://www.barchart.com/technicals/stocks/GDNEF
Even though the MACD does not have upper and lower limits, chartists can estimate historical extremes with a simple visual assessment. It takes a strong move in the underlying security to push momentum to an extreme. Even though the move may continue, momentum is likely to slow and this will usually produce a signal line crossover at the extremities. Volatility in the underlying security can also increase the number of crossovers.
$SELR BarChart Technical Analysis
http://www.barchart.com/technicals/stocks/SELR
Leveraged ETFs
Leveraged exchange-traded funds (LETFs), or simply leveraged ETFs, are a special type of ETF that attempt to achieve returns that are more sensitive to market movements than non-leveraged ETFs.[33] Leveraged index ETFs are often marketed as bull or bear funds. A leveraged bull ETF fund might for example attempt to achieve daily returns that are 2x or 3x more pronounced than the Dow Jones Industrial Average or the S
The MACD "oscillator" or "indicator" is a collection of three signals (or computed data-series), calculated from historical price data, most often the closing price. These three signal lines are: the MACD line, the signal line (or average line), and the difference (or divergence).
$MDXG BarChart Technical Analysis
http://www.barchart.com/technicals/stocks/MDXG
Form 6-K~ SEC Filings Explained
Form 6K is an SEC filing submitted to the US Securities and Exchange Commission used by certain foreign private issuers to provide information that is:
? Required to be made public in the country of its domicile
? Filed with and made public by a foreign stock exchange on which its securities are traded
? Are distributed to security holders.
The report must be furnished promptly after such material is made public. The form is not considered "filed" because of Section 18 (for liability purposes). This is the only information furnished by foreign private issuers between annual reports, since such issuers are not required to file on Forms 10-Q or 8-K.
Raw Money Flow is essentially dollar volume because the formula is volume multiplied by the typical price. Raw Money Flow is positive when the typical price advances from one period to the next and negative when the typical price declines. The Raw Money Flow values are not used when the typical price is unchanged. The Money Flow Ratio in step 3 forms the basis for the Money Flow Index (MFI).
$RYUN BarChart Technical Analysis
http://www.barchart.com/technicals/stocks/RYUN
Hammer and Gravestone
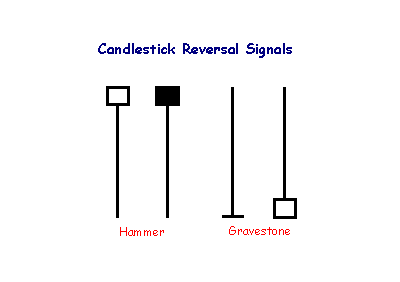
The hammer is not as strong as the dragonfly candlestick, but also signals reversal after a down-trend: control has shifted from sellers to buyers. The shadow of the candlestick should be at least twice the height of the body.
A gravestone is identified by open and close near the bottom of the trading range. The candlestick is the converse of a hammer and signals reversal when it occurs after an up-trend.
$CDFT BarChart Technical Analysis
http://www.barchart.com/technicals/stocks/CDFT
Chaikin Money Flow measures buying and selling pressure for a given period of time. A move into positive territory indicates buying pressure, while a move into negative territory indicates selling pressure. Chartists can use the absolute value of Chaikin Money Flow to confirm or question the price action of the underlying. Positive CMF would confirm an uptrend, but negative CMF would call into question the strength behind an uptrend. The reverse holds true for downtrends.
Form N-30D ~ SEC Filings Explained
Initial annual and semi-annual reports mailed to investment company shareholders
$GLHV BarChart Technical Analysis
http://www.barchart.com/technicals/stocks/GLHV
A negative reversal is the opposite of a positive reversal. RSI forms a higher high, but the security forms a lower high. Again, the higher high is usually just below overbought levels in the 50-70 area. Chart 12 shows Starbucks (SBUX) forming a lower high as RSI forms a higher high. Even though RSI forged a new high and momentum was strong, the price action failed to confirm as lower high formed. This negative reversal foreshadowed the big support break in late June and sharp decline.
Form 11-K, 11-K/A ~ SEC Filings Explained
Annual report of employee stock purchase, savings and similar plans (and amendment thereto)
$MPPCQ BarChart Technical Analysis
http://www.barchart.com/technicals/stocks/MPPCQ
BULLISH GRAVESTONE DOJI
Gravestone Doji is a specific Doji with opening and closing prices equal to the low of the day. The Bullish Gravestone Doji Pattern is a bottom reversal pattern. Similar to its cousin the Bullish Inverted Hammer Pattern, it occurs in a downtrend and represents a possible reversal of trend.
Recognition Criteria:
1. Market is characterized by downtrend.
2. We see a black body formed at the lower end of the trading range.
3. We then see a Doji, which does not have a lower shadow in the second day.
4. No gap down is required.
Explanation:
The market opens below the closing price of the previous day. Then there is a brief rally but the rally is not enough to send prices over the closing price of previous day and prices then reverse direction and fall down to the day’s lows. This movement however leaves shorts in a losing position creating the potential for an upcoming rally. It may not be clear why it signals a potential reversal. The answer has to do with what happens over the next session. If the next day opens above the real body of the Gravestone Doji, it means those who shorted at the opening (or closing) of the Gravestone day are losing money. The longer the market holds above Gravestone Doji’s real body the more likely these shorts will cover. The short will then spark a rally by covering their positions, which also encourage the bottom pickers to go long. The Gravestone Doji represents the graves of those bears that have died defending their territory.
Important Factors:
Bullish Gravestone Doji requires further confirmation on the next day. Confirmation may be in the form of the next day opening above the Gravestone Doji’s body. The larger the gap the stronger the confirmation will be. A white candlestick with higher prices can also be another form of confirmation.
The force of every market movement is characterized by its direction, scale and volume. If the closing price of the current bar is higher than the preceding bar, the force is positive. If the current closing price if lower than the preceding one, the force is negative. The greater the difference in prices is, the greater the force is. The greater the transaction volume is, the greater the force is.
$CRNJF BarChart Technical Analysis
http://www.barchart.com/technicals/stocks/CRNJF
The sharper the movement up or down of the MACD, the stronger the sign is to buy or sell, taking the above recommendations into consideration.
BLACK SPINNING TOP
The Black Spinning Top is a single candlestick pattern. Its shape is a small black body with upper and lower shadows having a greater length than the body's length.
Recognition Criteria:
1. The real body of the pattern is black and small.
2. The upper and lower shadows are longer than the real body's length.
Explanation:
The market moves higher and then sharply lower, or vice versa. It then closes below the opening price creating a black body. This represents complete indecision between the bulls and the bears. The actual length of the shadows is not important. The small body relative to the shadows is what makes the spinning top.
Important Factors:
If a Black Spinning Top is observed after a long rally or long white candlestick, this implies weakness among the bulls and it is a warning about a potential change or interruption in trend.
If a Black Spinning Top is observed after a long decline or a long black candlestick, this implies weakness among the bears and it is a warning about a potential change or interruption in trend.
Like most other single candlestick patterns, the Black Spinning Top has low reliability. It reflects only one day's trading and can be interpreted both as a continuation and a reversal pattern. This pattern must be used with other candlesticks for a better and healthier confirmation of a trend.
$ACDU BarChart Technical Analysis
http://www.barchart.com/technicals/stocks/ACDU
Engulfing Candlesticks
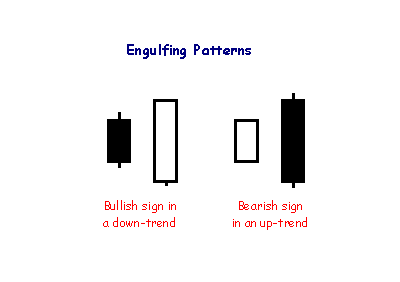
Engulfing patterns are where the body of the second candlestick 'engulfs' the first. They often follow or complete doji, hammer or gravestone patterns and signal reversal in the short-term trend.
MACD is based on moving averages, it is inherently a lagging indicator. However, in this regard the MACD does not lag as much as a basic moving average crossing indicator, since the signal cross can be anticipated by noting the convergence far in advance of the actual crossing. As a metric of price trends, the MACD is less useful for stocks that are not trending (trading in a range) or are trading with erratic price action.
$ASOLF BarChart Technical Analysis
http://www.barchart.com/technicals/stocks/ASOLF
Chester Keltner introduced the "Ten-Day Moving Average Trading Rule," which is credited as the original version of Keltner Channels. This original version started with a 10-day SMA of the typical price {(H L C)/3)} as the centerline. The 10-day SMA of the High-Low range was added and subtracted to set the upper and lower channel lines.
Pivot Points ~ Time Frames
Pivot Points for 1, 5, 10 and 15 minute charts use the prior day's high, low and close. In other words, Pivot Points for today's intraday charts would be based solely on yesterday's high, low and close. Once Pivot Points are set, they do not change and remain in play throughout the day.

Pivot Points for 30 and 60 minute charts use the prior week's high, low and close. These calculations are based on calendar weeks. Once the week starts, the Pivot Points for 30 and 60 minute charts remain fixed for the entire week. They do not change until the week ends and new Pivots can be calculated.

Pivot Points for daily charts use the prior month's data. Pivot Points for June 1st would be based on the high, low and close for May. They remain fixed the entire month of June. New Pivot Points would be calculated on the first trading day of July. These would be based on the high, low and close for June.

Pivot Points for weekly and monthly charts use the prior year's data.
|
Followers
|
3289
|
Posters
|
|
|
Posts (Today)
|
0
|
Posts (Total)
|
2804248
|
|
Created
|
08/22/10
|
Type
|
Free
|
| Moderator Nilbud | |||
| Assistants mick ManicTrader PhotoChick Kirimi $Pistol Pete$ | |||
   Investor Hub Alerts: Sign up for 'STOCKGOODIES PLAYS OF THE WEEK ' E-Mail List Investor Hub Alerts: Sign up for 'STOCKGOODIES PLAYS OF THE WEEK ' E-Mail ListUPDATE; 5-1-22 courtesy of charting /\ wit tweezer top calls /\ Tony @Montana_Trades Really good study sheet on Candlestick Patterns [-chart]pbs.twimg.com/media/FRn8188XMAAdZvk?format=jpg&name=small[/chart] 

02-07-2021
|
|
Posts Today
|
0
|
|
Posts (Total)
|
2804248
|
|
Posters
|
|
|
Moderator
|
|
|
Assistants
|
| Volume | |
| Day Range: | |
| Bid Price | |
| Ask Price | |
| Last Trade Time: |


