 News
News  Market Data
  Discover
Support: 888-992-3836
Copyright © 2023 InvestorsHub Inc.


Register for free to join our community of investors and share your ideas. You will also get access to streaming quotes, interactive charts, trades, portfolio, live options flow and more tools.
BEARISH ADVANCE BLOCK
It is a pattern characterized by three long white candlesticks with consecutively higher closes during an uptrend. The Bearish Advance Block Pattern is similar to the Bullish Three White Soldiers Pattern. The difference is the fact that each successive day is weaker than the one preceding it. This may suggest that the rally is losing strength and a reversal is possible.

Recognition Criteria:
1. Market is characterized by uptrend.
2. We see three adjacent white candlesticks with consecutively higher closes.
3. Each day opens within the previous day's body.
4. Each day’s body is significantly smaller than the body of the previous day.
Explanation:
If the second and the third candlesticks (particularly the third) show signs of weakening, this means that the rally is losing steam and longs must consider protecting their positions. Longs need especially to be careful about the Bearish Advance Block Pattern during a mature uptrend. Signs of weakening are the progressively smaller white real bodies or the relatively long upper shadows on the latter two white candlesticks.
Important Factors:
A definite deterioration in the upward strength is evidenced by long upper shadows on the second and third days.
The Bearish Advance Block Pattern is not normally a top reversal pattern, but it has the potential to precede a meaningful price decline. This pattern is more important at higher price levels. It suggests to liquidate long positions but it is yet early for short positions.
A confirmation of the reversal on the fourth day would provide the needed proof that the uptrend has reversed. A confirmation of the trend reversal by a black candlestick, a large gap down or by a lower close on the next trading day is suggested. 
$NWMT BarChart Technical Analysis
http://www.barchart.com/technicals/stocks/NWMT
M-Tops Using Bollinger Bands
M-Tops were also part of Arthur Merrill's work that identified 16 patterns with a basic M shape. Bollinger uses these various M patterns with Bollinger Bands to identify M Bottoms. According to Bollinger, tops are usually more complicated and drawn out than bottoms. Double tops, head-and-shoulders patterns and diamonds represent evolving tops.
In its most basic form, an M-Top is similar to a double top. However, the reaction highs are not always equal. The first high can be higher or lower than the second high. Bollinger suggests looking for signs of non-confirmation when a security is making new highs. This is basically the opposite of the W-Bottom. A non-confirmation occurs with three steps. First, a security forges a reaction high above the upper band. Second, there is a pullback towards the middle band. Third, prices move above the prior high, but fail to reach the upper band. This is a warning sign. The inability of the second reaction high to reach the upper band shows waning momentum, which can foreshadow a trend reversal. Final confirmation comes with a support break or bearish indicator signal.

The chart shows Exxon Mobil (XOM) with an M-Top in April-May 2008. The stock moved above the upper band in April. There was a pullback in May and then another push above 90. Even though the stock moved above the upper band on an intraday basis, it did not CLOSE above the upper band. The M-Top was confirmed with a support break two weeks later. Also notice that MACD formed a bearish divergence and moved below its signal line for confirmation.
The TRIX is available on many trading and charting platforms, and is added to existing charts in the same fashion as other popular technical analysis tools. However, the TRIX may require some customization appropriate for the time frame being traded. Active traders may desire a TRIX that is more sensitive to price changes. A common default is a 9-period setting, which analyzes less than two weeks of data when applied to a daily chart. As an alternative, a 30-period configuration is more appropriate for investors with a longer time frame in mind.
$AAGC BarChart Technical Analysis
http://www.barchart.com/technicals/stocks/AAGC
Varieties of ETFs
The first ETF was the S
As noted above, there are three elements to the Force Index. First, there is either a positive or negative price change. A positive price change signals that buyers were stronger than sellers, while a negative price change signals that sellers were stronger than buyers. Second, there is the extent of the price change, which is simply the current close less the prior close. The "extent" shows us just how far prices moved. A big advance shows strong buying pressure, while a big decline shows strong selling pressure.
$NHVCF BarChart Technical Analysis
http://www.barchart.com/technicals/stocks/NHVCF
Form TA-2 ~ SEC Filings Explained
Annual report of transfer agent activities filed pursuant to the Securities Exchange Act of 1934
As with all analysis techniques, Keltner Channels should be used in conjunction with other indicators and analysis. Momentum indicators offer a good complement to the trend-following Keltner Channels.
Rising Three Methods
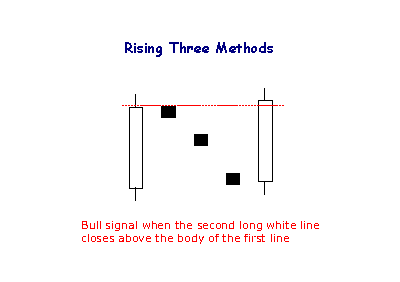
The Rising Method consists of two strong white lines bracketing 3 or 4 small declining black candlesticks. The final white line forms a new closing high. The pattern is definitely bullish.
$CZICF BarChart Technical Analysis
http://www.barchart.com/technicals/stocks/CZICF
The MACD is calculated by subtracting the 26-day exponential moving average (EMA) from the 12-day EMA. A nine-day EMA of the MACD, called the "signal line", is then plotted on top of the MACD, functioning as a trigger for buy and sell signals.
Abandoned Baby (Bullish)

• Direction: Bullish
• Type: Reversal
• Reliability: Strong
• Day-one is a red day continuing an established bear trend.
• Day-two is a doji whose shadows trades below day-ones close.
• Day-three is a blue day that opens and trades above with little or no overlapping shadows
The Abandoned Baby is a rare bullish reversal pattern characterized by a large down move followed by a doji or small candle, and then a third candle heading in the opposite direction.
The formation reflects a classic three period reversal of market sentiment where after a bearish trend, finally enough buyers enter the market to take control. They first stop the trend's momentum (forming the doji), and then ultimately reverse the direction of the market.
This first red candle suggests a continuation of the bear market. That move is followed by a doji, where markets trade in a small range suggesting uncertainty in trend and a rally potential. Up to day two we actually have a Bullish Doji Star, moderate strength bullish pattern. After the day of indecision, a large bullish candle confirms buyers are staging a rally and reversal. The stronger the move up day-three, the stronger the reversal signal. Watch for additional bullish price action in the next few days.
$HRRN BarChart Technical Analysis
http://www.barchart.com/technicals/stocks/HRRN
Indicators can be displayed in additional panels above or below the main price panel, or in some case right on the chart behind price. To add an indicator, simply select it in the dropdown list, modify any of the default parameters if so desired, and select the position where it should appear (Below, Above or Behind Price). Many of the indicators have complicated formulas, and entire books can and have been written on several of them. As such, below is a list of each indicator with only a quick description of each.
BULLISH HOMING PIGEON
Bullish Homing Pigeon Pattern is a small black real body contained by a prior relatively long black real body.
Recognition Criteria:
1. Market is in downtrend.
2. We see a black body in the first day.
3. Then we again see a black body in the second day where the real body of this second day is completely engulfed by the real body of the first day. It is not required that the shadows (high/low) of the second candlestick are contained within the first, though it's preferable if they are.
Explanation:
The Bullish Homing Pigeon Pattern is a signal of disparity. In a market characterized by downtrend, we first see heavy selling reflected by the long, black real body of the first day. However small body of second day points out to diminished power and enthusiasm of the sellers thus suggesting a trend reversal.
Important Factors:
The important fact about this pattern is the requirement that the second day has a minute real body relative to the prior candlestick and that this small body is completely contained by the larger one. The Bullish Homing Pigeon Pattern is not necessarily a signal for a rally. Market usually has a tendency to enter into a congestion phase following a Homing Pigeon.
We must check the third day to confirm that the downtrend has reversed. This confirmation may be in the form of a white candlestick, a large gap up or a higher close on the next trading day (on the third day).
$LUSI BarChart Technical Analysis
http://www.barchart.com/technicals/stocks/LUSI
The term "MACD" may be used to refer to the indicator as a whole, or specifically to the MACD line itself. The first line, called the "MACD line", equals the difference between a "fast" (short period) exponential moving average (EMA), and a "slow" (longer period) EMA.
BULLISH GRAVESTONE DOJI
Gravestone Doji is a specific Doji with opening and closing prices equal to the low of the day. The Bullish Gravestone Doji Pattern is a bottom reversal pattern. Similar to its cousin the Bullish Inverted Hammer Pattern, it occurs in a downtrend and represents a possible reversal of trend.
Recognition Criteria:
1. Market is characterized by downtrend.
2. We see a black body formed at the lower end of the trading range.
3. We then see a Doji, which does not have a lower shadow in the second day.
4. No gap down is required.
Explanation:
The market opens below the closing price of the previous day. Then there is a brief rally but the rally is not enough to send prices over the closing price of previous day and prices then reverse direction and fall down to the day’s lows. This movement however leaves shorts in a losing position creating the potential for an upcoming rally. It may not be clear why it signals a potential reversal. The answer has to do with what happens over the next session. If the next day opens above the real body of the Gravestone Doji, it means those who shorted at the opening (or closing) of the Gravestone day are losing money. The longer the market holds above Gravestone Doji’s real body the more likely these shorts will cover. The short will then spark a rally by covering their positions, which also encourage the bottom pickers to go long. The Gravestone Doji represents the graves of those bears that have died defending their territory.
Important Factors:
Bullish Gravestone Doji requires further confirmation on the next day. Confirmation may be in the form of the next day opening above the Gravestone Doji’s body. The larger the gap the stronger the confirmation will be. A white candlestick with higher prices can also be another form of confirmation.
$ANDI BarChart Technical Analysis
http://www.barchart.com/technicals/stocks/ANDI
Buy Signal: MACD broke through the line of resistance: here we see the MACD breaking strongly past its previous high. I plotted a Trend Line in Orange to show this clearly.
$LIQT BarChart Technical Analysis
http://www.barchart.com/technicals/stocks/LIQT
SEC Filings Explained ~ POS AM Form
Post-effective amendments to provide updated prospectus information.
Chaikin Money Flow sometimes only briefly crosses the zero line with a move that turns the indicator barely positive or negative. There is no follow through and this zero line cross ends up becoming a whipsaw (bad signal). Chartists can filter these signals with buffers by setting the bullish threshold a little above zero ( .05) and the bearish threshold a little below zero (-.05). These thresholds will not entirely eliminate bad signals, but can help reduce whipsaws and filter out weaker signals.
$IMSC BarChart Technical Analysis
http://www.barchart.com/technicals/stocks/IMSC
iShares
iShares is Barclay's (Barclay's Global Investors "BGI") brand of ETFs. In 2009 there were approximately 350 iShares trading with around $300 billion under management. Barclay has put out a number of iShares that follow many of the major indexes around the world including the Nasdaq, NYSE, Dow Jones, and Standard
The ulcer index is a stock market risk measure or technical analysis indicator devised by Peter Martin in 1987,[1] and published by him and Byron McCann in their 1989 book The Investors Guide to Fidelity Funds. It's designed as a measure of volatility, but only volatility in the downward direction, i.e. the amount of drawdown or retracement occurring over a period.
$BPWRF BarChart Technical Analysis
http://www.barchart.com/technicals/stocks/BPWRF
BLACK SPINNING TOP
The Black Spinning Top is a single candlestick pattern. Its shape is a small black body with upper and lower shadows having a greater length than the body's length.
Recognition Criteria:
1. The real body of the pattern is black and small.
2. The upper and lower shadows are longer than the real body's length.
Explanation:
The market moves higher and then sharply lower, or vice versa. It then closes below the opening price creating a black body. This represents complete indecision between the bulls and the bears. The actual length of the shadows is not important. The small body relative to the shadows is what makes the spinning top.
Important Factors:
If a Black Spinning Top is observed after a long rally or long white candlestick, this implies weakness among the bulls and it is a warning about a potential change or interruption in trend.
If a Black Spinning Top is observed after a long decline or a long black candlestick, this implies weakness among the bears and it is a warning about a potential change or interruption in trend.
Like most other single candlestick patterns, the Black Spinning Top has low reliability. It reflects only one day's trading and can be interpreted both as a continuation and a reversal pattern. This pattern must be used with other candlesticks for a better and healthier confirmation of a trend.
The force index is calculated by subtracting yesterday’s close from today’s close and multiplying the result by today’s volume. Force Index = (Today’s Closing Price – Yesterday’s Closing Price) * Today’s Volume.
$NWPP BarChart Technical Analysis
http://www.barchart.com/technicals/stocks/NWPP
Currency ETFs or ETCs
In 2005, Rydex Investments launched the first ever currency ETF called the Euro Currency Trust (NYSE: FXE) in New York. Since then Rydex has launched a series of funds tracking all major currencies under their brand CurrencyShares. In 2007Deutsche Bank's db x-trackers launched EONIA Total Return Index ETF in Frankfurt tracking the euro, and later in 2008 the Sterling Money Market ETF (LSE: XGBP) and US Dollar Money Market ETF (LSE: XUSD) in London. In 2009, ETF Securitieslaunched the world's largest FX platform tracking the MSFXSM Index covering 18 long or short USD ETC vs. single G10 currencies. The funds are total return products where the investor gets access to the FX spot change, local institutional interest rates and a collateral yield.
The Force Index is uses both price and volume to measure buying and selling pressure. The price portion covers the trend, while the volume portion determines the intensity. At its most basic, chartists can use a long-term Force Index to confirm the underlying trend.
Golden Cross
A Golden Cross is when a shorter term moving average crosses above a longer term moving average, for example a 20 day SMA crossing over a 50 day SMA. A golden cross indicates a bullish trend, especially when it is coupled with higher trading volume. As well as being a trend indicator, the longer term moving average becomes a support line as the price rises.
The chart below shows a 20/50 SMA Golden cross:
20 SMA is in Red
50 SMA is in Blue

$INAR BarChart Technical Analysis
http://www.barchart.com/technicals/stocks/INAR
The RSI roller-coaster is almost always in the market, as the rule for the liquidation of a long trigger is the creation of a fresh short position. The only two times this setup stays out of the market is when the trader is stopped out of his position on a false signal or when he is stopped out at break-even on the second half of his position.
List of Direxion ETF’s
Symbol Fund Index/Benchmark Daily Target Bloomberg Index Symbol
Long Term Investment
ETFs
KNOW
Direxion All Cap Insider Sentiment Shares
Sabrient Multi-Cap Insider/Analyst Quant-Weighted Index - SBRQAM
INSD
Direxion Large Cap Insider Sentiment Shares
Sabrient Large-Cap Insider/Analyst Quant-Weighted Index - SBRQAL
VSPY
Direxion S
$IXEH BarChart Technical Analysis
http://www.barchart.com/technicals/stocks/IXEH
There are two commonly accepted ways of determining buy and sell signals from a Coppock Curve.
The first is to trade on reversals from extremes. When the indicator was published in Barron’s (1962), it was intended to generate buy signals in the S
Form N-23C3A ~ SEC Filings Explained
Notification of periodic repurchase offer Filed pursuant to Rule 23c-3(b) only
$ABCP BarChart Technical Analysis
http://www.barchart.com/technicals/stocks/ABCP
When the MACD falls below the signal line, it is a bearish signal, which indicates that it may be time to sell. Conversely, when the MACD rises above the signal line, the indicator gives a bullish signal, which suggests that the price of the asset is likely to experience upward momentum. Many traders wait for a confirmed cross above the signal line before entering into a position to avoid getting getting "faked out" or entering into a position too early, as shown by the first arrow.
BEARISH BELT HOLT
The Bearish Belt Hold Pattern is a single candlestick pattern and it is basically a Black Opening Marubozu that occurs in an uptrend. The pattern shows that the day opens on its high, it then rallies against the trend of the market, and then closes near its low but not necessarily at its low. Longer bodies for Belt Hold are indicative of more resistance to the trend they are countering.

Recognition Criteria:
1. There is an overall uptrend in the market.
2. The day gaps up and prices open on their high but then prices move down closing near its low for the day.
3. We then see a black body characterized by the absence of upper shadow, which is called a Black Opening Marubozu.
Explanation:
We have a market that is trending up when a significant gap in the direction of trend occurs as the day opens. However; then prices reverse direction and all further price action of the day is the opposite of the previous trend. Such a move causes concern among the bulls and leads them to sell many positions. This strengthens the reversal and turns into a sell-off.
Important Factors:
A confirmation of the trend reversal with either a black candlestick, a large gap down or a lower close on the next trading day is required.
$ENTB BarChart Technical Analysis
http://www.barchart.com/technicals/stocks/ENTB
The triple-smoothed EMA is very different from a plain EMA. In a plain EMA the latest few days dominate and the EMA follows recent prices quite closely; however, applying it three times results in weightings spread much more broadly, and the weights for the latest few days are in fact smaller than those of days further past. The following graph shows the weightings for an N=10 triple EMA (most recent days at the left).
FOUR PRICE DOJI
The Four Price Doji is a single candlestick pattern. It is simply a horizontal line that has no upper or lower shadows.

Recognition Criteria:
1. The body is a horizontal line.
2. There are no upper or lower shadows at all.
3. The open, close, high and low are the same throughout the entire day.
Explanation:
A Four Price Doji is a very rare occurrence and it may be seen only if all the four price components are equal. That is, the open, high, low, and close turn out to be the same. It represents complete and total uncertainty by traders concerning the market direction.
Important Factors:
The Four Price Doji usually occurs when a stock is very illiquid, has low volume, or the data source do not report any other price other than the closing price.
The Four Price Doji is not reliable like most other single candlestick patterns. It only reflects one day's trading and conveys a sense of complete indecision. It usually is interpreted as a reversal pattern however this indicator must be used with other candlesticks for a healthier judgment about the course of the trend.
Like all other doji types, Four Price Doji is also important only in markets where there are not many doji. In a chart characterized by many doji, the emergence of Four Price Doji do not have a signal value.
$XCHO BarChart Technical Analysis
http://www.barchart.com/technicals/stocks/XCHO
TRIX is negative as long as the triple-smoothed 15-day EMA is moving lower. TRIX turns positive when the triple-smoothed 15-day EMA turns up. The extra smoothing insures that up turns and down turns are kept to a minimum. In other words, it takes more than a one-day advance to reverse a downtrend.
Form 18-K, 18-K/A ~ SEC Filings Explained
Annual report for foreign governments (and amendment thereto)
|
Followers
|
3289
|
Posters
|
|
|
Posts (Today)
|
0
|
Posts (Total)
|
2804248
|
|
Created
|
08/22/10
|
Type
|
Free
|
| Moderator Nilbud | |||
| Assistants mick ManicTrader PhotoChick Kirimi $Pistol Pete$ | |||
   Investor Hub Alerts: Sign up for 'STOCKGOODIES PLAYS OF THE WEEK ' E-Mail List Investor Hub Alerts: Sign up for 'STOCKGOODIES PLAYS OF THE WEEK ' E-Mail ListUPDATE; 5-1-22 courtesy of charting /\ wit tweezer top calls /\ Tony @Montana_Trades Really good study sheet on Candlestick Patterns [-chart]pbs.twimg.com/media/FRn8188XMAAdZvk?format=jpg&name=small[/chart] 

02-07-2021
|
|
Posts Today
|
0
|
|
Posts (Total)
|
2804248
|
|
Posters
|
|
|
Moderator
|
|
|
Assistants
|
| Volume | |
| Day Range: | |
| Bid Price | |
| Ask Price | |
| Last Trade Time: |


