 News
News  Market Data
  Discover
Support: 888-992-3836
Copyright © 2023 InvestorsHub Inc.


Register for free to join our community of investors and share your ideas. You will also get access to streaming quotes, interactive charts, trades, portfolio, live options flow and more tools.
The MACD is only as useful as the context in which it is applied. An analyst might apply the MACD to a weekly scale before looking at a daily scale, in order to avoid making short term trades against the direction of the intermediate trend.[3] Analysts will also vary the parameters of the MACD to track trends of varying duration. One popular short-term set-up, for example, is the (5,35,5).
Form 6-K~ SEC Filings Explained
Form 6K is an SEC filing submitted to the US Securities and Exchange Commission used by certain foreign private issuers to provide information that is:
? Required to be made public in the country of its domicile
? Filed with and made public by a foreign stock exchange on which its securities are traded
? Are distributed to security holders.
The report must be furnished promptly after such material is made public. The form is not considered "filed" because of Section 18 (for liability purposes). This is the only information furnished by foreign private issuers between annual reports, since such issuers are not required to file on Forms 10-Q or 8-K.

$GMXS BarChart Technical Analysis
http://www.barchart.com/technicals/stocks/GMXS
The Chaikin Money Flow (CMF) measures the amount of money flow over time. CMF is used to study the volume of money flow and form the basis for an Accumulation Distribution Line. The Chaikin Money Flow does not tally a cumulative total money flow volume instead it simply sums the money flow volume for a specific trading period.
Doji Star
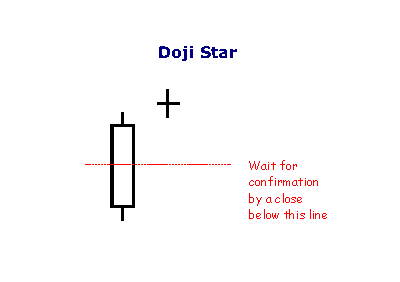
A Doji Star is weaker than the Morning or Evening Star: the doji represents indecision. The doji star requires confirmation from the next candlestick closing in the bottom half of the body of the first candlestick.
The Rate-of-Change indicator is a momentum oscillator that oscillates above and below the zero line. Coppock used 11 and 14 periods because, according to an Episcopal priest, this was the average mourning period when grieving the loss of a loved one. Coppock theorized that the recovery period for stock market losses would be similar to this time frame.
$SBRH BarChart Technical Analysis
http://www.barchart.com/technicals/stocks/SBRH
Evening Star
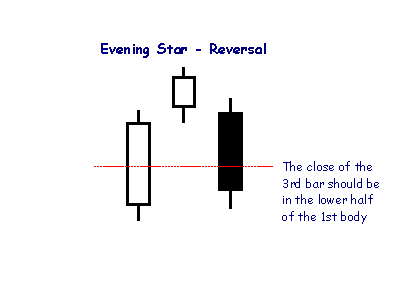
The Evening Star pattern is opposite to Morning Star and is a reversal signal at the end of an up-trend. The pattern is more bearish if the second candlestick is filled rather than hollow.
The key to the RSI strategy - versus the traditional interpretation of RSI, which simply trades overbought or oversold levels - is to first look for a reversal candle, which provides us with a sign of exhaustion before taking the trade. This way, we are prevented from prematurely picking a top or bottom and instead we wait for indicator confirmation.
$GHRI BarChart Technical Analysis
http://www.barchart.com/technicals/stocks/GHRI
Form N-8F ~ SEC Filings Explained
Application for deregistration made on Form N-8F
$HOKU BarChart Technical Analysis
http://www.barchart.com/technicals/stocks/HOKU
The Coppock Curve is simply a smoothed momentum oscillator. The Rate-of-Change indicator measures momentum and the weighted moving average smooths the data. This means the indicator can be used on any timeframe. Intraday, daily and weekly data can be used to fit one's trading/investing style and time horizon.
THREE INSIDE DOWN (Bearish)
The Bearish Three Inside Down Pattern is another name for the Confirmed Bearish Harami Pattern. The third day confirms the bearish trend reversal.
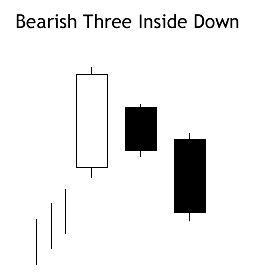
Recognition Criteria:
1. Market is characterized by uptrend.
2. We see a Bearish Harami Pattern in the first two days.
3. We then see a black candlestick on the third day with a lower close than the second day.
Explanation:
The first two days of this three-day pattern is a Bearish Harami Pattern, and the third day confirms the reversal suggested by Bearish Harami Pattern since it is a black candlestick closing with a new low for the three days.
Important Factors:
The reliability of this pattern is very high, but still a confirmation in the form of a black candlestick with a lower close or a gap-down is suggested.
$ARNH BarChart Technical Analysis
http://www.barchart.com/technicals/stocks/ARNH
Volume - The volume data for a specific ticker. Volume can be displayed as an overlay behind price or in its own individual panel.
Form 15-15D, 15-15D/A ~ SEC Filings Explained
Notice of suspension of duty to file reports pursuant to Section 13 and 15(d) of the Act (and amendment thereto)
The Sharpe Ratio is used to measure risk-adjusted return. It is simply total return less the risk-free return divided by the standard deviation. As noted above, the standard deviation is considered inferior because it accounts for both upside and downside volatility. Long only investors are not concerned with upside volatility. It is the downside volatility that produces drawdowns and stomach ulcers.
$EDIG BarChart Technical Analysis
http://www.barchart.com/technicals/stocks/EDIG
ETFs compared to mutual funds
Cost Factors on ETF’s
Because ETFs trade on an exchange, each transaction is generally subject to a brokerage commission. Commissions depend on the brokerage and which plan is chosen by the customer. For example, a typical flat fee schedule from an online brokerage firm in the United States ranges from $10 to $20, but it can be as low as $0 with discount brokers. Due to this commission cost, the amount invested has a great bearing; someone who wishes to invest $100 per month may have a significant percentage of their investment destroyed immediately, while for someone making a $200,000 investment, the commission cost may be negligible. Generally, mutual funds obtained directly from the fund company itself do not charge a brokerage fee. Thus when low or no-cost transactions are available, ETFs become very competitive.
ETFs have a lower expense ratio than comparable mutual funds. Not only does an ETF have lower shareholder-related expenses, but because it does not have to invest cash contributions or fund cash redemptions, an ETF does not have to maintain a cash reserve for redemptions and saves on brokerage expenses. Mutual funds can charge 1% to 3%, or more; index fund expense ratios are generally lower, while ETFs are almost always in the 0.1% to 1% range. Over the long term, these cost differences can compound into a noticeable difference.
The cost difference is more evident when compared with mutual funds that charge a front-end or back-end load as ETFs do not have loads at all. The redemption fee and short-term trading fees are examples of other fees associated with mutual funds that do not exist with ETFs. Traders should be cautious if they plan to trade inverse and leveraged ETFs for short periods of time. Close attention should be paid to transaction costs and daily performance rates as the potential combined compound loss can sometimes go unrecognized and offset potential gains over a longer period of time
Indicators based on channels, bands and envelopes are designed to encompass most price action. Therefore, moves above or below the channel lines warrant attention because they are relatively rare. Trends often start with strong moves in one direction or another. A surge above the upper channel line shows extraordinary strength, while a plunge below the lower channel line shows extraordinary weakness. Such strong moves can signal the end of one trend and the beginning of another.
$GTRL BarChart Technical Analysis
http://www.barchart.com/technicals/stocks/GTRL
Leveraged ETFs
Leveraged exchange-traded funds (LETFs), or simply leveraged ETFs, are a special type of ETF that attempt to achieve returns that are more sensitive to market movements than non-leveraged ETFs.[33] Leveraged index ETFs are often marketed as bull or bear funds. A leveraged bull ETF fund might for example attempt to achieve daily returns that are 2x or 3x more pronounced than the Dow Jones Industrial Average or the S
$CTSO BarChart Technical Analysis
http://www.barchart.com/technicals/stocks/CTSO
RSI is a versatile momentum oscillator that has stood the test of time. Despite changes in volatility and the markets over the years, RSI remains as relevant now as it was in Wilder's days. While Wilder's original interpretations are useful to understanding the indicator, the work of Brown and Cardwell takes RSI interpretation to a new level.
Form 11-KT, 11-KT/A ~ SEC Filings Explained
Transition report pursuant to Rule 13a-10 or 15d-10 (and amendment thereto)
A fast EMA responds more quickly than a slow EMA to recent changes in a stock's price. By comparing EMAs of different periods, the MACD line can indicate changes in the trend of a stock. By comparing that difference to an average, an analyst can detect subtle shifts in the stock's trend.
$GGABF BarChart Technical Analysis
http://www.barchart.com/technicals/stocks/GGABF
Bond ETFs
Exchange-traded funds that invest in bonds are known as bond ETFs. They thrive during economic recessions because investors pull their money out of the stock market and into bonds (for example, government treasury bonds or those issues by companies regarded as financially stable). Because of this cause and effect relationship, the performance of bond ETFs may be indicative of broader economic conditions.[22] There are several advantages to bond ETFs such as the reasonable trading commissions, but this benefit can be negatively offset by fees if bought and sold through a third party
The Coppock indicator was originally designed for use on a monthly time scale. It is effectively an oscillator calculated from the sum of a 14 month rate of change and 11-month rate of change, smoothed by a 10-period weighted moving average.
$FROG BarChart Technical Analysis
http://www.barchart.com/technicals/stocks/FROG
$ABBY BarChart Technical Analysis
http://www.barchart.com/technicals/stocks/ABBY
Inverted Hammer

The Inverted Hammer is a type of bullish reversal pattern. As its name implies, the Inverted Hammer looks like an upside down version of the hammer candlestick pattern. Like the hammer candlestick pattern, the Inverted Hammer consists of one candle and when found in a downtrend is considered a potential reversal pattern.
The pattern is made up of a candle with a small lower body and a long upper wick which is at least two times as large as the short lower body. The body of the candle should be at the low end of the trading range and there should be little or no lower wick in the candle.

The long upper wick of the candlestick pattern indicates that the buyers drove prices up at some point during the period in which the candle was formed but encountered selling pressure which drove prices back down for the period to close near to where they opened. As this occurred in an uptrend the selling pressure is seen as a potential reversal sign. When encountering the Inverted Hammer traders will look for a higher open on the next period before considering the pattern confirmed and potentially including it in their trading strategy.
The RSI is most typically used on a 14 day time-frame, measured on a scale from 0 to 100, with high and low levels marked at 70 and 30, respectively. Shorter or longer time frames are used for alternately shorter or longer outlooks. More extreme high and low levels—80 and 20, or 90 and 10—occur less frequently but indicate stronger momentum.
The Money Flow Index (MFI) is an oscillator that uses both price and volume to measure buying and selling pressure. Created by Gene Quong and Avrum Soudack, MFI is also known as volume-weighted RSI.
Form 10-12G, 10-12G/A ~ SEC Filings Explained
Initial general form for registration of a class of securities pursuant to section 12(g) (and amendment thereto)
$ZMRK BarChart Technical Analysis
http://www.barchart.com/technicals/stocks/ZMRK
There are three steps to calculating Keltner Channels. First, select the length for the exponential moving average. Second, choose the time periods for the Average True Range (ATR). Third, choose the multiplier for the Average True Range.
Moving Average Lengths and Timeframes
The length of the moving average depends on the analytical objectives. Short moving averages (5-20 periods) are best suited for short-term trends and trading. Chartists interested in medium-term trends would opt for longer moving averages that might extend 20-60 periods. Long-term investors will prefer moving averages with 100 or more periods.
Some moving average lengths are more popular than others. The 200-day moving average is perhaps the most popular. Because of its length, this is clearly a long-term moving average. Next, the 50-day moving average is quite popular for the medium-term trend. Many chartists use the 50-day and 200-day moving averages together. Short-term, a 10-day moving average was quite popular in the past because it was easy to calculate. One simply added the numbers and moved the decimal point.
$AMBEQ BarChart Technical Analysis
http://www.barchart.com/technicals/stocks/AMBEQ
AMD has the higher ulcer index rather than the INTC so consequently it is the price information. The ulcer index focuses its real strength only on the downside risk. Stocks that are gapping up to 10% can affect the calculation of standard deviation similar with the stocks that break down to 10%. Though, if the majority of the investors are long stock, then it is viewed with joy while the gap down viewed with horror. Ulcer index indicator is a major measure of risk downside rather than simple variance calculation and standard deviation.
Form T-3 ~ SEC Filings Explained
Initial application for qualification of trust indentures
$SURE BarChart Technical Analysis
http://www.barchart.com/technicals/stocks/SURE
The Ulcer index is based on a given past period of N days. Working from oldest to newest a highest price (highest closing price) seen so-far is maintained, and any close below that is a retracement, expressed as a percentage.
Using Moving Averages to Find Support and Resistance
Moving averages can also act as support in an uptrend and resistance in a downtrend. A short-term uptrend might find support near the 20-day simple moving average, which is also used in Bollinger Bands. A long-term uptrend might find support near the 200-day simple moving average, which is the most popular long-term moving average. If fact, the 200-day moving average may offer support or resistance simply because it is so widely used. It is almost like a self-fulfilling prophecy.

The chart above shows the NY Composite with the 200-day simple moving average from mid 2004 until the end of 2008. The 200-day provided support numerous times during the advance. Once the trend reversed with a double top support break, the 200-day moving average acted as resistance around 9500.
Do not expect exact support and resistance levels from moving averages, especially longer moving averages. Markets are driven by emotion, which makes them prone to overshoots. Instead of exact levels, moving averages can be used to identify support or resistance zones.
RSI tends to fluctuate between 10 and 60 in a bear market (downtrend) with the 50-60 zone acting as resistance. Chart 10 shows 14-day RSI for the US Dollar Index ($USD) during its 2009 downtrend. RSI moved to 30 in March to signal the start of a bear range. The 40-50 zone subsequently marked resistance until a breakout in December.
Form 20-F ~ SEC Filings Explained
Form 20-F is an SEC filing submitted to the US Securities and Exchange Commission used by certain foreign private issuers to provide information.
20-F, 20-F/A Annual and transition report of foreign private issuers pursuant to sections 13 or 15(d)
20FR12B, 20FR12B/A Form for initial registration of a class of securities of foreign private issuers pursuant to section 12(b)
20FR12G, 20FR12G/A Form for initial registration of a class of securities of foreign private issuers pursuant to section 12(g)
The postfix /A stands for 'Amendment'
The report must be filed within six months after the end of the fiscal year.
MFI is used as an oscillator. A value of 80 is generally considered overbought, or a value of 20 oversold. Divergences between MFI and price action are also considered significant, for instance if price makes a new rally high but the MFI high is less than its previous high then that may indicate a weak advance, likely to reverse.
Pivot Points ~ Setting the Tone
The Pivot Point sets the general tone for price action. This is the middle line of the group that is marked (P). A move above the Pivot Point is positive and shows strength. Keep in mind that this Pivot Point is based on the prior period's data. It is put forth in the current period as the first important level. A move above the Pivot Point suggests strength with a target to the first resistance. A break above first resistance shows even more strength with a target to the second resistance level.

The converse is true on the downside. A move below the Pivot Point suggests weakness with a target to the first support level. A break below the first support level shows even more weakness with a target to the second support level.
Keltner Channels are a trend following indicator designed to identify the underlying trend. Trend identification is more than half the battle. The trend can be up, down or flat.
|
Followers
|
3289
|
Posters
|
|
|
Posts (Today)
|
0
|
Posts (Total)
|
2804248
|
|
Created
|
08/22/10
|
Type
|
Free
|
| Moderator Nilbud | |||
| Assistants mick ManicTrader PhotoChick Kirimi $Pistol Pete$ | |||
   Investor Hub Alerts: Sign up for 'STOCKGOODIES PLAYS OF THE WEEK ' E-Mail List Investor Hub Alerts: Sign up for 'STOCKGOODIES PLAYS OF THE WEEK ' E-Mail ListUPDATE; 5-1-22 courtesy of charting /\ wit tweezer top calls /\ Tony @Montana_Trades Really good study sheet on Candlestick Patterns [-chart]pbs.twimg.com/media/FRn8188XMAAdZvk?format=jpg&name=small[/chart] 

02-07-2021
|
|
Posts Today
|
0
|
|
Posts (Total)
|
2804248
|
|
Posters
|
|
|
Moderator
|
|
|
Assistants
|
| Volume | |
| Day Range: | |
| Bid Price | |
| Ask Price | |
| Last Trade Time: |


