 News
News  Market Data
  Discover
Support: 888-992-3836
Copyright © 2023 InvestorsHub Inc.


Register for free to join our community of investors and share your ideas. You will also get access to streaming quotes, interactive charts, trades, portfolio, live options flow and more tools.
Behold the $IJJP BarChart Trader's Cheat Sheet NITE-LYNX
http://www.barchart.com/cheatsheet.php?sym=IJJP

More On $HUIY At PennyStock Tweets
http://www.pennystocktweets.com/stocks/profile/HUIY

For thou convenience $ROSV BarChart Trader's Cheat Sheet NITE-LYNX
http://www.barchart.com/cheatsheet.php?sym=ROSV
Intermarket analysis is a branch of technical analysis that examines the correlations between four major asset classes: stocks, bonds, commodities and currencies.

Successful traders have a well-scheduled planned time for studying the markets.
For All Your $MNEAF DD ~ Use PennyStock Tweets
http://www.pennystocktweets.com/stocks/profile/MNEAF
Feast thine eyes upon $ICTY BarChart Trader's Cheat Sheet NITE-LYNX
http://www.barchart.com/cheatsheet.php?sym=ICTY
By the time the price reaches the support level, it is believed that demand will overcome supply and prevent the price from falling below support.

Level 2 market data is also known as the order book. When orders are placed, they are placed through many different market makers and other market participants. Level 2 will show you a ranked list of the best bid and ask prices from each of these participants, giving you detailed insight into the price action, including the market depth. Knowing exactly who has an interest in a stock can be extremely useful, especially if you are day trading. 
Use PennyStock Tweets For All Your $VDSC DD
http://www.pennystocktweets.com/stocks/profile/VDSC
$AMNF BarChart Trader's Cheat Sheet NITE-LYNX
http://www.barchart.com/cheatsheet.php?sym=AMNF
Technical analysis is not an exact science and it is sometimes difficult to set exact support levels.
Keep your technical systems simple. Complicated systems breed confusion; simplicity breeds elegance.
For All Your $BPWRF DD ~ Use PennyStock Tweets
http://www.pennystocktweets.com/stocks/profile/BPWRF
NITE-LYNX $GLCO BarChart Trader's Cheat Sheet
http://www.barchart.com/cheatsheet.php?sym=GLCO
Bonds decline under these circumstances and rise when the economy is weak and/or deflationary pressures are building. A ratio of the two can provide further insights into economic strength/weakness or inflation/deflation.
Respect "outside reversals" after extended bull or bear runs. Reversal days on the charts signal the final exhaustion of the bullish or bearish forces that drove the market previously. Respect them, and respect even more "weekly" and "monthly," reversals.
For All Your $CMRZF DD ~ Use PennyStock Tweets
http://www.pennystocktweets.com/stocks/profile/CMRZF
Behold the $AAIR BarChart Trader's Cheat Sheet NITE-LYNX
http://www.barchart.com/cheatsheet.php?sym=AAIR
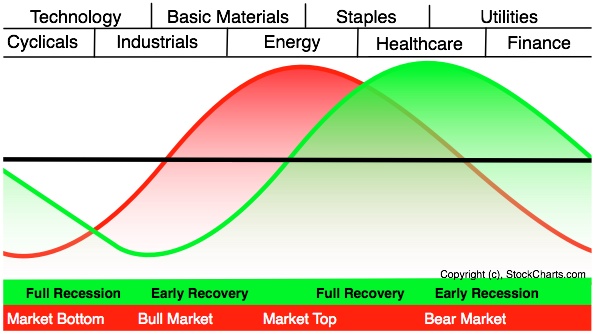
Sector Rotation
Unsurprisingly, the business cycle influences the rotation of stock market sectors and industry groups. Certain sectors perform better than others during specific phases of the business cycle. Knowing the stage of the business cycle can help investors position themselves in the right sectors and avoid the wrong
sectors.
$PREV Profile on PST - For All Your DD Use More http://www.pennystocktweets.com/stocks/stockprofile/PREV
If you love the very idea of fundamental research, then day trading is probably not for you. Day trading requires quick responses to price changes, not a careful understanding of accounting methods and business trends. A little fundamental analysis can be helpful in day trading, but a lot can slow you down.
BarChart Trader's Cheat Sheet $HCEI NITE-LYNX
http://www.barchart.com/cheatsheet.php?sym=HCEI
This means stocks rise when bonds fall and visa versa. By extension, this also means that stocks have a positive relationship with interest rates. Yes, stocks and interest rates rise together.


Check Out $BTHR On PennyStock Tweets
http://www.pennystocktweets.com/stocks/profile/BTHR
Keep A Trading Log. Even if you never use it for analyzing your trades, a journal provide a written reminder of your ability to stick with your trading plan. To boot, it's in your own handwriting, which can be pretty persuasive if self-doubt starts to creep in while you're in a trade
Feast thine eyes upon $SYNJ BarChart Trader's Cheat Sheet NITE-LYNX
http://www.barchart.com/cheatsheet.php?sym=SYNJ
Arithmetic scales are useful for short-term charts and trading. Price movements (particularly for stocks) are shown in absolute dollar terms and reflect movements dollar for dollar.
Use PennyStock Tweets For All Your $EMWW DD
http://www.pennystocktweets.com/stocks/profile/EMWW
Naked Shorting by definition is
Short sellers sell borrowed shares in the hope they can be bought back at a lower price. Naked short-selling involves selling shares without first borrowing them.
Stage 6 marks a deterioration in the economy as the business cycle prepares to move from an expansion phase to a contraction phase. Stocks have already been moving lower and commodities now turn lower in anticipation of decreased demand from the deteriorating economy
This link will help thou $EXSO BarChart Trader's Cheat Sheet NITE-LYNX
http://www.barchart.com/cheatsheet.php?sym=EXSO
Use PennyStock Tweets For All Your $TDEY DD
http://www.pennystocktweets.com/stocks/profile/TDEY
Rule # 3 is so important, Once you have read the filings and have an understanding of what that information tells you , you then can trade it accordingly, day trade or a 2 to 3 day swing etc, and if it dont feel right don't buy it
Therefore, there were a lot of bullish buyers of the stock around 18. When the price declined below 18 and fell to around 14, many of these (now unhappy) bulls were probably still holding the stock.
This link will help thou $HPNN BarChart Trader's Cheat Sheet NITE-LYNX
http://www.barchart.com/cheatsheet.php?sym=HPNN
Check Out $GORXQ On PennyStock Tweets
http://www.pennystocktweets.com/stocks/profile/GORXQ
Make sure the market is bullish or bearish. A good strategy used under the wrong conditions will result in a loss. Be sure to check to see which way the wind is blowing.
That's much the same in all endeavors. The only way to continue making money, to continue growing and keeping your profit margins healthy, is to constantly come up with new ideas.
$PDOS BarChart Trader's Cheat Sheet NITE-LYNX
http://www.barchart.com/cheatsheet.php?sym=PDOS
NITE-LYNX $FBEC BarChart Trader's Cheat Sheet
http://www.barchart.com/cheatsheet.php?sym=FBEC
Staples/Discretionary Ratio
Chartists can also compare the performance of the consumer discretionary sector to the consumer staples sector for clues on the economy.
A negative reversal is the opposite of a positive reversal. RSI forms a higher high, but the security forms a lower high. Again, the higher high is usually just below overbought levels in the 50-70 area. Chart 12 shows Starbucks (SBUX) forming a lower high as RSI forms a higher high. Even though RSI forged a new high and momentum was strong, the price action failed to confirm as lower high formed. This negative reversal foreshadowed the big support break in late June and sharp decline.
MORNING DOJI STAR
This is also a three-candlestick formation signaling a major bottom reversal. It is composed of a long black candlestick followed by a doji, which characteristically gaps down to form a doji star. Then we have a third white candlestick whose closing is well into the first session’s black real body. This is a meaningful bottom pattern.
Recognition Criteria:
1. Market is characterized by downtrend.
2. We see a long black candlestick in the first day.
3. Then we see a Doji on the second day that gaps in the direction of the previous downtrend.
4. The white candlestick on the third day confirms the reversal.
Explanation:
Black real body while market is falling down may suggest that the bears are in command. Then a Doji appears showing the diminishing capacity of sellers to drive the market lower. Confirmation of bull ascendancy is the third day’s strong white real body. An ideal Bullish Morning Doji Star Pattern must have a gap before and after the middle line’s real body. The second gap is rare, but lack of it does not take away from the power of this formation.
Important Factors:
The Doji may be more than one, two or even three.
Doji’s gaps are not important. 
$TWTRQ BarChart Technical Analysis
http://www.barchart.com/technicals/stocks/TWTRQ
$SELR BarChart Technical Analysis
http://www.barchart.com/technicals/stocks/SELR
Pivot Points
Introduction
Pivots Points are significant levels chartists can use to determine directional movement, support and resistance. Pivot Points use the prior period's high, low and close to formulate future support and resistance. In this regard, Pivot Points are predictive or leading indicators. There are at least five different versions of Pivot Points. This article will focus on Standard Pivot Points, Demark Pivot Points and Fibonacci Pivot Points.
Pivot Points were originally used by floor traders to set key levels. Floor traders are the original day traders. They deal in a very fast moving environment with a short-term focus. At the beginning of the trading day, floor traders would look at the previous day's high, low and close to calculate a Pivot Point for the current trading day. With this Pivot Point as the base, further calculations were used to set support 1, support 2, resistance 1 and resistance 2. These levels would then be used to assist their trading throughout the day.
Bandwidth tells how wide the Bollinger Bands are on a normalized basis. Writing the same symbols as before, and middleBB for the moving average, or middle Bollinger Band.
$PTEEF BarChart Technical Analysis
http://www.barchart.com/technicals/stocks/PTEEF
The force index is calculated by subtracting yesterday’s close from today’s close and multiplying the result by today’s volume. Force Index = (Today’s Closing Price – Yesterday’s Closing Price) * Today’s Volume.
|
Followers
|
3289
|
Posters
|
|
|
Posts (Today)
|
0
|
Posts (Total)
|
2804248
|
|
Created
|
08/22/10
|
Type
|
Free
|
| Moderator Nilbud | |||
| Assistants mick ManicTrader PhotoChick Kirimi $Pistol Pete$ | |||
   Investor Hub Alerts: Sign up for 'STOCKGOODIES PLAYS OF THE WEEK ' E-Mail List Investor Hub Alerts: Sign up for 'STOCKGOODIES PLAYS OF THE WEEK ' E-Mail ListUPDATE; 5-1-22 courtesy of charting /\ wit tweezer top calls /\ Tony @Montana_Trades Really good study sheet on Candlestick Patterns [-chart]pbs.twimg.com/media/FRn8188XMAAdZvk?format=jpg&name=small[/chart] 

02-07-2021
|
|
Posts Today
|
0
|
|
Posts (Total)
|
2804248
|
|
Posters
|
|
|
Moderator
|
|
|
Assistants
|
| Volume | |
| Day Range: | |
| Bid Price | |
| Ask Price | |
| Last Trade Time: |


