 News
News  Market Data
  Discover
Support: 888-992-3836
Copyright © 2023 InvestorsHub Inc.


Register for free to join our community of investors and share your ideas. You will also get access to streaming quotes, interactive charts, trades, portfolio, live options flow and more tools.
Default: A default occurs when a person or entity fails to meet its debt obligations. It can be in the form of unpaid loans, mortgages, bonds, and promissory notes. A debtor is also considered to have defaulted when a violation of loan conditions is committed (i.e., not making a scheduled payment).

Daily Candlestick Chart for FTWR
[img]stockcharts.com/c-sc/sc?s=FTWR
Goodies Approves StockCharts.com - ChartSchool
NEWBIE Chart Lessons Start Here http://stockcharts.com/school/doku.php?id=chart_school
Goodies Approves StockCharts.com - ChartSchool
http://stockcharts.com/school/doku.php?id=chart_school

Central Bank: Central banks play a key role in the currency markets because of their power over monetary policy. They have a direct influence over money supply, which in turn affects demand and price of the currency. Through the use of different policies, central banks can try to manipulate the markets so that they can keep their currency at specific levels. Some countries and their central banks try to peg their currency to that of another currency or basket of currencies (for example, China to the U.S.).
The central bank can participate in the forex market by buying and selling their currency at the spot market in order to keep it from changing too much. Another motivation for central banks is to keep the local currency at a specific price in order to make their local economy more attractive for international trade. If a country’s currency appreciates too quickly, it could actually make it less appealing to importers.
Remember that many transactions have to use the local currency. Thus, if currency that is needed rises too quickly, it effectively makes goods more expensive to foreigners, which in turn, hurts trade. To counter this, the central bank may intervene in the market by selling its currency and buying up other major currencies. This in effect, weakens the local currency so as to make it more appealing to foreign importers.
While the exact value of what percentage such central bank transactions take up isn’t known, take note that because these are the banks of national governments, such interventions can have a much larger impact on the market than any single commercial bank.
Daily Candlestick Chart for AMEH
[img]stockcharts.com/c-sc/sc?s=AMEH
An Oldie but Goodie
Much of our understanding of chart patterns can be attributed to the work of Richard Schabacker. His 1932 classic, Technical Analysis and Stock Market Profits, laid the foundations for modern pattern analysis. In Technical Analysis of Stock Trends (1948), Edwards and Magee credit Schabacker for most of the concepts put forth in the first part of their book. We would also like to acknowledge Messrs. Schabacker, Edwards and Magee, and John Murphy as the driving forces behind these articles and our understanding of chart patterns.
Pattern analysis may seem straightforward, but it is by no means an easy task. Schabacker states:
The science of chart reading, however, is not as easy as the mere memorizing of certain patterns and pictures and recalling what they generally forecast. Any general stock chart is a combination of countless different patterns and its accurate analysis depends upon constant study, long experience and knowledge of all the fine points, both technical and fundamental, and, above all, the ability to weigh opposing indications against each other, to appraise the entire picture in the light of its most minute and composite details as well as in the recognition of any certain and memorized formula.
Even though Schabacker refers to "the science of chart reading", technical analysis can at times be less science and more art. In addition, pattern recognition can be open to interpretation, which can be subject to personal biases. To defend against biases and confirm pattern interpretations, other aspects of technical analysis should be employed to verify or refute the conclusions drawn. While many patterns may seem similar in nature, no two patterns are exactly alike. False breakouts, bogus reads and exceptions to the rule are all part of the ongoing education.
Careful and constant study are required for successful chart analysis. On the AMZN chart above, the stock broke resistance from a head and shoulders reversal. While the trend is now bearish, analysis must continue to confirm the bearish trend.

Novellus Systems, Inc. (NVLS) chart patterns example chart from StockCharts.com
Novellus (NVLS)[Nvls]
Some analysts might have labeled the NVLS chart as a head and shoulders pattern with neckline support around 17.50. Whether or not this is robust remains open to debate. Even though the stock broke neckline support at 17.50, it repeatedly moved back above its support break. This refusal might have been taken as a sign of strength and justified a reassessment of the pattern.
Directional Movement Index: The directional movement index (or DMI) was developed by J. Welles Wilder in order to determine the overall direction of a given asset's prices. DMI is composed of two lines, one representing positive direction ( DI) and one representing a negative direction (-DI).
To calculate the DMI, a trader first calculates the difference between the current high and the previous high (HiDiff), as well as the difference between the previous low and the current low (LowDiff). HiDiff and LowDiff are then compared. If HiDiff is greater in value, a variable DMI is set to HiDiff and a variable -DMI is set to 0. If LowDiff is greater, -DMI is set to LowDiff and DMI is set to 0. If the two values are equal, or if no trend is seen in either highs or lows, both values are set to 0. A calculation known as the Welles Summation is then performed on both DMI and -DMI, resulting in two numbers: DI and -DI, both ranging from 0 to 100. The directional movement index consists of these two points.
The DMI can be used in strongly trending markets to determine strong buy and sell signals. The DMI generates a strong buy signal when DI crosses above -DI at any point and generates a strong sell signal when DI crosses below -DI at any point. In non-trending markets, this indicator becomes less useful.
The directional movement index is the basic value from which the average directional index (or ADX) is derived.
Daily Candlestick Chart for ECRY
[img]stockcharts.com/c-sc/sc?s=ECRY
Daily Candlestick Chart for MINE
[img]stockcharts.com/c-sc/sc?s=MINE
Dollar and Commodities
While the Dollar and currency markets are part of intermarket analysis, the Dollar is a bit of a wild card. As far as stocks are concerned, a weak Dollar is not bearish unless accompanied by a serious advance in commodity prices. Obviously, a big advance in commodities would be bearish for bonds. By extension, a weak Dollar is also generally bearish for bonds. A weak Dollar acts an economic stimulus by making US exports more competitive. This benefits large multinational stocks that derive a large portion of their sales overseas.
What are the effects of a rising Dollar? A countries currency is a reflection of its economy and national balance sheet. Countries with strong economies and strong balance sheets have stronger currencies. Countries with weak economies and big debt burdens are subject to weaker currencies. A rising Dollar puts downward pressure on commodity prices because many commodities are priced in Dollars, such as oil. Bonds benefit from a decline in commodity prices because this reduces inflationary pressures. Stocks can also benefit from a decline in commodity prices because this reduces the costs for raw materials.
Bundesbank: The Central Bank of Germany
Daily Candlestick Chart for HRAL
[img]stockcharts.com/c-sc/sc?s=HRAL
Advance/Decline Index: A tool used confirm that a trend is continuing. If there are more declining issues, the trend might see a reversal in the near future. The Advance/Decline Index is calculated by subtracting the number of declining prices from the number of advancing security prices.
Daily Candlestick Chart for MRFD
[img]stockcharts.com/c-sc/sc?s=MRFD
Business Cycle
The graph below shows the idealized business cycle and the intermarket relationships during a normal inflationary environment. This cycle map is based on one shown in the Intermarket Review by Martin J. Pring (www.pring.com). The business cycle is shown as a sine wave. The first three stages are part of an economic contraction (weakening, bottoming, strengthening). Stage 3 shows the economy in a contraction phase, but strengthening after a bottom. As the sine wave crosses the centerline, the economy moves from contraction to the three phases of economic expansion (strengthening, topping and weakening). Stage 6 shows the economy in an expansion phase, but weakening after a top.
Stage 1 shows the economy contracting and bonds turning up as interest rates decline. Economic weakness favors loose monetary policy and the lowering of interest rates, which is bullish for bonds.
Stage 2 marks a bottom in the economy and the stock market. Even though economic conditions have stopped deteriorating, the economy is still not at an expansion stage or actually growing. However, stocks anticipate an expansion phase by bottoming before the contraction period ends.
Stage 3 shows a vast improvement in economic conditions as the business cycle prepares to move into an expansion phase. Stocks have been rising and commodities now anticipate an expansion phase by turning up.
Stage 4 marks a period of full expansion. Both stocks and commodities are rising, but bonds turn lower because the expansion increases inflationary pressures. Interest rates start moving higher to combat inflationary pressures.
Stage 5 marks a peak in economic growth and the stock market. Even though the expansion continues, the economy grows at a slower pace because rising interest rates and rising commodity prices take their toll. Stocks anticipate a contraction phase by peaking before the expansion actually ends. Commodities remain strong and peak after stocks.
Stage 6 marks a deterioration in the economy as the business cycle prepares to move from an expansion phase to a contraction phase. Stocks have already been moving lower and commodities now turn lower in anticipation of decreased demand from the deteriorating economy.
Keep in mind that this is the ideal business cycle in an inflationary environment. Stocks and bonds advance together in stages 2 and 3. Similarly, both decline in stages 5 and 6. This would not be the case in a deflationary environment, when bonds and stocks would move in opposite directions.
Derivative: A financial contract that depends on the commodity's value and properties.
Daily Candlestick Chart for TNEN
[img]stockcharts.com/c-sc/sc?s=TNEN
Methods to Establish Support and Resistance?
Support and resistance are like mirror images and have many common characteristics.

Highs and Lows
Support can be established with the previous reaction lows. Resistance can be established by using the previous reaction highs.
The above chart for Halliburton (HAL) shows a large trading range between Dec-99 and Mar-00. Support was established with the October low around 33. In December, the stock returned to support in the mid-thirties and formed a low around 34. Finally, in February the stock again returned to the support scene and formed a low around 33 1/2.
Delivery: The settlement of a transaction by receipt or tender of financial instrument or currency.
Daily Candlestick Chart for CWBS
[img]stockcharts.com/c-sc/sc?s=CWBS
What is a bear market?
A bear market occurs when stock prices are falling faster than their historical averages. It can last months or even years. It is the opposite of a bull market.
Deal Ticket: Primary method of recording a transaction.
Daily Candlestick Chart for CGUD
[img]stockcharts.com/c-sc/sc?s=CGUD
Price Scaling
There are two methods for displaying the price scale along the y-axis: arithmetic and logarithmic. An arithmetic scale displays 10 points (or dollars) as the same vertical distance no matter what the price level. Each unit of measure is the same throughout the entire scale. If a stock advances from 10 to 80 over a 6-month period, the move from 10 to 20 will appear to be the same distance as the move from 70 to 80. Even though this move is the same in absolute terms, it is not the same in percentage terms.
A logarithmic scale measures price movements in percentage terms. An advance from 10 to 20 would represent an increase of 100%. An advance from 20 to 40 would also be 100%, as would an advance from 40 to 80. All three of these advances would appear as the same vertical distance on a logarithmic scale. Most charting programs refer to the logarithmic scale as a semi-log scale, because the time axis is still displayed arithmetically.

Verisign, Inc. (VRSN) price scaling example chart from StockCharts.com
The chart above uses the 4th-Quarter performance of VeriSign to illustrate the difference in scaling. On the semi-log scale, the distance between 50 and 100 is the same as the distance between 100 and 200. However, on the arithmetic scale, the distance between 100 and 200 is significantly greater than the distance between 50 and 100.
Clearing Price: The actual monetary value given to an asset. This value in a trade serves as a compromise at which a buyer agrees to buy and a seller agrees to sell
General Steps to Technical Evaluation
Many technicians employ a top-down approach that begins with broad-based macro analysis. The larger parts are then broken down to base the final step on a more focused/micro perspective. Such an analysis might involve three steps:
Broad market analysis through the major indices such as the S
Dealer: An individual or firm acting as a principal, rather than as an agent, in the purchase and/or sale of securities. Dealers trade for their own account and risk. This is in contrast to brokers who trade only on behalf of their clients.
Exhaustion Gaps
Exhaustion gaps are those that happen near the end of a good up- or downtrend. They are many times the first signal of the end of that move. They are identified by high volume and large price difference between the previous day's close and the new opening price. They can easily be mistaken for runaway gaps if one does not notice the exceptionally high volume.
It is almost a state of panic if the gap appears during a long down move where pessimism has set in. Selling all positions to liquidate holdings in the market is not uncommon. Exhaustion gaps are quickly filled as prices reverse their trend. Likewise, if they happen during a bull move, some bullish euphoria overcomes trades, and buyers cannot get enough of that stock. The prices gap up with huge volume; then, there is great profit taking and the demand for the stock totally dries up. Prices drop, and a significant change in trend occurs. Exhaustion gaps are probably the easiest to trade and profit from. In the chart, notice that there was one more day of trading to the upside before the stock plunged. The high volume was the giveaway that this was going to be, either, an exhaustion gap or a runaway gap. Because of the size of the gap and the near doubling of volume, an exhaustion gap was in the making here.

Delta Air Lines (DAL) Exhaustion Gap example chart from StockCharts.com
Introduction to Chart Patterns
There are hundreds of thousands of market participants buying and selling securities for a wide variety of reasons: hope of gain, fear of loss, tax consequences, short-covering, hedging, stop-loss triggers, price target triggers, fundamental analysis, technical analysis, broker recommendations and a few dozen more. Trying to figure out why participants are buying and selling can be a daunting process. Chart patterns put all buying and selling into perspective by consolidating the forces of supply and demand into a concise picture. As a complete pictorial record of all trading, chart patterns provide a framework to analyze the battle raging between bulls and bears. More importantly, chart patterns and technical analysis can help determine who is winning the battle, allowing traders and investors to position themselves accordingly.
In many ways, chart patterns are simply more complex versions of trend lines. It is important that you read and understand our articles on Support and Resistance as well as Trend Lines before you continue.
Chart pattern analysis can be used to make short-term or long-term forecasts. The data can be intraday, daily, weekly or monthly and the patterns can be as short as one day or as long as many years. Gaps and outside reversals may form in one trading session, while broadening tops and dormant bottoms may require many months to form.

Amazon.com, Inc. (AMZN) chart patterns example chart from StockCharts.com
Amazon (AMZN)[Amzn]

CIENA Corp. (CIEN) chart patterns example chart from StockCharts.com
CIENA (CIEN)[CIEN]
Form 1-E, 1-E/A ~ SEC Filings Explained
Notification under Regulation E by small business investment companies and business development companies (and amendment thereto)

Obviously, a big advance in commodities would be bearish for bonds. By extension, a weak Dollar is also generally bearish for bonds. A weak Dollar acts an economic stimulus by making US exports more competitive. This benefits large multinational stocks that derive a large portion of their sales overseas.


For All Your $VLNX DD ~ Use PennyStock Tweets
http://www.pennystocktweets.com/stocks/profile/VLNX

Form N-2 ~ SEC Filings Explained
Initial filing of a registration statement on Form N-2 for closed-end investment companies
For All Your $XTGR DD ~ Use PennyStock Tweets
http://www.pennystocktweets.com/stocks/profile/XTGR
Many traders and investors believe that candlestick charts are easy to read, especially the relationship between the open and the close.
Candlestick Patterns
Long Lines
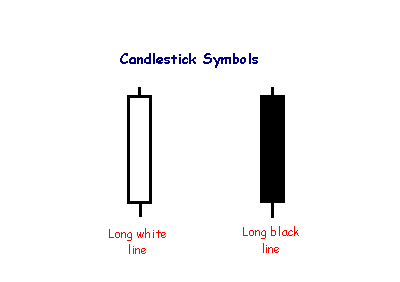
The long white line is a sign that buyers are firmly in control - a bullish candlestick.
A long black line shows that sellers are in control - definitely bearish.
More On $AXLX At PennyStock Tweets
http://www.pennystocktweets.com/stocks/profile/AXLX
Technical analysis is not an exact science and it is sometimes difficult to set exact support levels.
DEF 14A~ SEC Filings Explained
A proxy statement is a statement required of a firm when soliciting shareholder votes. This statement is filed in advance of the annual meeting. The firm needs to file a proxy statement, otherwise known as a Form DEF 14A (Definitive Proxy Statement), with the U.S. Securities and Exchange Commission. This statement is useful in assessing how management is paid and potential conflict-of-interest issues with auditors. The statement includes:
? Voting procedure and information.
? Background information about the company's nominated directors including relevant history in the company or industry, positions on other corporate boards, and potential conflicts in interest.
? Board compensation.
? Executive compensation, including salary, bonus, non-equity compensation, stock awards, options, and deferred compensation. Also, information is included about perks such as personal use of company aircraft, travel, and tax gross-ups. Many companies will also include pre-determined payout packages for if an executive leaves the company.
? Who is on the audit committee, as well as a breakdown of audit and non-audit fees paid to the auditor.
SEC proxy rules: The term "proxy statement" means the statement required by Section 240.14a-3(a) whether or not contained in a single document.
In many cases, shareholder votes - particularly institutional shareholder votes - are determined by proxy firms which advise the shareholders...
Traditionally, broker-dealers have been permitted to vote for "routine" proposals on behalf of their shareholders if the shareholders do not return the proxy statement. This has been controversial, and in 2006 the NYSE Proxy Working Group recommended that the rules be modified so that uncontested director elections were not considered routine.[1] The SEC approved the rule on July 1, 2009.[2]
In July 2010, the SEC announced that it was seeking public comment on the efficiency of the proxy system.[3]
There has been some controversy over "proxy access" which is a method to allow shareholders to nominate candidates which appear on the proxy statement. Currently, only the nominating board can place candidates on the proxy statement. The United States Dodd–Frank Wall Street Reform and Consumer Protection Act specifically allowed the SEC to rule on this issue. In 2010, the SEC passed a rule which allowed certain shareholders to place candidates on the proxy statement,;[4] however, the rule was struck down by the United States Court of Appeals for the District of Columbia Circuit in 2011
How to Pick a Time Frame
The time frame used for forming a chart depends on the compression of the data: intraday, daily, weekly, monthly, quarterly or annual data. The less compressed the data is, the more detail is displayed.

Check Out $HKWO On PennyStock Tweets
http://www.pennystocktweets.com/stocks/profile/HKWO
Tweezer Bottoms

The Tweezer Bottom formation is a bullish reversal pattern seen at the bottom of downtrends.
Tweezer Bottom formation consists of two candlesticks:
Bearish Candle (Day 1)
Bullish Candle (Day 2)
Sometimes Tweezer Bottoms have three candlesticks.
A bullish Tweezer Bottom occurs during a downtrend when bears continue to take prices lower, usually closing the day near the lows (a bearish sign). Nevertheless, Day 2 is completely opposite because prices open and go nowhere but upwards. This bullish advance on Day 2 sometimes eliminates all losses from the previous day.

The bears pushed the price of Exxon-Mobil (XOM) downwards on Day 1; however, the market on Day 2 opened where prices closed on Day 1 and went straight up, reversing the losses of Day 2. A buy signal would generally be given on the day after the Tweezer Bottom, assuming the candlestick was bullish green.
The Tweezer Top and Bottom reversal pattern is extremely helpful because it visually indicates a transfer of power and sentiment from the bulls and the bears. Of course other technical indicators should be consulted before making a buy or sell signal based on the Tweezer patterns.
Stage 6 marks a deterioration in the economy as the business cycle prepares to move from an expansion phase to a contraction phase. Stocks have already been moving lower and commodities now turn lower in anticipation of decreased demand from the deteriorating economy
$GDAR Profile on PST - For All Your DD Use More http://www.pennystocktweets.com/stocks/stockprofile/GDAR
Parabolic SAR
Introduction
Developed by Welles Wilder, the Parabolic SAR refers to a price and time based trading system. Wilder called this the "Parabolic Time/Price System". SAR stands for "stop and reverse", which is the actual indicator used in the system. SAR trails price as the trend extends over time. The indicator is below prices when prices are rising and above prices when prices are falling. In this regard, the indicator stops and reverses when the price trend reverses and breaks above or below the indicator.
Wilder introduced the Parabolic Time/Price System in his 1978 book, New Concepts in Technical Trading Systems. This book also includes RSI, Average True Range and the Directional Movement Concept (ADX). Despite being developed before the computer age, Wilder's indicators have stood the test of time and remain extremely popular.

Calculation
Calculation of SAR is complex with if/then variables that make it difficult to put in a spreadsheet. These examples will provide a general idea of how SAR is calculated. Because the formulas for rising and falling SAR are different, it is easier to divide the calculation into two parts. The first calculation covers rising SAR and the second covers falling SAR.
Rising SAR
Prior SAR: The SAR value for the previous period.
Extreme Point (EP): The highest high of the current uptrend.
Acceleration Factor (AF): Starting at .02, AF increases by .02 each
time the extreme point makes a new high. AF can reach a maximum
of .20, no matter how long the uptrend extends.
Current SAR = Prior SAR Prior AF(Prior EP - Prior SAR)
13-Apr-10 SAR = 48.28 = 48.13 .14(49.20 - 48.13)
The Acceleration Factor is multiplied by the difference between the
Extreme Point and the prior period's SAR. This is then added to the
prior period's SAR. Note however that SAR can never be above the
prior two periods' lows. Should SAR be above one of those lows, use
the lowest of the two for SAR.


Falling SAR
Prior SAR: The SAR value for the previous period.
Extreme Point (EP): The lowest low of the current downtrend.
Acceleration Factor (AF): Starting at .02, AF increases by .02 each
time the extreme point makes a new low. AF can reach a maximum
of .20, no matter how long the downtrend extends.
Current SAR = Prior SAR - Prior AF(Prior SAR - Prior EP)
9-Feb-10 SAR = 43.56 = 43.84 - .16(43.84 - 42.07)
The Acceleration Factor is multiplied by the difference between the
Prior period's SAR and the Extreme Point. This is then subtracted
from the prior period's SAR. Note however that SAR can never be
below the prior two periods' highs. Should SAR be below one of
those highs, use the highest of the two for SAR.


Interpretation
SAR follows price and can be considered a trend following indicator. Once a downtrend reverses and starts up, SAR follows prices like a trailing stop. The stop continuously rises as long as the uptrend remains in place. In other words, SAR never decreases in an uptrend and continuously protects profits as prices advance. The indicator acts as a guard against the propensity to lower a stop-loss. Once price stops rising and reverses below SAR, a downtrend starts and SAR is above the price. SAR follows prices lower like a trailing stop. The stop continuously falls as long as the downtrend extends. Because SAR never rises in a downtrend, it continuously protects profits on short positions.
Step Increments
The Acceleration Factor (AF), which is also referred to as the Step, dictates SAR sensitivity. SharpCharts users can set the Step and the Maximum Step. As shown in the spreadsheet example, the Step is a multiplier that influences the rate-of-change in SAR. That is why it is referred to as the Acceleration Factor. Step gradually increases as the trend extends until it hits a maximum. SAR sensitivity can be decreased by decreasing the Step. A lower step moves SAR further from price, which makes a reversal less likely.
SAR sensitivity can be increased by increasing the step. A higher step moves SAR closer to the price action, which makes a reversal more likely. The indicator will reverse too often if the step is set too high. This will produce whipsaws and fail to capture the trend. Chart 6 shows IBM with SAR (.01, .20). The step is .01 and the Maximum Step is .20. Chart 7 shows IBM with a higher Step (.03). SAR is more sensitive in chart 7 because there are more reversals. This is because the Step is higher in chart 7 (.03) than chart 6 (.01).


Maximum Step
The sensitivity of the indicator can also be adjusted using the Maximum Step. While the Maximum Step can influence sensitivity, the Step carries more weight because it sets the incremental rate-of-increase as the trend develops. Also note that increasing the Step insures that the Maximum Step will be hit quicker when a trend develops. Chart 8 shows Best Buy (BBY) with a Maximum Step (.10), which is lower than the default setting (.20). This lower Maximum Step decreases the sensitivity of the indicator and produces fewer reversals. Notice how this setting caught a two month downtrend and a subsequent two month uptrend. Chart 9 shows BBY with a higher Maximum Step (.20). This higher reading produced extra reversals in early February and early April.


Conclusions
The Parabolic SAR works best with trending securities, which occur roughly 30% of the time according to Wilder's estimates. This means the indicator will be prone to whipsaws over 50% of the time or when a security is not trending. After all, SAR is designed to catch the trend and follow it like a trailing stop. As with most indicators, the signal quality depends on the settings and the characteristics of the underlying security. The right settings combined with decent trends can produce a great trading system. The wrong settings will result in whipsaws, losses and frustration. There is no golden rule or one-size-fits-all setting. Each security should be evaluated based on its own characteristics. Parabolic SAR should also be used in conjunction with other indicators and technical analysis techniques. For example, Wilder's Average Directional Index can be used to estimate the strength of the trend before considering signals.
Scans
Break above falling SAR: This scan starts with stocks that have an average price of $10 or greater over the last three months and average volume greater than 40,000. The scan then filters for stocks that have a bullish SAR reversal (Parabolic SAR (.01,.20)). This scan is just meant as a starter for further refinement.
Break below rising SAR: This scans starts with stocks that have an average price of $10 or greater over the last three months and average volume greater than 40,000. The scan then filters for stocks that have a bearish SAR reversal (Parabolic SAR (.01,.20)). This scan is just meant as a starter for further refinement.
If you are not interested in the opening price, bar charts are an ideal method for analyzing the close relative to the high and low.
For All Your $MRNJ DD ~ Use PennyStock Tweets
http://www.pennystocktweets.com/stocks/profile/MRNJ
The high and low are represented by the top and bottom of the vertical bar and the close is the short horizontal line crossing the vertical bar.
Form NT 10-K ~ SEC Filings Explained
Notice under Rule 12b25 of inability to timely file all or part of a Form 10-K, 10-KSB, or 10KT
|
Followers
|
3289
|
Posters
|
|
|
Posts (Today)
|
0
|
Posts (Total)
|
2804248
|
|
Created
|
08/22/10
|
Type
|
Free
|
| Moderator Nilbud | |||
| Assistants mick ManicTrader PhotoChick Kirimi $Pistol Pete$ | |||
   Investor Hub Alerts: Sign up for 'STOCKGOODIES PLAYS OF THE WEEK ' E-Mail List Investor Hub Alerts: Sign up for 'STOCKGOODIES PLAYS OF THE WEEK ' E-Mail ListUPDATE; 5-1-22 courtesy of charting /\ wit tweezer top calls /\ Tony @Montana_Trades Really good study sheet on Candlestick Patterns [-chart]pbs.twimg.com/media/FRn8188XMAAdZvk?format=jpg&name=small[/chart] 

02-07-2021
|
|
Posts Today
|
0
|
|
Posts (Total)
|
2804248
|
|
Posters
|
|
|
Moderator
|
|
|
Assistants
|
| Volume | |
| Day Range: | |
| Bid Price | |
| Ask Price | |
| Last Trade Time: |


