 News
News  Market Data
  Discover
Support: 888-992-3836
Copyright © 2023 InvestorsHub Inc.


Register for free to join our community of investors and share your ideas. You will also get access to streaming quotes, interactive charts, trades, portfolio, live options flow and more tools.
americano thank you, Pope Francis : Why The Dollar Will Collapse 100% on 28 May 2016 ? -
Note. Rothschild owns majority shares of the Vatican -
Ex...
28 May 2016 Dollar if they knew that they would be God , I guess
americano thank you; The Evidence That The Dollar Will Collapse on 28 May 2016 By lindsey williams .


High Bob they fed better come locked and loaded with F-16'S
americano my friend - FYI. Beware: Gold Will Be Seized! Ten Reasons Why The Fed Will Take Your Gold -
Made my 10 grand,time to sell.
FTD
Gold kicking ass and taking names....I love $$$$$$$$$$$$$$.
FTD
Long 1000 shares at 33.00.
Gold getting killed on margin calls for now.
FTD
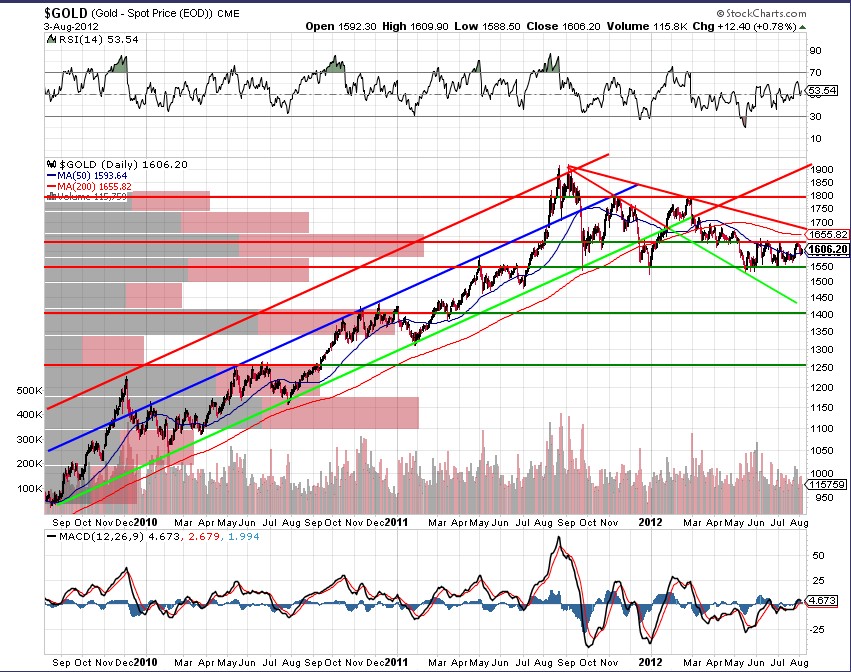
Gold's multi-year march forward stopped when it went parabolic right around current resistance around 1640. Typically this happens when the market drivers are all in and start promoting it to the masses.
For a year it has gone sideways with support at 1550 - bottom of its old upchannel. It is now well under the multi-year uptrend and has the highest volume by price since it was under 1200.
I could see it taking another crack at $1900, where I extrapolate the bottom of the old up-channel.
Catalysts: Euro maintenance, US Quantitative Easement "x", or China having slower growth rates. Note that Gold was down when BRICs and China were down, so I am not sure there really is any further flight of foreign capaital from China to gold, but there might be extradition of wealth from RMB to gold.
Doubts: Instead of banging repeatedly into resistance, it has skimmed repeatedly along thin ice. It acts like the supposed market manipulators have a price (1550) they are willing to sell at and that when they are done we'll here what a bad investment (tech stocks, real estate, oil...) gold was at these prices and that it was just another "tulip craze".
Gartman back on the buy bandwagon after a brief hiatus; Dollar AND Gold up while Euro down. Nice, IMO.
Thanks, realfast. I had 'em DVR'd and caught it over dinner. His favorite play is long gold, short Euro. Guess to be equally "paired" with DGP, one would need the levered inverse Euro ETF if one exists.
An interesting point brought up elsewhere is potential impact on this ETN due to European crisis' impact on Deutsch Bank should the contagion spread, since we're holding futures contracts vs. a gold backed instrument like GLD. It's still an open question at the moment.
GLTA!
CNBC: Gartman is watching the strength in gold [GCCV1 1730.50 18.70 (+1.09%) ]. Considering the EU will probably have to drop rates, Gartman says, "gold will probably climb quietly higher in dollar terms but materially higher in euro terms."
http://www.cnbc.com/id/45126419
Was out of the house... guessing it's why we pulled back a bit. Not to worry... Pogo works overtime at the Fed and Murphy is his assistant. GLTA!
We didnt get qe3 today, but well see it soon enough. Ben wants Europe to make the first move, then well counter...The Great Race To Debase...
QE3 will happen and when it does G &S will fly again. This is a temporary set back. Gold looks strong. Silver more volatile but should do well long term as well. Im holding and adding the dips.
economy unraveling, gold and silver rising.
Unravelling in an upwards ,rising, kind of way.
Just can't quite get through this resistence. What is ths, a quad-drupple top?
Looks like gold wants to test that upper resistance...
Took a position here this morning. Stop at $39.
DGP has just been great this year.
Looks like DGP is at resistance today to me via the MACD you use... both bars and lines...
FWIW, I'm looking to get in on DB Gold 2x long as the chart configuration is in a presignal buy area.
Just need a decisive close > 5-day EMA to pull the trigger FA.
My MAC-D settings are the fast settings recommended by Gerald Appel.
The MACD you use is a bit different but I'd wait for the red line to be below the lowest bar first... with that said, I wouldn't rule out 850 on $ GOLD ...
Test of the 100-day MA on tap. If that doesn't hold, looks like 15 is next.
Perhaps we get a bounce as the 30-minute chart is looking very oversold to me and there's some positive divergences showing up as well.
We'll be bearish for the time-being, they've seemed to have done a good job at muting all the anxiety for the banks and such but we all know the problems are there and they will come back... when they do, you'll want to hedge with precious metals.
Weekly charts suggest down whereas daily suggest up...I'm staying away until this sorts out...
Will Gold Move On? Hulbert thinks the answer is currently yes...
http://www.marketwatch.com/news/story/Contrarian-analysis-current-gold-market/story.aspx?guid={A6AA73CD-45EB-48D2-93F4-B86D4C5EE2AD}
US Gov going in deep debit to short gold with no real dollars,
Gold is very cheap and silver very cheap.
dgp probably be trading at 100-200 bucks end of year or next, wish I had some money to buy shares.
Grim Economy Creates a Golden Opportunity
By MICHAEL KAHN
http://online.barrons.com/article/SB123488598249200269.html
The rally in gold, despite a stronger U.S. dollar, tells us that people are worried about the economic outlook.
GOLD BUGS TOOK A LOT OF HEAT during the second half of 2008 as the yellow metal performed poorly, along with stocks and other commodities. But a funny thing happened on the way to deflation: Gold bottomed in October and has been rallying ever since.
Last week's action was technically important as prices moved above a loosely defined trendline drawn from the March 2008 all-time high (see Chart 1). I say loosely defined because the trendline really did not describe the action well in the final months of the year. Prices dipped more than 20% below that line and that is a bit much for a technical theorist to accept.
Chart 1
But charting and trendline drawing allow for a bit of wiggle room. We can all agree that the trend for much of last year was down and now it has changed to up. Strip away the patterns and the indicators and that is technical analysis at its core. The market is giving us its most important message that the bulls are back in control.
Indeed, from the big picture point of view, the bulls never really lost it. They were merely taking a breather following a successful foray into four-digit territory – a price over $1000. A monthly chart shows this quite clearly (see Chart 2).
Chart 2
The long-term bull market trendline drawn from 2001 has remained intact. Last year's decline provided a needed correction after an accelerated or even a bubbly rally and that is what has kept me quietly bullish throughout (see Getting Technical, "Gold Stocks Regaining Their Shine", November 24, 2008).
The question investors are asking now is, "How gold can be rallying when the U.S. dollar is so strong relative to other major currencies?"
Since gold is priced in dollars, a strong greenback typically results in a lower price for the metal. But not always.
If the supply and demand condition is stable, then gold and the dollar have an inverse relationship. But if demand for gold starts to build, then it can move higher no matter what the dollar does.
One look at gold priced in Euros bears that out (see Chart 3). From the European point of view, gold is in record high territory and significantly above both its previous high-water marks set in March and October 2008.
Chart 3
Gold is now rallying without regard to currency.
Gold stocks have also been moving higher despite a bleak overall stock market. The Market Vectors gold miners ETF (GDX) had a strong run from its October lows, moving from roughly 16 to its current 37 and change (see Chart 4).
Chart 4
Although the price of the ETF has more than doubled since the lows, the charts show no reason why the trend will end anytime soon. Specifically, it sports good momentum, a rising 50-day moving average and good volume. While many other sectors can boast similar conditions, the gold ETF is one of a very elite group that has also moved above its respective 200-day moving average.
Not only has the short-term trend changed to bullish but the long-term trend has a tentative change for the better, as well.
To be sure, the ETF and gold stocks in general have not recovered as well as gold itself. Gold has retraced roughly 75% of its 2008 decline while the gold ETF has only retraced about half of its loss. Further, there is rather stiff resistance for the ETF overhead in the 42.50 area from a trading range that was in effect about one year ago.
But as a colleague of mine tells his clients, there is always a bull market somewhere. Right now, gold is it.
Are ETNs in Trouble?
January 27, 2009 at 2:00 pm by Tom Lydon
Speculation has arisen the Barclays could be nationalized, which raises a big question for holders of its line of iPath exchange traded notes (ETNs).
The New York Times recently reported that Barclays would be cutting 2,100 jobs within their investment banking and wealth management division. This news comes at a sour time. Many banks have lost money in the last year, some have collapsed altogether. As debt instruments backed by the creditworthiness of their issuer, this has some wondering about the safety of these ETNs. It was illustrated earlier this year after Lehman Brothers went bankrupt, creating anxiety amid the ETN industry, reports Joe Morris for Ignites.
Holders of the notes could face dire losses if the issuing bank defaults, reports Ian Salisbury for The Wall Street Journal. One advisor noted that the odds of Barclays getting nationalized are low, and for its part, the bank says investors shouldn’t have cause for concern.
One strategist notes in an ETF Update from Janney Montgomery Scott that nationalization does not create an event for the default of debt, and that governments would provide support for any “systematically important” financial institution, instead of allowing it to default on senior debt.
The bank issued a statement regarding the fact that the iPath ETNs continue to pull in assets and that issuance is at all-time highs. The bank says this is because ETNs are easier to trade and have more predictable risks than swaps contracts. Barclays also nots that on Feb. 17, it expects to report a profit before tax and beat analyst estimates.
As with every investment product, investors need to do their research and understand what they’re getting into. It’s important to determine if you are comfortable with the risks. Some investors are, some aren’t.
Sorry but I don't recall. Probably yes!
Was this the P&F chart that was aiming for 12? Now 26.5>>>
Have a good weekend frenchee!
Sweet DGP breakout today. Looks like next target is 22.
StockCharts doesn't have that ability that I'm aware of. I tried playing with the various P&F settings they have and no Fib capability.
This is starting to look intriguing giving the growing socialism ways and printing money out of thin air going on in our country.
The only thing I'm concerned about is the P&F downside target of 12.50... I might analyze this a bit more, maybe run a fib, or if you have a minute this evening, see if you can throw a fibonacci on the chart, be interested to know if the most recent pullback hit some support today or if it's near-bye.
TIA, nice charting as always in the ibox, no one has any excuses not to see the technical indicators on those, sometimes I have to move my chair back a few feet just so I can see 'em ;)
10-4.
The ETF's reaction to the up trend line on the daily chart will be telling...
Hi frenchee,
Got my eye on this, let me know if you see something I might not...
TIA,.
It will really get going after the down-trend line on the triangle pattern on the daily chart (in the iBox) is taken out. If 19 is the breakout point, 32 would be my upside target based on the height of the triangle.
Can you tell me how they figure the price on this
I have to agree with you
DGP looks like she is ready to run!
obi- Looks identical to GLD which looks identical to POG. DGP is based on the futures market and moves accordingly.
As dollar gets weaker - gold is going to get stronger!
I am watching this for an entry!
http://africa.reuters.com/metals/news/usnLS113101.html
Everything I post - is my opinon - do your own due diligence before investing.

|
Followers
|
12
|
Posters
|
|
|
Posts (Today)
|
0
|
Posts (Total)
|
58
|
|
Created
|
05/19/08
|
Type
|
Free
|
| Moderators | |||
This board's subject is fundamental and technical discussion about DB Gold Double Long ETN, DGP. Please keep your posts on topic because your message(s) will be deleted when:
* Posting content that's off-topic to the subject of this board;
* Posting statements that don't add value to the discussion; or
* When you violate any other posting term of the iHub User Agreement: http://investorshub.advfn.com/boards/complex_terms.asp

Deutsche Bank (DB) has leapfrogged ProShares in the race to launch leveraged and inverse commodity products in the United States. The company launched three exchange-traded notes linked to the Deutsche Bank Liquid Commodity Index - Optimum Yield Gold. The new ETNs trade on the NYSE Arca and are:
DB Gold Double Long ETN (DGP)
DB Gold Double Short ETN (DZZ)#board-12683
DB Gold Short ETN (DGZ)
The notes are designed to provide +200%, -200% and -100% of the monthly return of the underlying index, respectively. Importantly, that index is tied to the value of an investment in gold futures, not gold bullion; the two prices do not always track perfectly. Moreover, like all commodity futures products, the notes incorporate the income futures investors would gain from investing their collateral cash in Treasuries. That will add approximately 5% of positive return to each index ... including the short and double short indexes.
Note that the Treasuries return will not be leveraged in the double up or double down funds; only the return of the futures contract will be leveraged.
The fact that the notes are tied to the monthly return of the index is noteworthy. That differs from the way the popular ProShares and Rydex leveraged ETFs work, as those funds are linked to the daily return of their benchmarks. That sounds like a nominal difference, but it is not: Because of the impact of compounding, doubling the monthly return as opposed to the daily return should allow these notes (in most circumstances) to stick closer to the long-term price trends of the underlying index.
An example will explain why. Suppose you have an index starts at 100, rises 20% on day one to 120 and then drops 10% on day two to 108 (10%*120=12). The fund that doubles the daily return would rise to 140 on day one and then drop to 112 on day 2 (10%*140=28). After two days, the fund that doubled the daily return would be up 12%, while the index is up 8%.
If instead you had a fund that doubled the two-day return, it would be up 16%. The longer the interval for each measurement, the closer (in most circumstances) you'll be to doubling the long-term return of an index.
That difference could be important. ProShares has filed papers with the Securities and Exchange Commission to launch leveraged, inverse and inverse-leveraged ETFs tied to various commodities and commodity indexes, including products linked directly to gold bullion; however, it has not received approval to launch these products yet in the U.S. Deutsche Bank appears to have been able to leapfrog ProShares by using the ETN structure, which has a more streamlined approval process than ETFs.
These are the first ETNs launched directly by Deutsche Bank, although it offers a family of commodity exchange-traded funds in partnership with PowerShares. In fact, the impetus for this launch is tied directly to the existing PowerShares funds. Last year, PowerShares and DB tried to convince shareholders in the PowerShares DB Gold ETF (DGL) to switch its mandate from tracking the basic index to doubling its return. That fund had gathered just $55 million in assets, overshadowed by the $19 billion streetTRACK Gold Fund (GLD); investors appear to like the simplicity of direct bullion exposure rather than the futures+interest exposure granted by DGL.
PowerShares and DB thought that doubling the return might attract more investors and help differentiate the fund, but they were unable to gather the necessary votes for a proxy battle, and ultimately they gave up on the idea.
Clearly, Deutsche Bank was working on another approach.
The new notes charge 0.75% in expenses.
http://www.dbfunds.db.com/notes/
Daily Chart
P&F Chart
30-Minute Chart
Weekly Chart
| Volume | |
| Day Range: | |
| Bid Price | |
| Ask Price | |
| Last Trade Time: |


