News
News  Market Data
  Discover
Support: 888-992-3836
Copyright © 2023 InvestorsHub Inc.


Register for free to join our community of investors and share your ideas. You will also get access to streaming quotes, interactive charts, trades, portfolio, live options flow and more tools.
bought some SVXY.....12.05
cc
bought some SVXY.....12.05
cc
natty selling into runs
called dillution
was wondering if closing VIX would affect Credit Suisse
now we know
selling shares into runs
fricking unbelieveable others would follow these ponzie schemes
dupes
no reason natty....UGAZ should run right now
UNG not moving....duhhhhhhhhhhh
demand down......supply down
will be warm weather next couple weeks
live investing spammers working over time rocking up down it goes
unsuspecting newbies sucked into trains running full time two way tracks
u can almost tell which way goes by
worms coming outa wood work
cc
Weather back to normal here...

tru with Credit Suisse
crooks
cc
Picked up some U at 51.50
Looking for 75 ish
cc
We estimate that dry gas production has been expanding in annual terms for 36 consecutive weeks now. However, the daily output rate has been mostly flat over the past 10 days. Currently, we estimate that dry gas production will average 78.4 bcf/day in February, 79.5 bcf/day in March and 79.6 bcf/day in April. Total aggregate supply of natural gas (production + imports) averaged just around 86.8 bcf per day for the week ending February 9 (up 8.5% y-o-y). Overall, total supply/demand balance should be negative at around -130 bcf. It is the tenth negative physical balance this withdrawal season. This negative volume is some 40 bcf larger than a week ago, and around 11 bcf below 5-year average for this time of the year (see the chart below).
cc
looking for 2.735
U at 63.25
cc
low was 55.11....picked up some 55.40
cc
6:15 hit the 55.75 mark prior to pre-market this morning
does it hold ?????
cc
yesterday caught some U at 58.91 and out at 61.50
cc
does U get to 55.75
cc
Who in their right mind
would drop $ 95 k in any stock or ETF
Just not what you do
Why would anyone follow someone who did that
And then pass it off as a fluke
Don’t care how much money u have
It’s a dumb move
cc
It was supposed to be safe to short the vix spike
I had {vix spike} drawing alerts myself
I don't think anyone really understood or realized how
inflated / off ballance xiv's value vs price was
obviously xiv was the wrong vehicle to short the vix
unreal
may consider shorting natty
2.785 could be tops
cc
lots of these green today
https://investorshub.advfn.com/boards/read_msg.aspx?message_id=119547668
cc
SH bought 1,000 shares of XIV for $ 95.00
was 10.36 or so when he sold it
who in their right mind would buy $ 95,000.00 of XIV
he lost % 85,000.00.....ouch
he is now ready to dive back into natty to make big bucks
gives me great security knowing he is leading others
not sure I believe him
his pose is behind him 100 %
massaging his ego
what a bone head move
now 6.12
on 20th XIV will delist
cc
traded soxs 12's for xiv 107's wanted 103's/4's but
close enough
...have things I need to do today
natty coming back around
D dropping
life is grand when a plan comes together
cc
Didn't buy D again yesterday at top
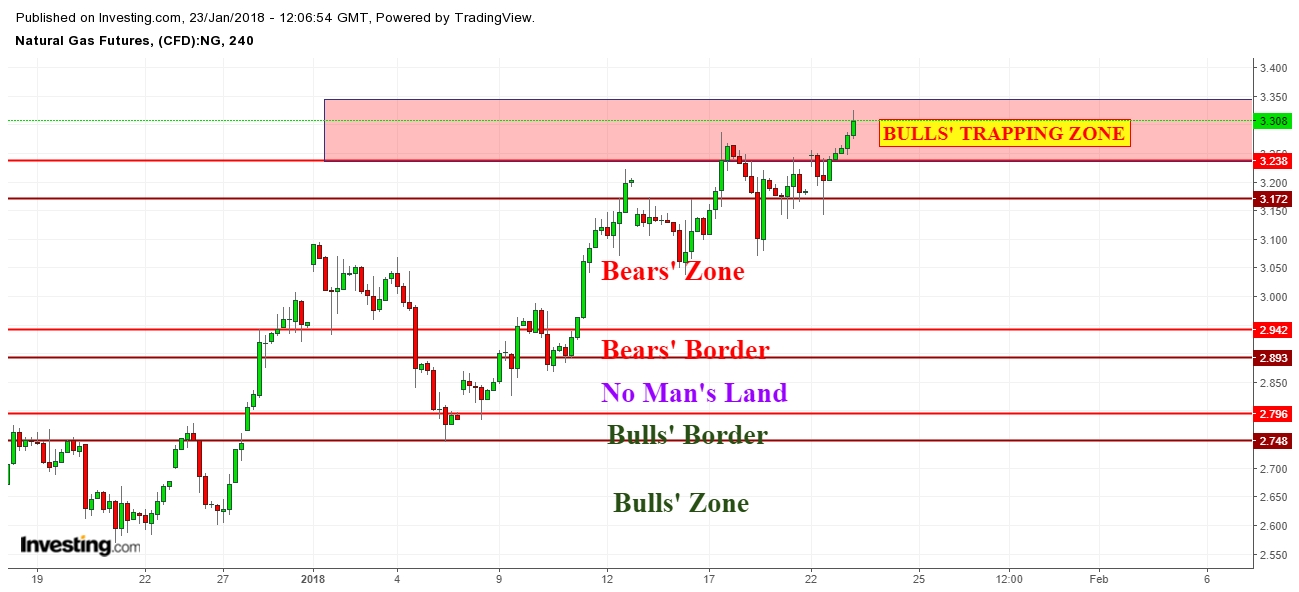
waiting to see if D goes after resistance again.... 3.28
today.....should at least hit 3.165 again
edit.....those sneaky MM's.....lol
now 3.195
cc
Glad sold my D this morning
cc
somewhere about here? ...

Cash$ swinging a buck+ daily, flabbergasts me.
March contract.... 1:25 interesting
notice sell off as moves upward.....hiding it
cc
in D 23.12
cc
not in D yet
cc
wow
.........side line right now
cc
crazy weather here, like spring https://www.usnews.com/news/best-states/washington/articles/2018-01-15/64-degrees-at-seatac-ties-record-high-for-january
64 Degrees at SeaTac Ties Record High for January
Officials say the temperature in SeaTac Monday has tied a record for highest temperature.
SEATAC, Wash. (AP) — Officials say the temperature in SeaTac Monday has tied a record for highest temperature in January.
The National Weather Service in Seattle said on Twitter that at 2 p.m. Monday, it was 64 degrees at the Seattle-Tacoma International Airport.
The weather service says that ties the record high for the month of January.
The record was last set on Jan. 20, 1981.
The record high for Seattle in January is 67 degrees, set on Jan. 28, 1931.
Curious if the dow/s&p will use the SOX year 2000 tech bubble high benchmark as a rewind area.
as noted in the previous chart
I'm wondering if anyone has any historical data regarding a new president's first year with a runaway market and when, statistically, will it pull back?
15 Months+ without a hiccup
I'm convinced shorting the sox via SOXS will be an awesome vehicle when the markets provide a healthy pullback.
question is when
as long as /ES keeps cranking off new highs~ SOX has a chance at the year 2000 Tech bubble high
If it snows here grandkids will come over n hook up their sled to our golf cart and I will pull them around
could get fun
cc
out of D at 25.01
natty goal was 3.03
hit 3.038
edit.... looking possibly getting back into D
23.60 area for next leg up
shall see how chart set up goes
make sure chart doesn't get whacked outa line
cc
wondering if natty goes down further
long term is winter over
does it get to 2.89 for bounce
would put D at 32.92
or does natty break further down because of summer and go to 2.56
shall see
edit..... 3.03 needs hold today....if not could go lower today
cc

Working gas levels are now at 2,767 Bcf in the Lower 48 states. If withdrawals from storage match the five-year average for the remainder of the heating season (October 31- March 31), working gas stocks will total 1,320 Bcf, compared with the five-year average (2013-17) value of 1,697 Bcf. Working gas stocks reached 837 Bcf on March 31, 2014, following withdrawals from storage of 2,958 Bcf during the 2013–14 heating season.
cc
Picked up some D at 22.35
cc
Weekly Natural Gas Storage Report
Updated to week ending 1/5/2018
Week End.....Withdrawal / Bld
1-13-17.........- 243
1-13-18........ - 194 Celsius expected withdrawal
cc
meant to say....shall see where D lands
does it get to 23.64
or 22.30
Entered D in pre-market this morning
almost entered D last night but wouldn't fill my order
glad they didn't.....entered @ 23.30
off to work....welding up metal sign frames for show
back latter today
cc
looking over the historical Cash$ prices
01/04/18 -2.46 @4.42
https://www.investing.com/commodities/natural-gas-contracts?page=chart&symbol=NGY00
Density Max * Week * shaded * 2012-current
https://www.investing.com/commodities/natural-gas-contracts?page=chart&symbol=NGY00&domain=futurespros&display_ice=1&enabled_ice_exchanges=&sym=NGY00&width=550&tblwidth=550&studies=Volume%3B&cancelstudy=&type=AREA&size=L&density=X&a=W
Density Max * Month * shaded * 1994-current
https://www.investing.com/commodities/natural-gas-contracts?page=chart&symbol=NGY00&domain=futurespros&display_ice=1&enabled_ice_exchanges=&sym=NGY00&width=550&tblwidth=550&studies=Volume%3B&cancelstudy=&type=AREA&size=L&a=M&density=X
ODP has interesting chart
Dust....jung
cc
/es makes new highs ~ sox has not
weak participation
SOX finally nearing a rewind area?

meant to say....shall see where D lands
does it get to 23.64
or 22.30
cc
Dude,
With what are going thru,,,,no apology even needed.
Just get well soon and take care of yourself and family.
Just the fact that you are even posting and working during this is a testament to your desire to help all here.
Good luck with the gun show and thank you for dropping by.
SD
MY and others......sorry for not posting
will get with you soon
last 2 weeks been sick with flue
wife now has it
throwing up has not been fun
been drunk before and dry heaved.....but...never from the flue
dry heav lasted for about 15 min....was rough
all I could do was sleep and rest
sleep and rest
today finally feel better
been gone all day puting out signs for gun show
show coming up Feb 3 and 4
will be gone tomorrow trying to fix up my moms house so I can rent it out to pay for her nursing home bills
just supper busy right now....very little sleep or time to play the market
it should rebound soon.....been trading with little movement
causes one to wonder if big boys are unloading on retail
remember the 30 ma
further it gets away from it the more the bounce coming back
compare the different time frames is best advice can give u
some use the 8 and 14 ema's to trade off
use different time frames.....what ever set up u use should work on all time frames
could 23.00 ish be bottom
best of luck
will let u know when move into DGAZ
would be cautious as natty could fall soon
some times not as important to be at the top or bottom of move
but
to be able to be in the up or down move
so
being near the top or bottom can be more important than being at the top or bottom
cc
heating degree days (HDD) and cooling degree days (CDD)
https://blog.wdtinc.com/how-to-use-weather-data-to-estimate-energy-demand-hdds-and-cdds
cc
The bigest return on a chart is the 3rd Leg UP
look for my Dumpster Diving pics..............................................link back for prior pics
GOALS:
1....Start your trade at beginning of run.....not after it begins
2....steady returns of 15 % to 45 % per trade
3....NOT to shoot for the moon
4....Don't hold stinkie pinkies under .50 overnight
5....trade off support and resistance points
6....Before entering ........know where to exit
7.....do your own D * D, buy at your own risk
//////////////////////////////////////////////////////////
GAINNERS LOOSERS
http://finance.yahoo.com/gainers?e=us
////////////////////////////////////////////////////////////
A few education site suggestions:
OTC Markets......SEC Fillings.........................http://www.otcmarkets.com/stock/NAWL/financials and http://www.otcmarkets.com/stock/ONTC/company-info
http://investorshub.advfn.com/boards/board.aspx?board_id=7882..... another site....http://investorshub.advfn.com/boards/board.aspx?board_id=10118
Short Squeeze ..... http://otcshortreport.com/index.php?index=bets&action=view#.VR0-luG19WE
Low Float Explenation & how to trade um...........http://investorshub.advfn.com/boards/read_msg.aspx?message_id=62370553
search back through lowtrade's old posts....very informative..........http://investorshub.advfn.com/boards/board.aspx?board_id=3972
http://investorshub.advfn.com/boards/board.aspx?board_id=10298
News
Data......................http://data.cnbc.com/quotes/BPZR/tab/8.1
GOOGLE NEWS......multiple......https://www.google.com/finance?q=bpzr&ei=-3n7VPn4HoPa8AbZsICoBw
PENNYSTOCKINSIDERS NEWS.............http://www.pennystocksinsiders.com/mediaroom/1448/
P R NEWS........http://www.prnewswire.com/news-releases/
Bloomberg .........Earnings announcements.......................http://www.bloomberg.com/apps/ecal?c=US
Microcap News.................http://www.microcapmarkets.com/news.jsp?sParam=M_A&market=NASDAQ
Chart Patterns .......learn these patterns they are invaluable
http://stockcharts.com/school/doku.php?id=chart_school:chart_analysis:chart_patterns...........................................................http://www.chartpatterns.com/
Clinical Trials - http://www.clinicaltrials.gov/
FINRA Daily Short List - www.regsho.finra.org/regsho-Index.html
Floats - http://investorshub.advfn.com/boards/board.aspx?board_id=15223
Form 4 Filings - http://www.secform4.com/index.php
Google News Business - http://news.google.com/?ned=us&topic=b
Google News Home - http://news.google.com/
Holiday Schedule for Stock Markets - http://www.allstocks.com/html/stock_markets_holidays.html
High Short Interest Stocks - http://www.highshortinterest.com/
Insider Buy & Sell Info - http://www.insidercow.com/latestFillings/buyByCompany.jsp;jsessionid=00CD11F05D6090BBECE249167FD45A5B
Low Float Stocks - http://www.lowfloat.com/
MicrocapMarkets NASDAQ <$5 - http://www.microcapmarkets.com/data_main_nav.jsp?market=NASDAQ
MicrocapMarkets OTCBB - http://www.microcapmarkets.com/data_main_nav.jsp?market=OTCBB
Mining - http://www.miningmx.com/
Naked Shorting - www.businessjive.com/
Patterns - http://thepatternsite.com/
Pinksheets Stock Info - www.otcmarkets.com/pink/index.jsp
REG SHO List - www.regsho.com/tools/short_list.php
Reverse Merger Report - http://reversemerger.dealflowmedia.com
Reverse Splits - http://investorshub.advfn.com/boards/board.aspx?board_id=3017
Searching Blogs, News, etc. - http://www.icerocket.com/
Shell Stocks - http://www.shellstockreview.com
SHO Threshold List - http://www.nasdaqtrader.com/Trader.aspx?id=RegSHOThreshold
Short Stocks - http://shortsqueeze.com/
Stock Chart Patterns - www.trending123.com/patterns/index.html
Stock Promotions - www.stockpromoters.com
Stock Promotions - www.stockreads.com/
Stock Research - http://www.stockhouse.com
Trading Halts - http://www.nasdaqtrader.com/Trader.aspx?id=TradeHalts
Transfer Agent Contact Information - http://investorshub.advfn.com/boards/board.aspx?board_id=10067
Transfer Agents in the United States - http://www.stocktransfer.com/index.cfm?action=about.network.transferAgents
Technical Analysis Chart Lessons
1 ....... Commodity Channel Index (CCI) 48/70 ........explenation for using in charts ...... see scans below
http://investorshub.advfn.com/boards/read_msg.aspx?message_id=58320577
2....... Using The CCI Indicator With The Candlestick "Reversal Bar" Pattern
•Reversal Bars work best in a developed trend - If a trend has been going for some time, then it is reasonable to wonder when it is going to end. The reversal bar can help. If a trend has previously been down, then the reversal bar (bar #2) should make a lower low.
•Close should be greater than the previous close: Not only should the price reverse back up, but it should do so convincingly.
•Close should be greater than the open: At the end of the day there is more interest in buying the market than selling it.
I have marked the outside -200/+200 range in red lines, and the mid -100/+100 range in blue lines.
If you look at the example chart above and try to interpret the CCI without taking into account the Reversal bars, which are marked, then we have 2 situations where we have the CCI indicating the change of trend. The potential change in trend is indicated by the fact that the CCI has reached -200 or + 200 and is either overbought or oversold.
The first blue circle shows an oversold situation, where the CCI has turned up from the -200 level. This is an indication to go long and I would wait for the CCI to cross the -100 level before entering a trade.
The second red circle shows an overbought situation along with divergence, which is a strong signal to go short. Similarly, one would wait for the CCI to cross the +100 level down, before taking a short position.
The problem is that the CCI indicator is not strong enough as a stand alone method but when you also use reversal bars as a confirmation, it can be very accurate
There are 4 Reversal Bars marked on the chart, as these bars satisfy all the 3 conditions mentioned above to qualify as Reversal Bars. All 4 of the reversal bars resulted in a profit but the Reversal bars 2 and 4 occur around the time the CCI was overbought/oversold, which gives the trade an additional confirmation.
Below is the link and rules for using the CCI Indicatots :
http://investorshub.advfn.com/boards/read_msg.aspx?message_id=59051282
(Interesting charts and Data as updated)
http://www.fao.org/worldfoodsituation/FoodPricesIndex/en/
SCANS
the simpler the scan the better it is
1........Doji
[type = stock] and [country = us] and [volume > 500,000] and [close > .10 ] and [close < 3.00] and [1 day ago close < 2 days ago close] and [ today's close = today's open] and [ today's low < today's close]
2 ....... 5 cross 10
[type = stock] and [volume > 100000] and [country is US] and [Close > 0.04] and [Close < 0.9] and [2 day's ago Stoch RSI(10) <= 0.20] and [Stoch RSI(10) > 0.20] and [Stoch RSI(20) > 0.05] and [Stoch RSI(30) > 0.05] and [Close > Open] and [Williams %R (14) > yesterday's Williams %R (14)]
3......... EMA-4 cross EMA-12.....you can substitute EMA's
[type = stock] and [country = us] and [daily sma(20,daily volume) > 500000] and [Volume > 499,999] and [Close < 3.00] and [today's ema(4,close) >= today's ema (12,close)]and [yesterday's ema(4,close) <= yesterday's ema (12,close)] and [ close > .10 ]
5......CCI-48 .......
- 100 .... can possibly produce ADX cross
[type = stock] and [country = us] and [daily volume > 500000] and [Close < 3.00 ] and [today's CCI(48) > -100 ] and [close > .10] and [3 day's ago CCI(48) < -100]
+ 100..... can possibly produce 3rd or 5th Fib. wave, see A T & T chart above
[type = stock] and [country = us] and [daily volume > 500000] and [Close < 3.00 ] and [close > .10] and [3 day's ago CCI(48) < 100] and [today's CCI(48) > 100 ]
6.......CCI - 70.....
- 100 ...... can possibly produce ADX cross
[type = stock] and [country = us] and [daily volume > 500000] and [Close < 3.00 ] and [today's CCI(70) > -100 ] and [close > .10] and [3 day's ago CCI(70) < -100]
+ 100..... can possibly produce 3rd or 5th Fib. wave, see A T & T chart above
[type = stock] and [country = us] and [daily volume > 500000] and [Close < 3.00 ] and [close > .10] and [3 day's ago CCI(70) < 100] and [today's CCI(48) > 100 ]
......Acording to J. Peter Steidlmeyer who used to be on the Chicago Board of Trades.
In Bull Markets
1....Lows on Monday's and Tuesdays'
2....Profit on Thursdays' and Friday's
In Bear Markets
1....Highs on Mondays and Tuesdays
2....Lows on Thursdays and Fridays
Characteristics of Waves ...............http://investorshub.advfn.com/boards/read_msg.aspx?message_id=111801236
Check History....Due Dilligance ..........http://finance.yahoo.com/q?s=ungs&ql=1 ................http://www.otcmarkets.com/stock/ungs/quote
Thanks for stopping by
good luck trading
| | ||
| Volume | |
| Day Range: | |
| Bid Price | |
| Ask Price | |
| Last Trade Time: |