 News
News  Market Data
  Discover
Support: 888-992-3836
Copyright © 2023 InvestorsHub Inc.


Register for free to join our community of investors and share your ideas. You will also get access to streaming quotes, interactive charts, trades, portfolio, live options flow and more tools.
OTC/pink companies release what ever information which will help sell shares. They disclose filings, un-audited, to pinksheets or the OTC. They do NOT inform the public of all pertinent information required by SEC listed rules. Not only you can't find information needed for logical purchase decisions. BUT the info you read can't be trusted as accurate. That's whay one should not invest long in non listed companies. They are opperating in the lawless wild west.
ATYG still has bad darkmasters and may fall appart. MDGC is in flag mode. Watch for top resistance @ .0055 break to chart patten of .0085.
ISMI still way early, DGRI still over waiting for FIBs 1st bounce.
Never believe the PR story, trade the retail reaction to it!
Offering dividend shares to shareholders of one shell company from the merger (reverse or forward) shell subsidiarity company is a typical midstrean ploy used ALL THE TIME.
You usually see this in month 2, of a 3 month temp job play. When the company management doesn't have the story lined up well. They miss a promised goal or have no new news waiting to release on their desk. So the retail herd's interest falls and the stock price retraces past exceptable FIBs levels, for continuation past previous highs.
So they need to go to plan "B" and start a new story line all together, to get retail interest back. Never believe the PR story, trade retail reaction to it. I've seen plenty dividend deals from subs and parants OTC companies, BUT not once seen 1 retail shareholder recieve 1 extra free share promised or promoted.
Now I'll look at the chart.
No price pull down, no long accumulation seen. A out of the blue price and volume surge, which didn't get enough retail interest. (volume did NOT rise to 10 mil a day for a double zero stock)
So this PR noise is not mid stream, like normal. It seems to be more desperation and inexperience. There is potencial in the chart, but it is NOT typical. Worth watching to see how retail reacts in the future. But because it seems to be controled by inexperienced dask player. If anything happens to the price, I'd expect it to be quick, strong and gone. Act fast if played. Pocket those profits every day, and re-enter on continued price emotion. This one could end up like ECDC, with 1 or 2 day surges and back to the begining till the next pop.
Like any craft, drawing lines on charts is a skill needing experience. Don't get discouraged. Keep at it.
You couldn't find where to draw chart pattern lines because there are none.
As for share structure and TA indicati they all tie in with the game. But when evaluating charts for technical analysis, you should keep your eye on the chart. Don't present other factors into you chart pattern search. Keep it basic, simple and clean. There is either a pattern, with projected price target or not. All charts don't have patterns.
If your trading style allows trading TA indicators, then second evaluate the incdicators, to see if an entry without price target is warranted. One can always buy and sell without targets to plan for. I just don't. Doesn't mean one style is better then another.
Next you also involve the share structure into the mix. That end of the OTC game play is more for mental comfort, within ones decision to play, more then a reason to buy.
I can see by your question structure, you are grasping everything involved in playing the game. But you may be creating confusion, by adding the clutter or 3 seperate evaluations in one over all eval.
To rap this up. Your on the right path, just trying to concider all, rather then 1 at a time. Your not at that experience level yet. Lets step back and find chart patterns first. Then evaluate TA indicators for entry/exit signals and share structure and story line for comfort in decision making.
UNQT
TA indicators are weak positive, Shares may be the hands of big guys, so play may occur. There is no chart pattern with projected price movement target yet.
Walk before you run. Take things 1 step at a time. All the elements are not right, as you say. They are leaning positive, with no actual indications for when change may occur or how far that change could go.
I ofter post, trade what you want, not what is in front of you. UNQT is in front of you and it looks positive. I want projections in place, action seen, and comfort my entry will be supported by the darkside on OTC plays. Then I'll say "all elements are right"
This one is lacking, for now. No pattern projestion and weak positive TA.
CCI is like what I use on the S&P for evaluation of changes from the norm, in the over all market sentiment. I call it the rubber band effect, using moving average though. The thought is when extreme levels are reached, reversal or correction can be expected, back to the norm.
CCI is a trend indicator. It is an oscillator and it indicates over bought and over sold positions in any chart evaluated. Some publications call it a momentium indicator, which I disagree with. Oscilator indicator normally do show strength to trend, or momentium, but in CCI case, IMO the math is based on trend and It should indicate trend and when trend reversal can be expected, more then the momentium behind the trend.
All indicators will show more then 1 thing within it's graph. And stepping back to basics, CCI is designed to see trend, more then strength or entry/exit, while it does offer those indications also.
So yes a reversal in price direction could be expected when any oscilator indicator reaches extreme. But one should not trade on that alone. Trend is a support indication, not enter/exit one.
IMO this TA indicator should be used to support your entry decision, once a reversal occures. Not create a buy signal at over bought or sold. I feel the same about all oscilators in general. Just like I do not recommend buying before action is seen in chart patterns. Buying an over bought or sold TA oscilator can create early entries or exits before reality sets in. There is a center line with all oscilator graphs. That is usually the entery/exit point.
KIWB- Lowtrade could you take a look at this chart and let me know what you think.
Mikee, I totally agree. This is the best board on iHub bar none imho. The info I passed on came from the Pink Sheets website. your welcome
Thanks hereigo. May I ask where did you find that info, I missed it? IMO This board is the best educational forum. People always willing to help!
Kar1234, I'm giving my oponion on MDCE in hopes that Lowtrade will correct me when I'm wrong and aid me in the learning process.I believe MDCE is done it bounced from below 61 FIBs and there has been no STORY to prop up price,also it looks to me the darkside has sold all their shares and are gone.
Mikee, 12 million shares were registered in March @.015. As yourself Ihave been following lowtrade and learning for some time now,therefore double checking with Lowtrade would prudent.
yep with pinksheets, it is russian roulette with debt to share conversions, if they don't give details, now that is a matter of time they get diluted to oblivion, i call that the dumb pinksheets,
the smart pinksheet do a debt conversion away above the price today, so people think wow it is worth that much, so price appreciates
jmho
A reporting entity is, but a NON reporting entity, good luck with that.
Thank you. Just came across it today. Did a little DD. I'll keep an eye on it
The securities industry is highly regulated, both on the state and national levels. A publicly owned and traded equity, by law, must release any private placement information to the government as well as to its shareholders. If you as a shareholder did not receive detailed information to your satisfaction, it is your responsibility to contact the company by mail or phone.
Most QB stock do, Pinks rarely ever. Normal range is 15-30% of share price over a 10 day period of the 3 lowest trading closes. That is QB and some can go as high as 50% on those depending on the company at time of retaining the loan. Pinks are worse, yes some as much 70-80% on the very worst no information pinks. But you will not see that disclosed on a Pink security. How many people are going to like reading that a financier can sell all day long at .0001 and make money?
LT. In your experience do companies make public the conversion rate for funding?? Stock is SPLI. March 27 there was a PR that funding was recieved but no detail about the funding. Thank you. Enjoy the rest of the weekend.
$MDGC is Dark/CE but expect current status next week. Chart is a strong technical play imo.
Just saw that one. Looks like first resistence now 0.0021
Thanks
I think ATYG was discussed here friday
lowtrade
Any changes in ATYG and MDGC from your previoius resistences
Last time you have mentioned ATYG: 0.0032 and MDGC 0.0055 resistences
lowtrade
Any changes in ATYG and MDGC from your previoius resistences
Last time you have mentioned ATYG: 0.0032 and MDGC 0.0055 resistences
TTDZ good info.2000% a day when nasdaq IPO will take place,this will be our life changer.don't forget PPS was .02 when company had loses.now it's a profitable,with 6.3m rev.(last friday's 10Q)
lowtrade, ISIM was on you watch list
is it still trading in the range where there can be a big spike in the future ?
tia
is DGRI ready for a bounce ? what are the ranges you see
thanks for your advice
hugo
Lowtrade, TTDZ is a stock that I am looking into and have been pretty heavily researching it. I first wanted to ask you what you think of the chart, especially the recent spikes in volume.
I also wanted to note that TTDZ is doing a reverse merger with its subsidiary company called eFactor. Now, eFactor is going through the process of getting listed on the NASDAQ and has recently announced that each investor of TTDZ will be given a dividend payment of shares in eFactor's IPO. For every 64 shares of TTDZ owned, the shareholder will receive 1 share of eFactor (which is aiming to get an IPO of $1.40).
I just wanted to ask you your take on the chart for the short term, as well as this dividend deal. It could take awhile for eFactor to get listed on the NASDAQ, but it sounds like a pretty sweet deal for the TTDZ shareholders. Have you ever seen this before? What are your thoughts?
Thanks so much! Great board.
Hello Lowtrade
Thank you very much for reply. uptill now, this is most dificult part for me to catgorize, which pattern is in formation. i hope, I will get better at it with your guidance, practice and experience.
Now UNQT
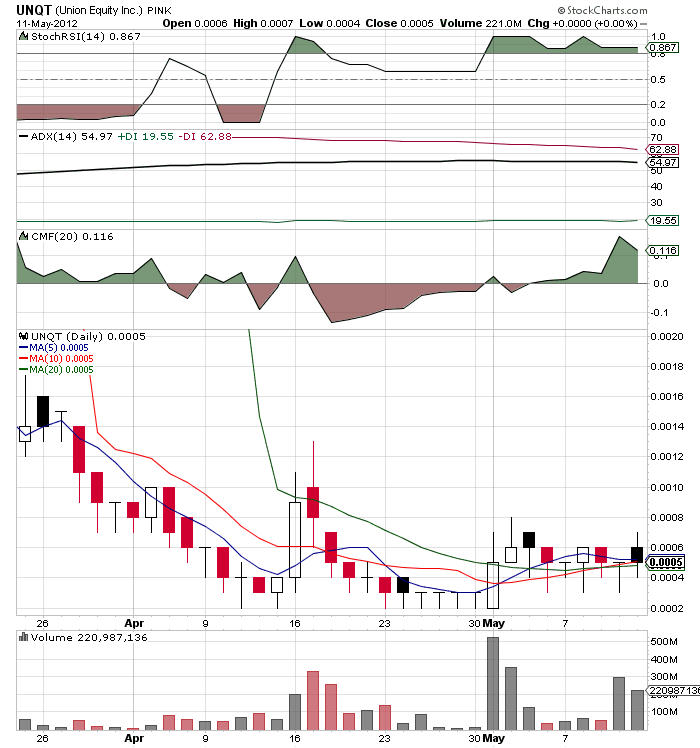
It seems to be making 3 spikes of more than 100 mil in 2 months time. there is price drop if we see 6 months chart. and there is PR of acquiring a company for unspecified numbers of restricted shares and cash. I was reading somewhere that in pennyland restriction on shares means not much, as mostly shares are allocated under 504, and those can be sold any time. If I am understanding it correct?
comming back to UNQT chart, MA seems to be in right postion, support indicators stoch RSI and CMF are positive.
I drew many lines to delineate chart pattern but failed to reach any conclusion, which pattern it will fit into?
comming to otc game, all the elements seems just right for a run.
is it?
Lowtrade. What do you think of the CCI indicator? I was told that if it got down in the "brown" it was oversold, and would be a point to buy. It it moved over to the green, it would be getting ready to be sold if it started to really peak.
What are your thoughts on this?
LT likes Blue Star- this has the fix'ns for a movie. J/k
Very true...I watched it all day or part of the day, and as I refreshed I saw some big names in it...I'm sure there were more "reds" going home today than "greens".
We shall see what happens, but if it comes out to be APS, then well...hopefully peeps make their money back, if they held on.
Love and Gains.
bw.
Sorry to hear that. Whoever did it, timed it perfectly , right after SNPK APS huge success , whom wouldn't want another.
A lot of peeps suffered today.
It was false claimed that APS is promoting it. And when the truth came out, you saw what happened, major collapse.
Do not touch it. It been burned.
I was wondering about that myself. The under 5% difference says double top but the look of it says head and shoulders. Either way it's not good and it's hard to get interested in putting money at risk on the long side in the current environment. Maybe some pennies will start to work for more than a day or so.
Looks like a head and shoulders with a target of 1290. May take awhile to get there but it probably will.
http://stockcharts.com/h-sc/ui?s=$SPX&p=D&yr=0&mn=4&dy=0&id=p04310408409&a=266966194
Now how are you feeling
Thanks much lowtrade.. I've watched it for roughly three years and never been in it. Maybe the new VC firm will have better ideas how to stimulate some retail bounces for awhile. Good stuff!!
SVMI is about ready to explode. MM's loaded up at .006 right at the double bottom...check it out.
Ya hooo Friday and the S&P is holding 1360. At least for now.
Thanks for the responding back I read and learn alot from your postings!
Thanks, lowtrade.
I thought it was a Descending Triangle; Financials next week
When you think there is a bottom forming, put it on watch and plan your trade for 1st resistance break bottom bounce play.
It has also broken the lower channel and old descending triangle support line. Not looking good, management knows how to get their run going. Best they could do, is PR a stall, causing the price to walk out of the triangle, cauing it to fail then channel. That channel is now failing.
Keep on strong watch until it lets loose south. If it hangs a few days, the dark master has a chance to correct their mistakes and buy the damn run. Watch the volume. If it falls to far below the needed 10 mil a day for a double zero stock. More trouble for the darkside.
Lowtrade - VPER, possible Falling Wedge Reversal. The MACD and PPO histograms show a positive divergence but my concern is that the indicators still have a negative divergence. Plus there is little volume. It does look like we have reached a bottom and it's leveling off. What's your take on this chart?
Don't care about the promo, care about the retail herds reaction to it. You trade the stock, not story on the OTC.
RARS is this weeks flavor of the week. Retail bougth the ice cream, but didn't like it.
It had bad news or failed to meet expections.
When you think there is a bottom forming, put it on watch and plan your trade for 1st resistance break bottom bounce play.
But TA doesn't see any end in the decline at all. The candle tails all being down, with finish high is telling me many retail agree with you, but are not committed. They want, but won't support. That is also why you see good CMF buy pressure. The days finish has alot to do with where shares are calculated.
imho ATYG has now to cross over the 50 ma again, and since it was a time that 50ma was supported , i gues it becomes resistance
but what do i know lol
| Volume | |
| Day Range: | |
| Bid Price | |
| Ask Price | |
| Last Trade Time: |


