News
News  Market Data
  Discover
Support: 888-992-3836
Copyright © 2023 InvestorsHub Inc.


Register for free to join our community of investors and share your ideas. You will also get access to streaming quotes, interactive charts, trades, portfolio, live options flow and more tools.
ETF's......UVXY.....SVXY
cc
natty info
Point Logic....daily analysis
Market Analysis
Daily analysis of the spot-traded physical natural gas market, including coverage of key elements like weather, storage, and pipeline data.
https://www.pointlogicenergy.com/products.html
cc
national cash prices....Demand vs Supply...Short Volume
Short Volume Chart....Daily........HDD 30Y Diff
National cash prices - nationwide chart
http://www.naturalgasintel.com/
Demand vs Supply
https://www.eia.gov/naturalgas/weekly/#tabs-supply-2
Short .....Volume
http://volumebot.com/?s=UGAZ
https://shortpainbot.com/?s=ugaz
Short Volume Chart....Daily
Gas Weighted Degree Days (CONUS)
http://volumebot.com/?s=UGAZ
HDD 30Y Diff
https://truewx.com/energy/ecmwfens/
cc
Economic Calendar....natty weekly projection
https://www.investing.com/economic-calendar/
Official storage report
http://ir.eia.gov/ngs/ngs.html
cc
Weekly Natural Gas Storage Reports
http://americanoilman.homestead.com/gasstorage.html
cc
Short Volume Chart....Daily
Gas Weighted Degree Days (CONUS)
http://volumebot.com/?s=UGAZ
HDD 30Y Diff
https://truewx.com/energy/ecmwfens/
cc
Short Volume Chart....Daily
http://volumebot.com/?s=UGAZ
cc
Natural gas: The fracking fallacy
The United States is banking on decades of abundant natural gas to power its economic resurgence. That may be wishful thinking.
03 December 2014
https://www.nature.com/news/natural-gas-the-fracking-fallacy-1.16430
cc
MISO gas-fired generation falls 17pc in March
12 May 2017 16:29 (+01:00 GMT)
Houston, 12 May (Argus) — Natural gas-fired generation in the Midcontinent Independent System Operator (MISO) footprint fell in March from a year earlier amid rising gas prices and higher wind and coal generation.
Gas accounted for 22.2pc of the MISO generation fuel mix in March, down from 26.5pc a year earlier, according to the grid operator. The data implies electricity generation from gas-fired power plants in the MISO area decreased by 17pc in March from a year earlier to about 10.5TWh.
Total electric demand in that month fell by 1pc from a year earlier to about 47.4TWh.
Rising gas prices and a warmer-than-normal winter have cut power sector gas demand in the earlier months as well. Gas-fired generation in the first quarter is down by about 28pc from a year earlier, according to MISO data.
Total electric demand in the first quarter of 2017 was down by 6pc from a year earlier.
Spot gas prices at key midcontinent hub like the Chicago Citygates in the first quarter averaged $2.97/mmBtu, up by 47pc from a year earlier. Prices in March were 59pc higher than March 2016.
Meanwhile, prices for Illinois basin coal in March was down by 1.7pc from a year earlier, according to MISO.
The lower coal prices could have incentivized utilities to dispatch more coal-fired generation.
Coal accounted for 42.2pc of MISO fuel-mix in March, up from 40.5pc a year earlier. That translates to utilities in the region dispatching about 20TWh in March to meet demand, 3pc higher than March 2016.
Coal generation in the first quarter was less than 1pc lower from last year.
Wind accounted for 11.4pc of the MISO March generation fuel mix, producing about 5.4TWh, 25pc more than last year. Wind generation in the first quarter was up by 16pc from a year earlier.
Gas-burn this summer should pick up from current levels, MISO said.
"Compared to last year, we expect similar gas generation for the summer [and] capacity use will be largely driven by price," MISO said.
MISO expects peak electricity demand this summer will be 125GW, 3.6pc higher than last summer's actual peak load of 120.7GW based on forecasts of a warmer-than-normal season.
Longer term, the midcontinent operator continues to see the resource fleet mix in the region transition from coal to more gas, wind and solar.
cc
Understanding Volume & Open Interest in Commodities: Learning Center
Technicians utilize a three dimensional approach to market analysis which includes a study of price, volume and open interest. Of these three, price is the most important. However, volume and open interest provide important secondary confirmation of the price action on a chart and often provide a lead indication of an impending change of trend. For beginning students of the market these two concepts tend to be somewhat confusing but are very important concepts to understand in- undertaking a thorough analysis of market action.
Volume represents the total amount of trading activity or contracts that have changed hands in a given commodity market for a single trading day. The greater the amount of trading during a market session the higher will be the trading volume. As mentioned earlier, a higher volume bar on the chart means that the trading activity was heavier for that day. Another way to look at this, is that the volume represents a measure of intensity or pressure behind a price trend. The greater the volume the more we can expect the existing trend to continue rather than reverse. Technicians believe that volume precedes price, meaning that the loss of upside price pressure in an uptrend or downside pressure in a downtrend will show up in the volume figures before presenting itself as a reversal in trend on the bar chart.
Open Interest is the total number of outstanding contracts that are held by market participants at the end of each day. Where volume measures the pressure or intensity behind a price trend, open interest measures the flow of money into the futures market. For each seller of a futures contract there must be a buyer of that contract. Thus a seller and a buyer combine to create only one contract. Therefore, to determine the total open interest for any given market we need only to know the totals from one side or the other, buyers or sellers, not the sum of both.
Each trade completed on the floor of a futures exchange has an impact upon the level of open interest for that day. For example, if both parties to the trade are initiating a new position ( one new buyer and one new seller), open interest will increase by one contract. If both traders are closing an existing or old position ( one old buyer and one old seller) open interest will decline by one contract. The third and final possibility is one old trader passing off his position to a new trader ( one old buyer sells to one new buyer). In this case the open interest will not change. By monitoring the changes in the open interest figures at the end of each trading day, some conclusions about the day?s activity can be drawn. Increasing open interest means that new money is flowing into the marketplace. The result will be that the present trend ( up, down or sideways) will continue. Declining open interest means that the market is liquidating and implies that the prevailing price trend is coming to an end. A knowledge of open interest can prove useful toward the end of major market moves. A levelling off of steadily increasing open interest following a sustained price advance is often an early warning of the end to an uptrending or bull market.
The relationship between the prevailing price trend, volume, and open interest can be summarized by the following table.
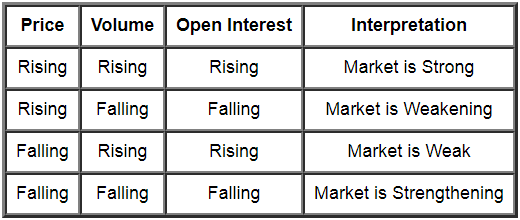
It is important to understand that the commodity price chart only records the data. In itself, it has little value. By monitoring the price trend, volume and open interest the technician is better able to gauge the buying or selling pressure behind market moves. This information can be used to confirm a price move or warn that a price move is not to be trusted. This will provide you with valuable information to develop a suitable pricing strategy and an appropriate production-marketing plan for your farming operation.
http://futures.tradingcharts.com/learning/volume_open_interest.html
Top 50 open source web crawlers for data mining
http://bigdata-madesimple.com/top-50-open-source-web-crawlers-for-data-mining/
cc
Scrapy....web crawler-scraping site is a fast open-source high-level screen scraping and web crawling framework written in Python, used to crawl websites and extract structured data from their pages. It can be used for a wide range of purposes, from data mining to monitoring and automated testing.
https://stackoverflow.com/tags/scrapy/info
difference between web-crawling and web-scraping?
list of crawlers and scraping
https://stackoverflow.com/questions/4327392/what-is-the-difference-between-web-crawling-and-web-scraping
Scrapy Tutorial
http://scrapy.readthedocs.io/en/latest/intro/tutorial.html
Web scraping, to use a minimal definition, is the process of processing a web document and extracting information out of it. You can do web scraping without doing web crawling.
Web crawling, to use a minimal definition, is the process of iteratively finding and fetching web links starting from a list of seed URL's. Strictly speaking, to do web crawling, you have to do some degree of web scraping (to extract the URL's.)
difference between these two. One refers to visiting a site, the other to extracting
https://stackoverflow.com/questions/4327392/what-is-the-difference-between-web-crawling-and-web-scraping
what’s the difference between scraping and crawling?
https://www.promptcloud.com/data-scraping-vs-data-crawling/
cc
How Internet Search Engines Work
http://computer.howstuffworks.com/internet/basics/search-engine1.htm
HOW SEARCH ENGINES WORK
AND A WEB CRAWLER APPLICATION
http://www.micsymposium.org/mics_2005/papers/paper89.pdf
cc
Web Crawlwers....Data minning
GOOGLE bots.....must read
https://varvy.com/googlebot.html
https://support.google.com/webmasters/answer/182072
https://sourceforge.net/projects/goldbug/files/pandamonium-webcrawler/
********** list of BOTS *****************
http://bigdata-madesimple.com/top-50-open-source-web-crawlers-for-data-mining/
https://www.elastic.co/products
http://stormcrawler.net/
***** https://www.nohodo.com/ *****
**** http://sp.nohodo.com/signup/ ****
******** Robots Database ********
read about Robots usage rules.....https://moz.com/learn/seo/robotstxt
http://www.robotstxt.org/
http://www.robotstxt.org/db.html
ABCdatos BotLink
Acme.Spider
Ahoy! The Homepage Finder
Alkaline
Anthill
Walhello appie
Arachnophilia
Arale
Araneo
AraybOt
ArchitextSpider
Aretha
ARIADNE
arks
AskJeeves
ASpider (Associative Spider)
ATN Worldwide
Atomz.com Search Robot
AURESYS
BackRub
Bay Spider
Big Brother
Bjaaland
BlackWidow
Die Blinde Kuh
Bloodhound
Borg-Bot
BoxSeaBot
bright.net caching robot
BSpider
CACTVS Chemistry Spider
Calif
Cassandra
Digimarc Marcspider/CGI
Checkbot
ChristCrawler.com
churl
cIeNcIaFiCcIoN.nEt
CMC/0.01
Collective
Combine System
Conceptbot
ConfuzzledBot
CoolBot
Web Core / Roots
XYLEME Robot
Internet Cruiser Robot
Cusco
CyberSpyder Link Test
CydralSpider
Desert Realm Spider
DeWeb(c) Katalog/Index
DienstSpider
Digger
Digital Integrity Robot
Direct Hit Grabber
DNAbot
DownLoad Express
DragonBot
DWCP (Dridus' Web Cataloging Project)
e-collector
EbiNess
EIT Link Verifier Robot
ELFINBOT
Emacs-w3 Search Engine
ananzi
esculapio
Esther
Evliya Celebi
FastCrawler
Fluid Dynamics Search Engine robot
Felix IDE
Wild Ferret Web Hopper #1, #2, #3
FetchRover
fido
Hämähäkki
KIT-Fireball
Fish search
Fouineur
Robot Francoroute
Freecrawl
FunnelWeb
gammaSpider, FocusedCrawler
gazz
GCreep
GetBot
GetURL
Golem
cc
Graph - Commitment of Traders - Natural Gas - Futures Only
Graph....open interest...merchant short/long...Swap Dealer short/long
https://www.quandl.com/data/CFTC/NG_F_ALL-Commitment-of-Traders-Natural-Gas-Futures-Only-023651
3 Month
https://www.quandl.com/data/CFTC/NG_F_ALL-Commitment-of-Traders-Natural-Gas-Futures-Only-023651
1 year
https://www.quandl.com/data/CFTC/NG_F_ALL-Commitment-of-Traders-Natural-Gas-Futures-Only-023651
cc
NOAA & European Weather Maps
ECMWF.....European Weather Maps
Can give you CFS...ECMWF...GFS or GDPS Maps
http://www.pivotalweather.com/model.php?m=ECMWF
******** Tropical TidBits.....weather forecast models ***********
http://www.tropicaltidbits.com/analysis/models/?model=gfs-ens®ion=us&pkg=z500a&runtime=2017070806&fh=30&xpos=0&ypos=308
****** NatGasWeather forcasts ******
http://www.natgasweather.com/
NOAA weekly weather forecast & Climate Prediction ******
Digital Weather Prediction
http://digital.weather.gov/
Weekly Weather Prediction
http://www.weatherstreet.com/states/u-s-min-temperature-forecast.htm
Climate Prediction Center
http://www.cpc.ncep.noaa.gov/products/predictions/long_range/two_class.php
CFTC COMMITMENTS OF TRADERS REPORT
http://www.naturalgasintel.com/CFTC
6 to 10 Day Weather outlook.....and
8 to 14 DAy Weather outlook
http://www.cpc.ncep.noaa.gov/products/predictions/610day/index.php
cc
Future LNG usage for World....China....Asia....Europe
https://www.cfr.org/sites/default/files/report_pdf/Discussion_Paper_Cronshaw_Grafton_Hughes_Gas_in_Asia-Pacific_OR_1.pdf
https://www.iea.org/publications/freepublications/publication/PartnerCountrySeriesTheAsianQuestforLNGinaGlobalisingMarket.pdf
cc
NOAA & European Weather Maps
ECMWF.....European Weather Maps
Can give you CFS...ECMWF...GFS or GDPS Maps
http://www.pivotalweather.com/model.php?m=ECMWF
****** NatGasWeather forcasts ******
http://www.natgasweather.com/
NOAA weekly weather forecast & Climate Prediction ******
Digital Weather Prediction
http://digital.weather.gov/
Weekly Weather Prediction
http://www.weatherstreet.com/states/u-s-min-temperature-forecast.htm
Climate Prediction Center
http://www.cpc.ncep.noaa.gov/products/predictions/long_range/two_class.php
CFTC COMMITMENTS OF TRADERS REPORT
http://www.naturalgasintel.com/CFTC
6 to 10 Day Weather outlook.....and
8 to 14 DAy Weather outlook
http://www.cpc.ncep.noaa.gov/products/predictions/610day/index.php
cc
they are back to their lows
cc
NOAA & European Weather Maps
ECMWF.....European Weather Maps
Can give you CFS...ECMWF...GFS or GDPS Maps
http://www.pivotalweather.com/model.php?m=ECMWF
NOAA weekly weather forecast & Climate Prediction ******
Digital Weather Prediction
http://digital.weather.gov/
Weekly Weather Prediction
http://www.weatherstreet.com/states/u-s-min-temperature-forecast.htm
Climate Prediction Center
http://www.cpc.ncep.noaa.gov/products/predictions/long_range/two_class.php
CFTC COMMITMENTS OF TRADERS REPORT
http://www.naturalgasintel.com/CFTC
6 to 10 Day Weather outlook.....and
8 to 14 DAy Weather outlook
http://www.cpc.ncep.noaa.gov/products/predictions/610day/index.php
cc
Feb 19 = RED
cc
2017 Weather.....Almanac
“Cold Man Winter did seem to be on vacation last year thanks to a very strong El Niño, but this year he’s back.” – Editor Peter Geiger, Philom

NOAA & European Weather Maps
ECMWF.....European Weather Maps
Can give you CFS...ECMWF...GFS or GDPS Maps
http://www.pivotalweather.com/model.php?m=ECMWF
NOAA weekly weather forecast & Climate Prediction ******
Digital Weather Prediction
http://digital.weather.gov/
Weekly Weather Prediction
http://www.weatherstreet.com/states/u-s-min-temperature-forecast.htm
Climate Prediction Center
http://www.cpc.ncep.noaa.gov/products/predictions/long_range/two_class.php
CFTC COMMITMENTS OF TRADERS REPORT
http://www.naturalgasintel.com/CFTC
cc
NOAA weekly weather forecast & Climate Prediction
http://www.weatherstreet.com/states/u-s-min-temperature-forecast.htm
Climate Prediction Center
http://www.cpc.ncep.noaa.gov/products/predictions/long_range/two_class.php
CFTC COMMITMENTS OF TRADERS REPORT
http://www.naturalgasintel.com/CFTC
cc
NOAA weekly weather forecast & Climate Prediction
http://www.weatherstreet.com/states/u-s-min-temperature-forecast.htm
Climate Prediction Center
http://www.cpc.ncep.noaa.gov/products/predictions/long_range/two_class.php

cc
Bredesen Alzheimer's Disease Research
Patient one: therapeutic program
As noted above, and following an extended discussion of the components of the therapeutic program, the patient began on some but not all of the system: (1) she eliminated all simple carbohydrates, leading to a weight loss of 20 pounds; (2) she eliminated gluten and processed food from her diet, and increased vegetables, fruits, and non-farmed fish; (3) in order to reduce stress, she began yoga, and ultimately became a yoga instructor; (4) as a second measure to reduce the stress of her job, she began to meditate for 20 minutes twice per day; (5) she took melatonin 0.5mg po qhs; (6) she increased her sleep from 4-5 hours per night to 7-8 hours per night; (7) she took methylcobalamin 1mg each day; (8) she took vitamin D3 2000IU each day; (9) she took fish oil 2000mg each day; (10) she took CoQ10 200mg each day; (11) she optimized her oral hygiene using an electric flosser and electric toothbrush; (12) following discussion with her primary care provider, she reinstated HRT (hormone replacement therapy) that had been discontinued following the WHI report in 2002; (13) she fasted for a minimum of 12 hours between dinner and breakfast, and for a minimum of three hours between dinner and bedtime; (14) she exercised for a minimum of 30 minutes, 4-6 days per week.
Patient two: therapeutic program
The patient began on the following parts of the overall therapeutic system: (1) he fasted for a minimum of three hours between dinner and bedtime, and for a minimum of 12 hours between dinner and breakfast; (2) he eliminated simple carbohydrates and processed foods from his diet; (3) he increased consumption of vegetables and fruits, and limited consumption of fish to non-farmed, and meat to occasional grass-fed beef or organic chicken; (4) he took probiotics; (5) he took coconut oil i tsp bid; (6) he exercised strenuously, swimming 3-4 times per week, cycling twice per week, and running once per week; (7) he took melatonin 0.5mg po qhs, and tried to sleep as close to 8 hours per night as his schedule would allow; (8) he took herbs Bacopa monniera 250mg, Ashwagandha 500mg, and turmeric 400mg each day; (9) he took methylcobalamin 1mg, methyltetrahydrofolate 0.8mg, and pyridoxine-5-phosphate 50mg each day; (10) he took citicoline 500mg po bid; (11) he took vitamin C 1g per day, vitamin D3 5000IU per day, vitamin E 400IU per day, CoQ10 200mg per day, Zn picolinate 50mg per day, and a-lipoic acid 100mg per day; (12) he took DHA (docosahexaenoic acid) 320mg and EPA (eicosapentaenoic acid) 180mg per day.
http://www.aging-us.com/article/NjJf3fWGKw4e99CyC/text
Futures Trading....Expiration time frames
expiration of the November futures options at 2:30pm. The November futures expire tomorrow at 5pm, but the options expire 26 1/2 hours earlier. So lots of unraveling of positions right before 2:30pm today.
I trade futures options and was among those unwinding positions right before the 2:30pm options expiration. There was a huge surge in volume and a nice rally in the minutes before it. Check the day chart.
cc
Sabine Pass LNG output
24 Oct 2016, 3.16 pm GMT
Houston, 24 October (Argus) — The Sabine Pass LNG export terminal in Louisiana is scheduled to receive about 196mn cf (5.55mn m³) of gas today, its highest daily intake in more than a month as it ramps back up after a maintenance shutdown.
Sabine Pass received zero gas on 20 September-8 October, as well no gas as 12-13 October, after intake reached about 5mn cf each day on 9-11 October.
Flows ramped up to an average of 43mn cf/d on 20-23 October.
Today's gas flow would be the highest since 344mn cf on 18 September. Sabine Pass received an average of 1.2 Bcf/d of gas on 1-15 September before flows were reduced beginning 16 September.
Sabine Pass can get gas from two pipelines. Creole Trail was scheduled to flow about 96mn cf into the facility today, and National Gas Pipeline (NGPL) about 100mn cf/d. Since 18 September, flow from NGPL mostly had been zero, except, for about 5mn cf each day on 9-11 October.
Sabine Pass owner Cheniere Energy previously said it would shut the first two liquefaction trains at the facility for about four weeks to repair a flare that had not functioned as intended. It is unclear exactly when the shutdown started, as flows were reduced to negligible totals averaging 21mn cf/d on 18-19 September, before dropping to zero on 20 September.
Cheniere has declined to comment on when the trains would come back on line. The facility has exported two cargoes during the shutdown, as it had an equivalent of about 17 Bcf in storage tanks when the shutdown started.
Cheniere is building five liquefaction trains at the $20bn facility, each with peak capacity of 5mn t/yr, equivalent to about 694mn cf/d (19.6mn m³/d) of gas, and baseload capacity of 4.5mn t/yr. Train 1 exported its first cargo on 24 February and train 2 in August.
Cheniere has said that trains 3 and 4 would come on line six months after the prior respective train. Train 5 is scheduled to start operating in late 2019.
http://www.argusmedia.com/news/article/?id=1335922
cc
today's........EOD close
Cash 3.090s .... -0.050
Nov 16 2.993s ....-0.148
Dec 16 3.361s....-0.073
Jan 17 3.504s....-0.065
Feb 17 3.511s....-0.066
cc
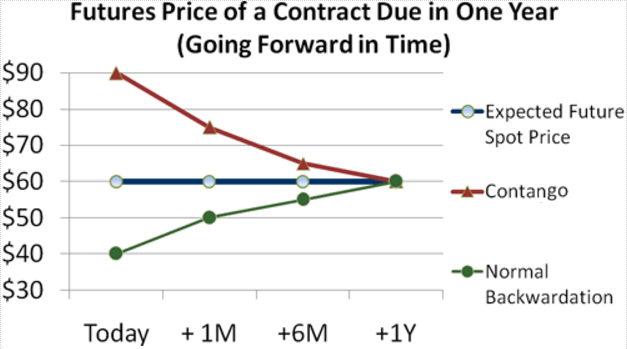
You may have something there
Suppose we entered into a December 2012 futures contract, today, for $100. Now go forward one month. The same December 2012 future contract could still be $100, but it might also have increased to $110 (this implies normal backwardation) or it might have decreased to $90 (implies contango). The definitions are as follows:
Contango is when the futures price is above the expected future spot price. Because the futures price must converge on the expected future spot price, contango implies that futures prices are falling over time as new information brings them into line with the expected future spot price......(weather could affect future spot price bringing it down because of lack of demand for future ng needs)
Normal backwardation is when the futures price is below the expected future spot price. This is desirable for speculators who are "net long" in their positions: they want the futures price to increase. So, normal backwardation is when the futures prices are increasing.
Consider a futures contract that we purchase today, due in exactly one year. Assume the expected future spot price is $60 (see the blue flat line in Figure 2 below). If today's cost for the one-year futures contract is $90 (the red line), the futures price is above the expected future spot price. This is a contango scenario. Unless the expected future spot price changes, the contract price must drop. If we go forward in time one month, note that we will be referring to an 11-month contract; in six months, it will be a six-month contract.
cc
NOAA weekly weather forecast & Climate Prediction
http://www.weatherstreet.com/states/u-s-min-temperature-forecast.htm
Climate Prediction Center
http://www.cpc.ncep.noaa.gov/products/predictions/long_range/two_class.php
cc
Weather/storage predictions
http://celsiusenergy.blogspot.com/p/extended-range-weather.html
cc
here is why you can't rely on these ng reports...they reoprt and latter revise the report to say what they want to say....storage is too high and they now revise it downward for their own benefit.....to keep prices higher
In the EIA's September STEO, its model estimated July's production at 78.89 bcf/d but in the latest Natural Gas Monthly, based on survey data, it states that production averaged 76.53 bcf/d. In addition, last Friday the EIA downwardly revised all of their production numbers for the first 6 months of 2016. In total, the revisions resulted in a net decrease of 104.75 bcf/d of production that they claimed took place but are now saying never occurred
thank you UGAZ DGAZ
Mainly trading ETF's....DGAZ and UGAZ
Flipping them....what goes up comes back down....if get in wrong spot u usually can wait till comes back around n get out in good shape
How bout u n ur crew
cc
reading/ oil down some today
As previously reported, Cheniere plans to shut down the liquefaction facility in September to conduct maintenance and “address flare performance.”
http://www.lngworldnews.com/category/news-by-topic/vessels/
cc
statistics....oil/nat gaz
I tend to thing the draw down has been because of Sabine Pass in Louisiana....rising prices have to do with sales to Africa...Chile and not winter draw down
dated July of 2016
Cheniere took over control of the first liquefaction train at the Sabine Pass facility in May from Bechtel. First commercial delivery is expected to occur in November when the 20-year LNG sales and purchase agreement with Shell commences
according to news reports the company was planning to shut down the Train 1 in September for maintenance.
The plant’s second liquefaction train is currently undergoing commissioning and is expected to reach substantial completion in September with first cargo expected to be shipped in mid-August.
U.S. LNG export player Cheniere will shut down its Sabine Pass liquefied natural gas export facility in Lousiana during September for scheduled maintenance.
“Train 1 has planned maintenance scheduled for September. The exact dates are being finalized,” a Cheniere spokesperson confirmed to LNG World News on Tuesday.
if Train 1 is shut down then possability of draw downs are less likely untill train 2 goes back on line in Aug....if train 2 is on time and no delays...construction is never as scheduled on time.....do we have more build up tru Aug... ???????
as of Sept. 8 of 2016
although the US LNG avoids Europe sales, flows to higher premium markets
Europe has received just 8% of delivered volumes of US LNG since Cheniere’s Sabine Pass export terminal in Louisiana came online in February,
The majority of cargoes have instead found a home in South America,
As of 6 September, around 3.4 million cubic metres (mcm) of LNG had been delivered from Sabine Pass via 26 cargoes. A little more than 57% of total exports have been delivered to South America, with Chile the single biggest recipient having absorbed 28% of the total volume.
there have been seven cargoes delivered from the US to Quintero. GNL Chile – the buying consortium that comprises state-run refiner ENAP, gas distributor Metrogas and Spanish generator Endesa – receives cargoes through a long-term contract initially concluded with UK-based BG Group, which was acquired by Shell.
Forward prices suggest the trend of low flows to Europe may persist into the upcoming winter period as well.
I believe South America and Chili sales have driven prices up from their bottoms.....because of sales to foreign countries storage is being depleted... and NOT storage because of winter as dude has suggested.....he has not a clue as to these events
question is if Sept. maintenance on train 1 has been implimented and I believe it has.....does storage go back up untill Aug... when train 2 goes on line....will train 2 come on line as scheduled or are there delays
do we have a month of lul in storage draw down
we shall see soon...possibly shows in this weeks report
Does Nov come into play or do delays cause us to wait till Jan or Feb of 2017 for storage depletion
cc
LNG EXPORTING
Interactive: US LNG avoids Europe, flows to higher premium markets
08 September 2016 05:32 Source:ICIS
Europe has received just 8% of delivered volumes of US LNG since Cheniere’s Sabine Pass export terminal in Louisiana came online in February, according to ICIS shipping platform LNG Edge.
The majority of cargoes have instead found a home in South America, where markets have offered exporters a more favourable return than that available based on recent European hub prices. Forward prices suggest the trend of low flows to Europe may persist into the upcoming winter period as well.
As of 6 September, ICIS LNG Edge data showed that around 3.4 million cubic metres (mcm) of LNG had been delivered from Sabine Pass via 26 cargoes. A little more than 57% of total exports have been delivered to South America, with Chile the single biggest recipient having absorbed 28% of the total volume.
Since Anglo Dutch Shell began lifting cargoes from Sabine Pass Train 1 earlier this year, there have been seven cargoes delivered from the US to Quintero. GNL Chile – the buying consortium that comprises state-run refiner ENAP, gas distributor Metrogas and Spanish generator Endesa – receives cargoes through a long-term contract initially concluded with UK-based BG Group, which was acquired by Shell.
http://www.icis.com/resources/news/2016/09/08/10032256/interactive-us-lng-avoids-europe-flows-to-higher-premium-markets/
BY ICIS
http://www.icis.com/energy/liquefied-natural-gas/lng-resources/
cc
DUC count reporting by EIA
http://www.eia.gov/petroleum/drilling/#tabs-summary-3
cc
|
Followers
|
1
|
Posters
|
|
|
Posts (Today)
|
0
|
Posts (Total)
|
137
|
|
Created
|
08/20/15
|
Type
|
Free
|
| Moderators | |||
| Volume | |
| Day Range: | |
| Bid Price | |
| Ask Price | |
| Last Trade Time: |