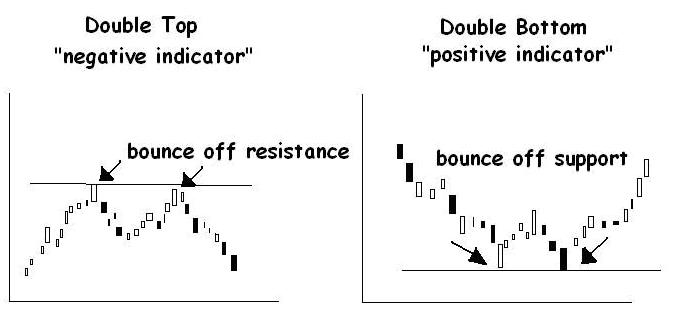
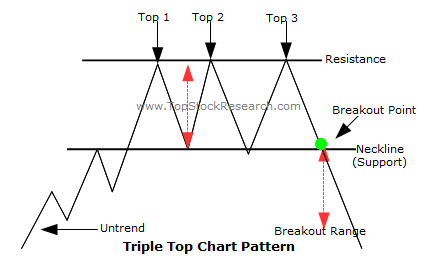
The double top and double bottom are another pair of well-known chart patterns whose names don’t leave much to the imagination. These two reversal patterns illustrate a security's attempt to continue an existing trend. Upon several attempts to move higher, the trend is reversed and a new trend begins. These chart patterns formed will often resemble what looks like a $W (for a double bottom) or an $M (double top).
$Double Bottom Reversal
A double bottom occurs when prices form two distinct lows on a chart. A double bottom is only complete, however, when prices rise above the high end of the point that formed the second low. The double bottom is a reversal pattern of a downward trend in a stock's price. The double bottom marks a downtrend in the process of becoming an uptrend. Double bottoms are often seen and are considered to be among the most common of the patterns. Because they seem to be so easy to identify, the double bottom should be approached with caution by the investor.
$Prior Trend: With any reversal pattern, there must be an existing trend to reverse. In the case of the Double Bottom Reversal, a significant downtrend of several months should be in place. $First Trough: The first trough should mark the lowest point of the current trend. As such, the first trough is fairly normal in appearance and the downtrend remains firmly in place. $Peak: After the first trough, an advance takes place that typically ranges from 10 to 20%. Volume on the advance from the first trough is usually inconsequential, but an increase could signal early accumulation. The high of the peak is sometimes rounded or drawn out a bit from the hesitation to go back down. This hesitation indicates that demand is increasing, but still not strong enough for a breakout. $Second Trough: The decline off the reaction high usually occurs with low volume and meets support from the previous low. Support from the previous low should be expected. Even after establishing support, only the possibility of a Double Bottom Reversal exists, it still needs to be confirmed. The time period between troughs can vary from a few weeks to many months, with the norm being 1-3 months. While exact troughs are preferable, there is some room to maneuver and usually a trough within 3% of the previous is considered valid. $Advance from Trough: Volume is more important for the Double Bottom Reversal than the double top. There should clear evidence that volume and buying pressure are accelerating during the advance off of the second trough. An accelerated ascent, perhaps marked with a gap or two, also indicates a potential change in sentiment. $Resistance Break: Even after trading up to resistance, the double top and trend reversal are still not complete. Breaking resistance from the highest point between the troughs completes the Double Bottom Reversal. This too should occur with an increase in volume and/or an accelerated ascent. $Resistance Turned Support: Broken resistance becomes potential support and there is sometimes a test of this newfound support level with the first correction. Such a test can offer a second chance to close a short position or initiate a long. $Price Target: The distance from the resistance breakout to trough lows can be added on top of the resistance break to estimate a target. This would imply that the bigger the formation is, the larger the potential advance.
It is important to remember that the Double Bottom Reversal is an intermediate to long-term reversal pattern that will not form in a few days. Even though formation in a few weeks is possible, it is preferable to have at least 4 weeks between lows. Bottoms usually take longer than tops to form and patience can often be a virtue. Give the pattern time to develop and look for the proper clues
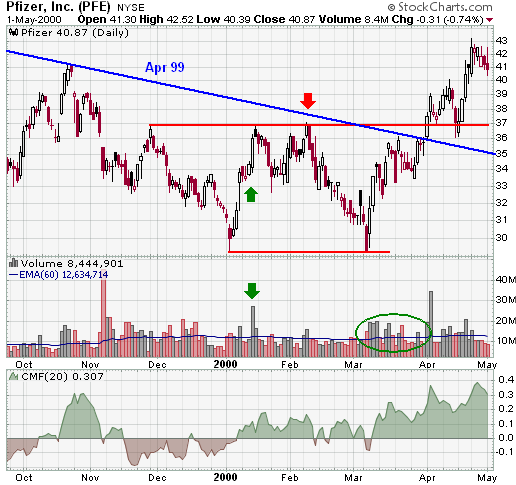
Examples
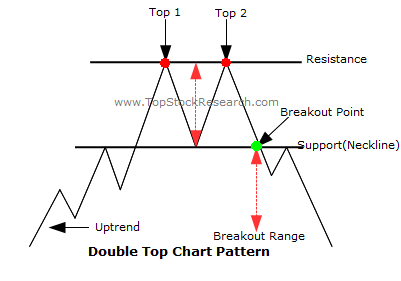
$DOUBLE TOP REVERSAL
The Double Top Reversal is a bearish reversal pattern typically found on bar charts, line charts and candlestick charts. As its name implies, the pattern is made up of two consecutive peaks that are roughly equal, with a moderate trough in-between. Note that a Double Top Reversal on a bar or line chart is completely different from Double Top Breakout on a P&F chart.Sometimes called an "M" formation because of the pattern it creates on the chart, the double top is one of the most frequently seen and common of the patterns.
$Prior Trend: With any reversal pattern, there must be an existing trend to reverse. In the case of the Double Top Reversal, a significant uptrend of several months should be in place. $First Peak: The first peak should mark the highest point of the current trend. As such, the first peak is fairly normal and the uptrend is not in jeopardy (or in question) at this time. $Trough: After the first peak, a decline takes place that typically ranges from 10 to 20%. Volume on the decline from the first peak is usually inconsequential. The lows are sometimes rounded or drawn out a bit, which can be a sign of tepid demand. $Second Peak: The advance off the lows usually occurs with low volume and meets resistance from the previous high. Resistance from the previous high should be expected. Even after meeting resistance, only the possibility of a Double Top Reversal exists. The pattern still needs to be confirmed. The time period between peaks can vary from a few weeks to many months, with the norm being 1-3 months. While exact peaks are preferable, there is some leeway. Usually a peak within 3% of the previous high is adequate. $Decline from Peak: The subsequent decline from the second peak should witness an expansion in volume and/or an accelerated descent, perhaps marked with a gap or two. Such a decline shows that the forces of demand are weaker than supply and a support test is imminent. $Support Break: Even after trading down to support, the Double Top Reversal and trend reversal are still not complete. Breaking support from the lowest point between the peaks completes the Double Top Reversal. This too should occur with an increase in volume and/or an accelerated descent. Support Turned Resistance: Broken support becomes potential resistance and there is sometimes a test of this newfound resistance level with a reaction rally. Such a test can offer a second chance to exit a position or initiate a short. $Price Target: The distance from support break to peak can be subtracted from the support break for a price target. This would infer that the bigger the formation is, the larger the potential decline. $volume : in a double top is usually higher on the left top than the right. Volume tends to be downward as the pattern forms. Volume does, however, pick up as the pattern hits its peaks. Volume increases again when the pattern completes, breaking through the confirmation point. $Pullback: after the breakout is usual for a double top.The higher the likelihood of a pullback. "When everyone sells their shares soon after a breakout, what is left is an unbalance of buying demand (since the sellers have all sold), so the price rises and pulls back to the confirmation point. $Time between Tops:Analysts pay close attention to the "size" of the pattern - the duration of the interval between the two tops. Generally, the longer the time between the two tops, the more important the pattern as a good reversal. Schabacker warns investors off of a pattern where only a few days intervene between the two peaks.Analysts suggest that investors should look for patterns where at least one month elapses between the peaks.
 Market Data
  Markets