Thanks Legend for your hard work and dedication to the board, making us all better traders!!! I need too catch up on my lesson review, unfortunately I'm swamped with work...
It's great how you linked the lessons together, It sure makes it easier to review...
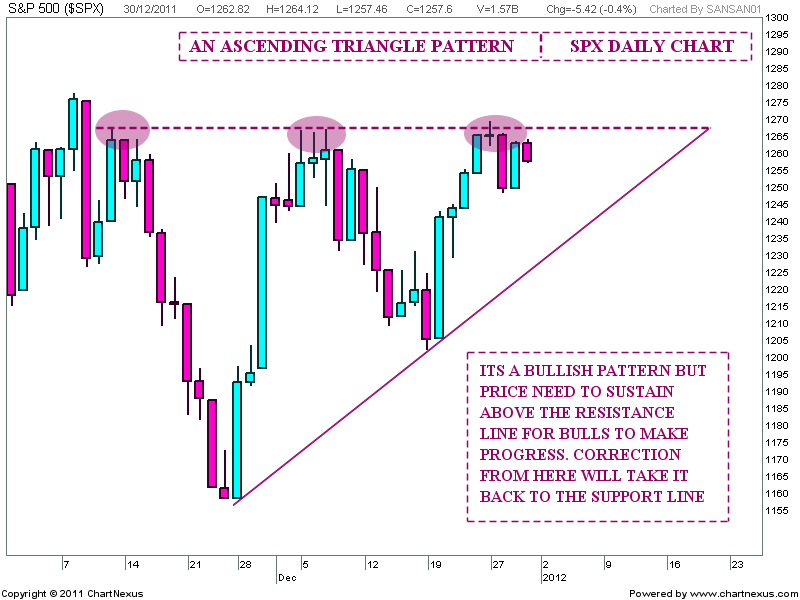
IAM, Thanks for the lessons. They are really helping. I also appreciate the educational charts you post. They help tie it together. Your hard work is a huge asset. stonsetr
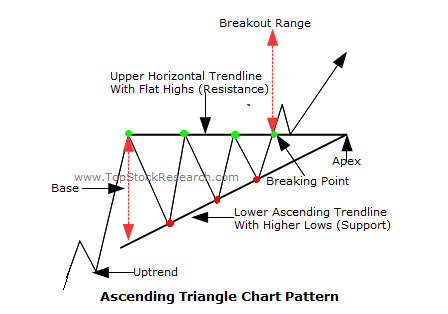
The Ascending Triangle is a bullish formation that usually forms during an uptrend as a continuation pattern. There are instances when ascending triangles form as reversal patterns at the end of a downtrend, but they are typically continuation patterns. Regardless of where they form, ascending triangles are bullish patterns that indicate accumulation. 1.Trend: In order to qualify as a continuation pattern, an established trend should exist. However, because the ascending triangle is a bullish pattern, the length and duration of the current trend is not as important as the robustness of the formation, which is paramount. 2.Top :Horizontal Line: At least 2 reaction highs are required to form the top horizontal line. The highs do not have to be exact, but they should be within reasonable proximity of each other. There should be some distance between the highs, and a reaction low between them. 3.Lower Ascending Trend Line: At least two reaction lows are required to form the lower ascending trend line. These reaction lows should be successively higher, and there should be some distance between the lows. If a more recent reaction low is equal to or less than the previous reaction low, then the ascending triangle is not valid. 4.Duration: The length of the pattern can range from a few weeks to many months with the average pattern lasting from 1-3 months. 5.Volume: As the pattern develops, volume usually contracts. When the upside breakout occurs, there should be an expansion of volume to confirm the breakout. While volume confirmation is preferred, it is not always necessary. 6.Return to Breakout: A basic tenet of technical analysis is that resistance turns into support and vice versa. When the horizontal resistance line of the ascending triangle is broken, it turns into support. Sometimes there will be a return to this support level before the move begins in earnest. 7.Target: Once the breakout has occurred, the price projection is found by measuring the widest distance of the pattern and applying it to the resistance breakout.
In contrast to the symmetrical triangle, an ascending triangle has a definitive bullish bias before the actual breakout. If you will recall, the symmetrical triangle is a neutral formation that relies on the impending breakout to dictate the direction of the next move. On the ascending triangle, the horizontal line represents overhead supply that prevents the security from moving past a certain level. It is as if a large sell order has been placed at this level and it is taking a number of weeks or months to execute, thus preventing the price from rising further. Even though the price cannot rise past this level, the reaction lows continue to rise. It is these higher lows that indicate increased buying pressure and give the ascending triangle its bullish bias.
 Market Data
  Markets