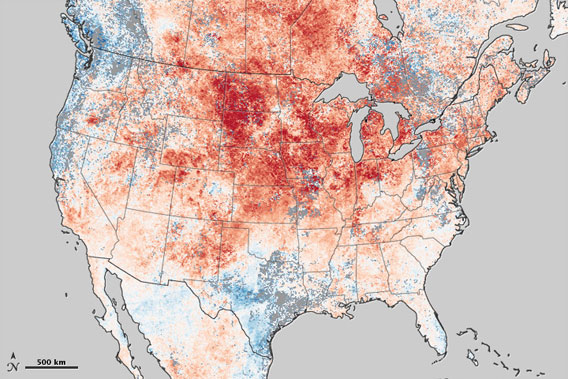
NASA map shows temperature anomalies from March 13-19, 2012 as compared to the same eight day period during the past 12 years. The map is based on data captured by the Moderate Resolution Imaging Spectroradiometer (MODIS) instrument on the Terra satellite. Click to enlarge.
 News
News  Market Data
  Discover