IAL, nice, much easier (CMF) to view and understand then your recent FIB one, though the FIB chart on AEN was a masterpiece of all you use. I am not there yet.
VOLUME is The number of shares or contracts traded in a security or an entire market during a given period of time. It is simply the amount of shares that trade hands from sellers to buyers as a measure of activity. If a buyer of a stock purchases 100 shares from a seller, then the volume for that period increases by 100 shares based on that transaction. Volume is an important indicator in technical analysis as it is used to measure the worth of a market move. If the markets have made strong price move either up or down the perceived strength of that move depends on the volume for that period. The higher the volume during that price move the more significant the move.
Liquidity
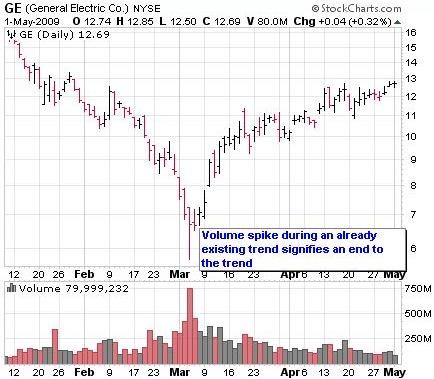
Stock chart volume also shows us the amount of liquidity in a stock. Liquidity just simply refers to how easily it is to get in and out of a stock. If a stock is trading on low volume, then there aren't many traders involved in the stock and it would be more difficult to find a trader to buy from or sell to. In this case, we would say that it is illiquid. If a stock is trading on high volume, then there are many traders involved in the stock and it would be easier to find a trader to buy from or sell to A surge in volume can often signify the end of a trend.
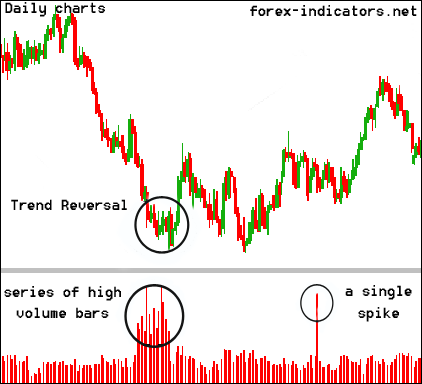
Here, on the left side of the chart, this stock begins to fall. Volume increases dramatically as more and more traders get nervous about the rapid decline of this stock. Eventually everyone piles in and the selling pressure ends. A reversal takes place.
Then, in the middle of the chart, volume begins to taper off (circled) as traders begin to lose interest in this stock. There are no more buyers to push the stock higher. A reversal takes place.
Then, on the right side of the chart, volume begins to increase again (second arrow) and another reversal takes place.
This chart is a good example of how the trend of a stock can reverse on high volume or low volume.
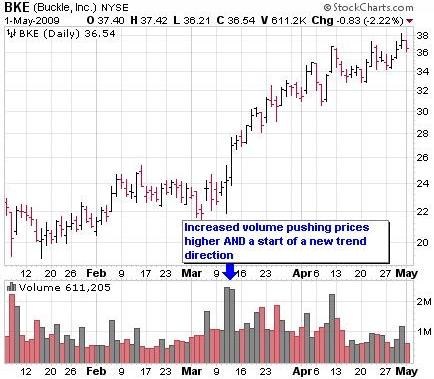
Expansion of range and high volume - If a stock is drifting along sideways in a narrow range and all of sudden it breaks to the upside with an increase in range and volume, then we can conclude that there is increased interest in the stock and it will probably continue higher.
Narrow range and high volume - If a stock has very high volume for today but the range is narrow then this is called churning. In this case, significant accumulation or distribution is taking place.
Ever heard the saying, "volume precedes price"?
Many times you will see volume pick up right before a significant move in a stock. You can see that interest is building. On a stock chart, look for volume to be higher than the previous day. This is a sign that there may be a significant move to come.
Example...
VIDEO-VOLUME
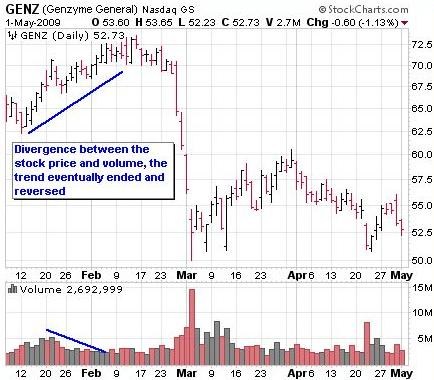
Stock Volume and Price Divergence (disagreement) When you have decreased volume pushing prices higher (or lower) the message here is "usually" that there is little support for the current price movement, and the trend has a low likelihood of continuing.
 News
News  Market Data
  Discover