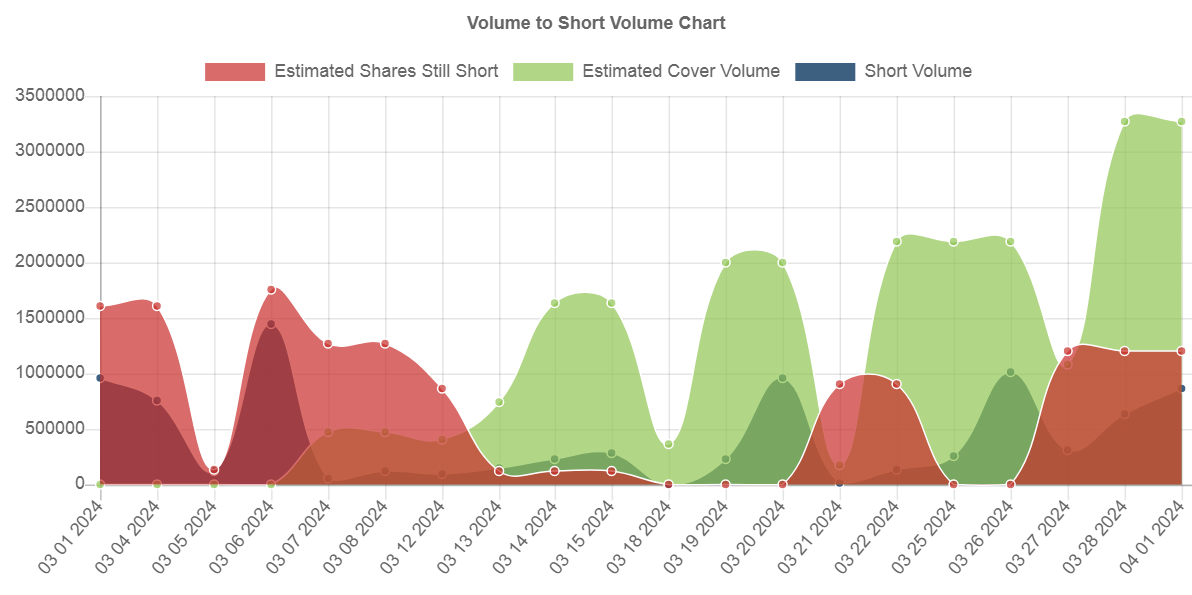
Look at March 26, the short volume is almost equal to the total volume for the day, now look at the chart for that day and you see the biggest green candle in the past month Doesn’t really make sense?
GDVM short chart~~~ To give us measure for for any explosives in the storage magazine .... like in 7 days to bleed off cover volume tells us how long a breakout run may last on our low daily trading volume.
 News
News  Market Data
  Discover