At 7-year high, gold eyes $1900 on stimulus-driven liquidity
Analysts forecast the yellow metal to hit $1900 an ounce in weeks. By Issac John, Khaleej Times
Gold futures rallied for the fifth consecutive day, surging above $1,700 an ounce to the highest since 2012, underpinned by ample liquidity in the wake of massive economic stimulus packages initiated worldwide to contain coronavirus epidemic as precious metals analysts forecast the yellow metal to hit $1900 an ounce in weeks.
On Tuesday, as investors weighed the economic fallout from the pandemic and the prospect of more stimuli, gold widened the spread over spot prices. Futures rallied as much as 2.9 per cent to $1,742.60 an ounce on the Comex, rising to a seven-year high and traded at $1,714.70 at 6:22am in London.
Spot gold was 0.1 per cent lower at $1,659.53 an ounce, putting the spread between London and New York prices at more than $50. Earlier, the difference topped $60.
That widening gap between gold futures and spot prices echoes a pattern seen last month, when there were concerns about a shortage of physical bullion for delivery against contracts in New York because of virus-driven disruptions.
Gary Wagner, analyst at Kitco, said a possible explanation for this spread that is widening is the expectation that the coronavirus in the United States will get worse before it gets better."On a technical basis gold has formed an inverse head and shoulders formation with Tuesday's move in gold futures breaking strongly above the shoulders indicating higher pricing ahead. The rally in gold futures could move as high as $1800 in the next two weeks."
Analysts at Citibank forecast the yellow metal at $1700 an ounce in a 1-3 month horizon and at $1900 in six to 12 months.
In India, gold traded at Rs 45,724 per 10 gm on MCX even as silver too was on strong wicket. On Multi-Commodity Exchange (MCX), gold prices for June was trading Rs 1515 (3.47 per cent) higher at Rs 45,237 per 10 gm in the morning compared with earlier session.
Angel Broking Deputy Vice President Anuj Gupta said that the high gold price was expected to continue on a high due to investors interest in precious metals in view of economic uncertainties.
Kedia Advisory Director Ajay Kedia said the high price was due to the fact that gold was seen as a safe investment.
Market experts said gold prices could touch 2,000 dollars. In Indian market, it could go up to Rs 50,000 per gm in the futures market.
Riding positive indicators from markets abroad, gold traded on a new record high on the futures trade market in India.
The precious metal is in demand, with JPMorgan Chase & Co.'s Jamie Dimon saying the pandemic will lead to a severe downturn. Its jump came even as risk assets including equities posted gains on signs the outbreak is leveling off.
"The recessionary fallout of the Covid-19 outbreak on the global economy suggests investors are likely to continue to seek refuge in gold," said BNP Paribas commodities economist Harry Tchilinguirian and head of macro quantitative and derivatives strategy Michael Sneyd.
Also, the massive quantitative easing by global central banks and the unprecedented fiscal stimulus boost the incentive to hold gold, analysts said.
"With the Federal Reserve moving its policy rate to the lower bound and turning to unlimited quantitative easing, and other banks taking similar action, we expect real rates to remain in negative territory as nominal yields are suppressed. This raises the incentive to hold gold, particularly in such an uncertain economic environment," they said.
Two significant elements capping gold's gains going forward will be the dollar and more margin-call selling as people flock to cash during the coronavirus panic.
"Diverging activity in physical gold is disrupting the spot market," Michael McCarthy, chief market strategist at CMC Markets Asia Pacific, said. "Huge US demand for physical contrasts with European selling. This is particularly impacting futures contracts that are deliverable, and is the cause of recent widening of bid/offer spreads in spot gold."
Based on the pattern, it is clear that the bulls are in control of the long-term momentum and that most strategic traders would be looking for buying opportunities on pullbacks toward either of the dotted trendlines. The upward divergence between the long-term moving averages that has started to expand over the past several months will likely be used by traders as confirmation of a long-term moving higher. The power of the moving average and proximity of major support levels suggest that traders will place buy-stop orders above the swing high of $159.37 in anticipation of a break higher.
A Crisis In Confidence - Craig Hemke (April 7, 2020) By Craig Hemke
Just like two weeks ago, premiums are expanding again between the spot price for gold and the front month futures price. It was generally accepted two weeks ago that this was a signal of physical tightness that was soon to be resolved because the gold was simply "in the wrong place". By this logic, it must still be.
Let's start with the basics so that we're all on the same page.
There is the spot price. This is recognized at the XAU/USD, and you'll see this price quoted at most bullion dealer websites.
There is also the front month futures price. Since I've always been a trader-and since the "futures tail wags the spot dog"-this is the price we quote and chart daily at TFMR.
Typically, and almost always in the past, these two are within a couple dollars of each other. As you can see above, as of this writing they are not, with a $38 spread between the two. And that's down from nearly $70 Monday evening when the Jun 20 hit a high of $1742.
Arbitrage SHOULD close this gap and SHOULD have kept it from opening in the first place. What is that? Theoretically, a party SHOULD be able to buy 100 ounces at spot and at the same time sell a futures contract. At settlement, this trade would eventually pocket that $38 spread for a cool $3800 profit. That SHOULD be an easy, riskless trade, and the result SHOULD be a narrowing of the spread back to near zero.
However, the spread persists. Oh sure, it collapsed early last week from $70 on March 24 back to zero on March 31-likely due to that arbitrage as the Apr20 moved into delivery. But now here we are again with the same spread blowing out to $70 once more. No doubt SOME arbitrage is what has since pulled it back to under $40, but THE PRIMARY QUESTION is WHY does this condition persist?
Two weeks ago, we were told by the System Apologists and Shills that the spread was a one-time deal caused by "gold being in the wrong place". OK...but that should be fixed by now, shouldn't it? The CME went to great lengths to amend the delivery procedures of COMEX contracts to include fractional ownership of London bars. That supposedly solved the problem. Oops. I guess not.
To me, this recurring spread between spot and Jun 20 is a sign of ONGOING tightness and, more importantly, LOSS OF CONFIDENCE in the fractional reserve pricing system. Why? Because the ONLY reason someone wouldn't immediately execute the arbitrage trade described above is out of fear that you won't have the 100 ounces in hand when the time comes to deliver it in June. Again, that's the ONLY reason. Otherwise, it's a riskless and easy trade...so easy that the spread prior to last month was almost always just a few dollars.
And now here's something interesting to chew on: There's a spot price for silver, too. You can find it under the symbol XAG/USD:
Yes, that's spot silver at $15.22 per ounce. But check the front month May 20...
That's a spread of 37¢ or about 2.5%. Same as gold! So is the problem that "the silver is just in the wrong place", too? Or again, is this is a CRISIS OF CONFIDENCE? The May 20 goes into "delivery" in three weeks, so this should be another remarkably simple trade. Buy 5000 ounces at $15.22 and sell a COMEX contract at $15.58. Deliver your silver in early May and pocket $1800. Do this 100 times and pocket $180,000! So why aren't enough parties willing to do this and close the spread? Because OBVIOUSLY there's not sufficient confidence that the silver bought at spot today will be handed over in time to deliver in New York in three weeks hence.
But now here's the problem for all of us...
This situation has placed prices into a sort of No Man's Land. The paper price moves up, but spot doesn't follow 1:1. Eventually (at about $70 in gold, I guess), the profit potential becomes wide enough to outweigh the risk, the arbitrage trade begins, and the futures contract comes crashing back down. If spot had followed Monday evening, the Jun 20 might have continued to rally. Instead, and just like two weeks ago, we got this:
cont.................
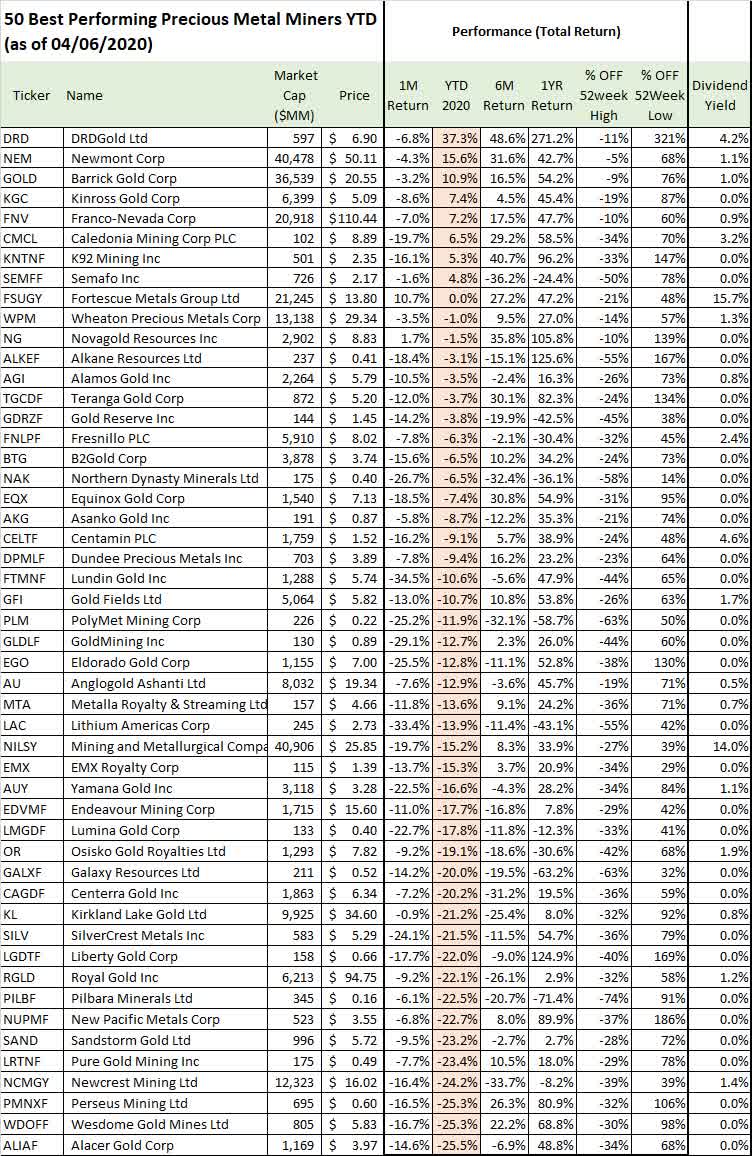
The Best-Performing Gold And Precious Metal Stocks - April 2020
It's been a difficult year for gold mining stocks. Even as gold is up 9% year to date and now trading near an eight-year high, miners have significantly underperformed with the benchmark VanEck Vectors Gold Miners ETF (GDX) down 11% year to date or 19% from its recent high reached in February. Since the emergence of the COVID-19 pandemic and the acceleration of the global outbreak in March, miners have been caught up in a financial contagion-type trade, selling off with the broader equity market in a risk-off environment. While this episode highlights an important attraction of trading the commodity price of gold which may have benefited more from its safe-haven attributes in a market stress scenario, we still think miners can outperform to the upside going forward.
This article looks at the bullish case for gold through a list of the 50 best-performing mining stocks in 2020. While most stocks in the group are gold producers, the list also includes miners focused on other precious metals like silver, platinum, and palladium. We use a market cap of $100 million as a filter in the result. We highlight some key observations below and our view on where the group is headed next.
Best-Performing Precious Metals Miners
The table above is sorted by the performance of the miners based on their year to date return through April 6th, 2020. We also include the corresponding trailing 1-month, 6-month, and 1-year performance along with the return from their respective 52-week high and low.
As mentioned, it has been a difficult 2020 for the miners with only eight stocks posting a positive return this year thus far. From the 50 in the group above, the average stock is down by 33% from their 52-week high but at the same time up 90% from their respective 52-week low corresponding to the volatile environment.
The big theme here is that large-cap miners have generally outperformed in this environment. Newmont Corp. (NEM), Barrick Gold Corp. (GOLD), and Franco-Nevada Corp. (FNV) are each up 15.6%, 10.9% and 7.2% year to date respectively. It's likely the market is adding a quality premium to these players given their larger scale and stronger balance sheets. Each of these stocks also pays a small dividend which yields about 1%.
Analysis And Forward-Looking Commentary
To the downside, we're watching the March lows in gold around $1,450 and silver at $12.00 per ounce as important support levels. Given the recent momentum higher, we think it's unlikely those prices will be retested but nevertheless a break lower would force a reassessment of our thesis. To the upside, $2,000 per ounce in gold is our near-term price target. In this scenario, we expect the mining stocks to recover any recent losses and potentially reclaim their highs from 2019.
 News
News  Market Data
  Discover


:max_bytes(150000):strip_icc():format(webp)/gld_040620-0098a74585594948924d99329e56b7d2.jpg)