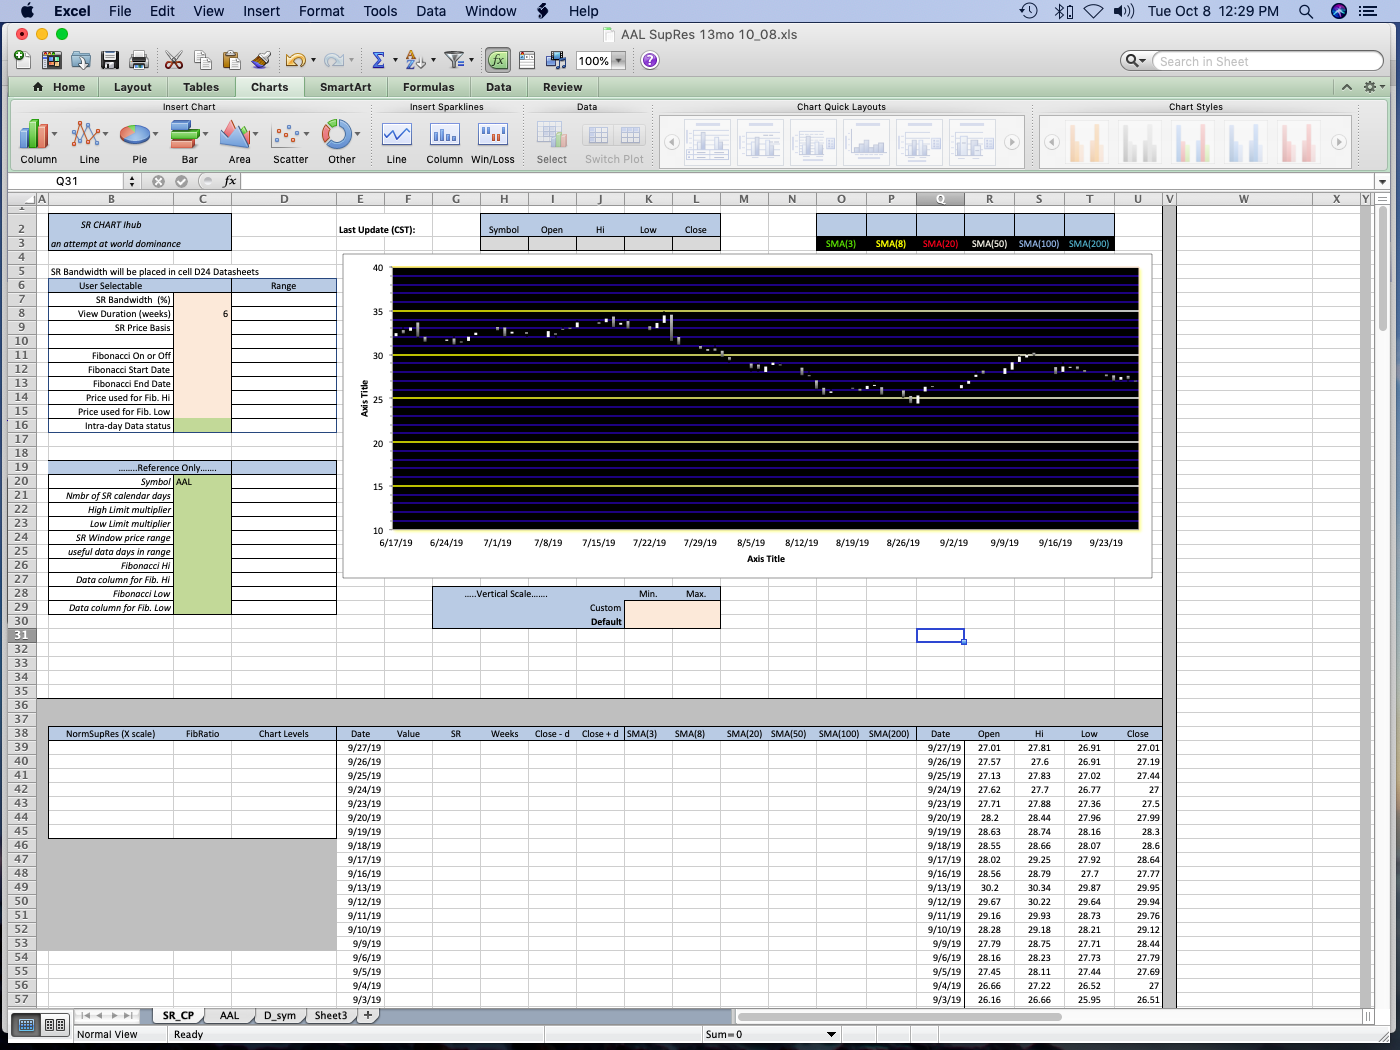
The data on my SR_CP chart (columns r-U) has no dates. So I made a chart pulling directly from the data sheet. I had asked in an earlier post how to populate dates, but didn't get a response. Unfortunately I've gotten so many posts, although all appreciated, the info i need is getting lost. I'm spending a lot of time going back and trying to find the posts i need.
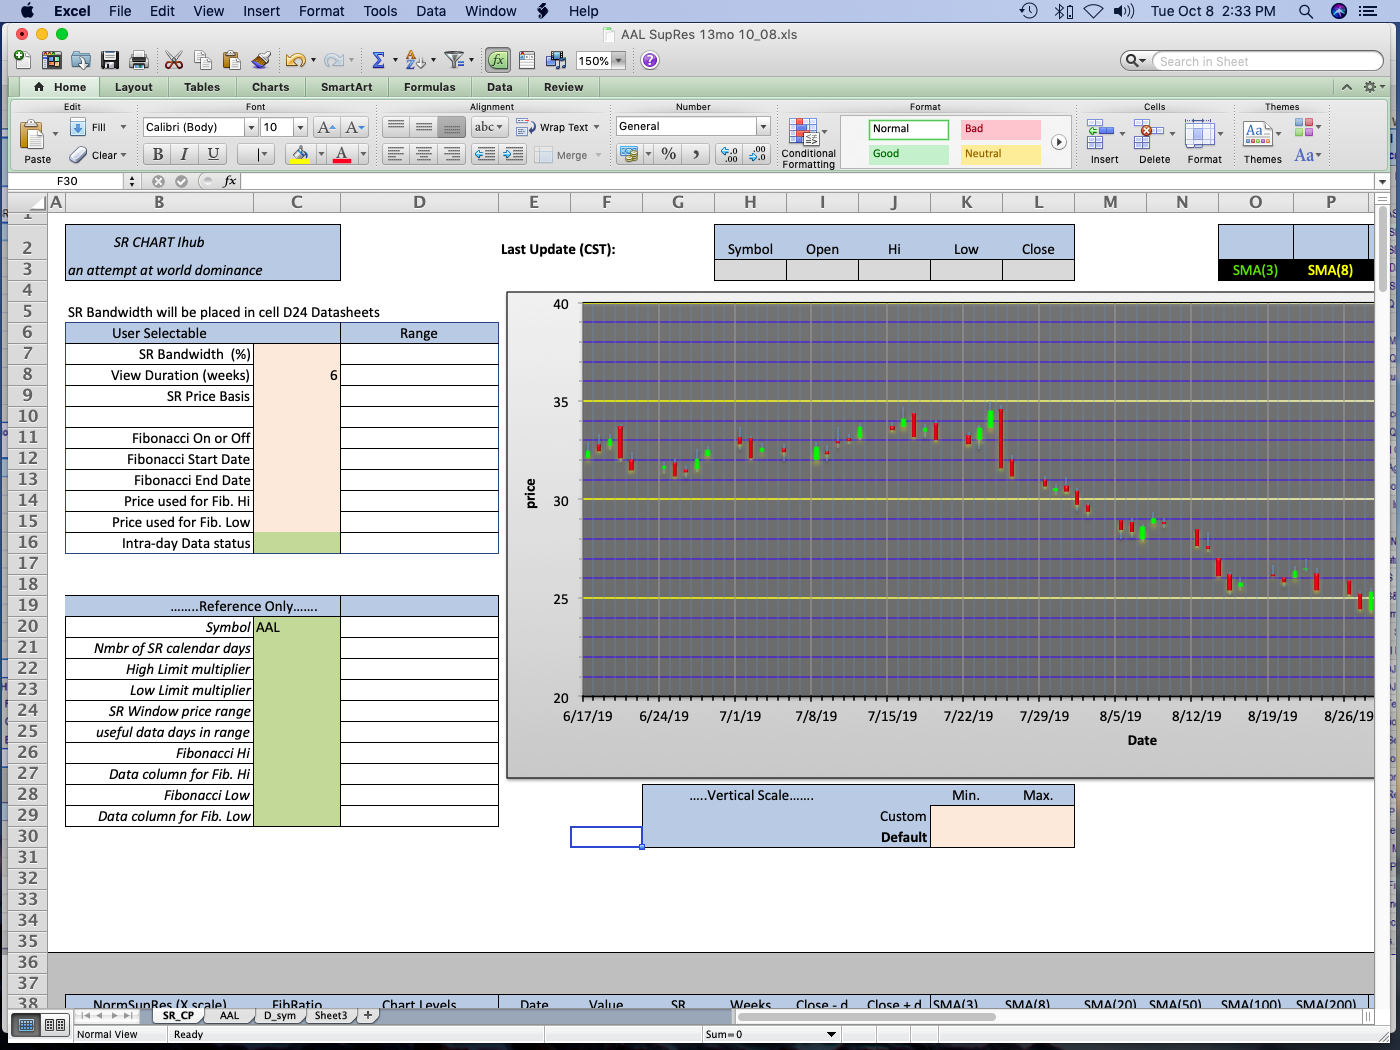
I think it's best if I can start back a ways and walk forward through some of the missing formulas, etc,. I can easily remake a chart in a different style, and will experiment with candlestick shadows, etc. when I do.
You had posted earlier to reduce my data timeline. I have done that by just tweeting the axis', but i understand a drop down menu and formula will and should be necessary to do that automatically and toggle between dates. Can't get to that until chart is drawing data correctly though.
I had asked about the formula containing N/A and if that was the one that pulled dates onto sr_cp? I think that's a roadblock right now (date data). In the meantime I'm just using a simpler formula, the one I most commonly use to populate data between sheets: =sum(AAL!A29), sequentially.
 News
News  Market Data
  Discover