I like the 9 day chart for stepping back a bit..
A weekly chart can be subject to paint and the longer time period simplifies the chart.
The $5-$7 range has strong VBP resistance but institutional interest has gone from 70 to 85% from end of 2017 to end of 2018 (current numbers unknown). This could be a flushing out of weak hands, retail included.
The Big Boys are the largest investors:
 File Date	Form	Investor		Opt	Prev
 Shares	Current
 Shares	Change
 (Percent)	Prev Value
 ($1000)	Current Value
 ($1000)	Change
 (Percent)
 2019-02-04	13G/A	BlackRock Inc.			8,493,975	12,378,204	45.73
 2019-02-14	13G/A	Redmile Group, LLC			10,906,962	10,884,607	-0.20
 2019-02-12	13G/A	VANGUARD GROUP INC			9,655,527	10,492,223	8.67
 2019-02-14	13G/A	Clearbridge Investments, LLC			11,071,365	8,406,481	-24.07
 2019-02-14	13G	STATE STREET CORP			8,345,380	8,100,371	-2.94
 2019-01-11	13G	MORGAN STANLEY				8,026,699
 2019-02-13	13F	FMR LLC / Fidelity			7,497,597	6,427,984	-14.27	71,002	30,855	-56.54
 2019-02-12	13F	Renaissance Technologies LLC			6,312,640	6,182,140	-2.07	59,781	29,674	-50.36
 2019-02-15	13F/A	MILLENNIUM MANAGEMENT LLC			837,142	4,389,260	424.31	7,928	21,068	165.74
 2019-02-12	13F	PRIMECAP MANAGEMENT CO/CA/			3,788,800	3,765,000	-0.63	35,880	18,072	-49.63
 2019-02-14	13F	Arrowpoint Asset Management, LLC			1,927,950	3,606,724	87.08	18,258	17,312	-5.18
https://fintel.io/so/us/imgn

https://fintel.io/so/us/imgn
Note the relative tightness of the EMA ribbons compared to 2016-2017 lows.
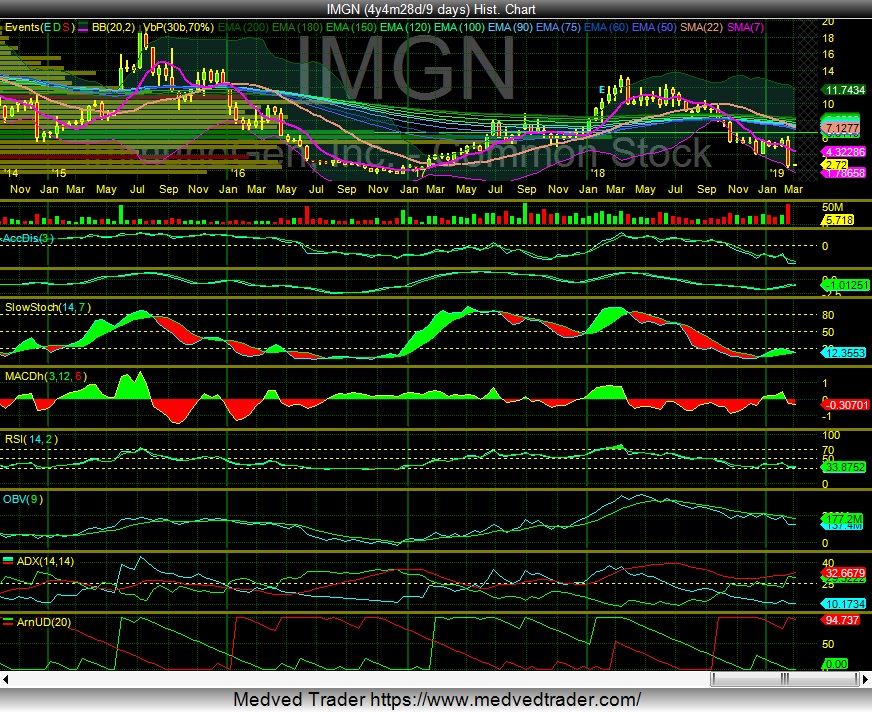
I'm expecting a quick rebound with possible stagnation in the $5-$7 range. This is where fundamentals take over.
 News
News  Market Data
  Discover


