DP Alert: Bull Flag Executes on USO! New Upside Target By: Erin Swenlin | January 24, 2018
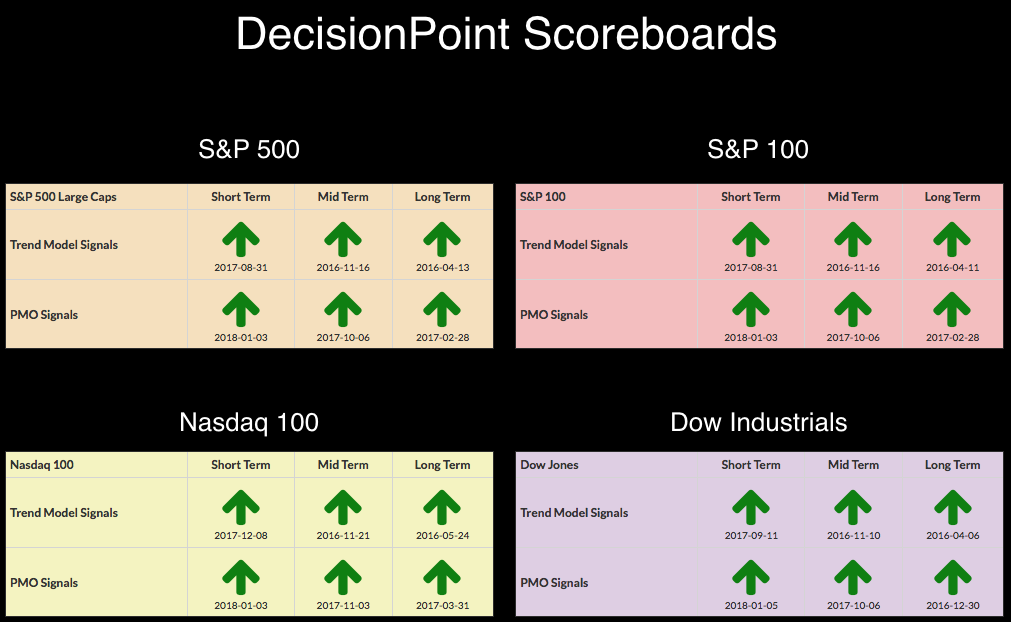
The DecisionPoint Scoreboards remain green as momentum is positive and price trends continue higher in this seemingly unending bull market rally. I'm seeing a few cracks in the pavement right now in the short-term indicators with a negative divergence between breadth and volume. USO began executing a bull flag yesterday and today it took off. I'll give you my thoughts on a potential upside target in the section on Oil below.
STOCKS
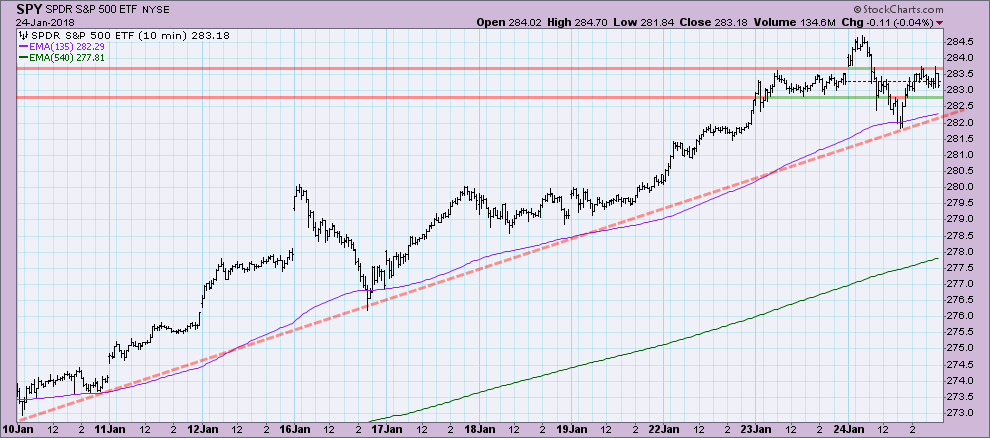
IT Trend Model: BUY as of 11/15/2016 LT Trend Model: BUY as of 4/1/2016 A look at the 10 minute bar chart shows that a rising bottoms trend line has remained intact over the last two weeks of trading. I've highlighted an inside trading range that will likely provide support as this rising trend continues. If we see a bit of a pullback, I suspect the rising bottoms trendline will hold.
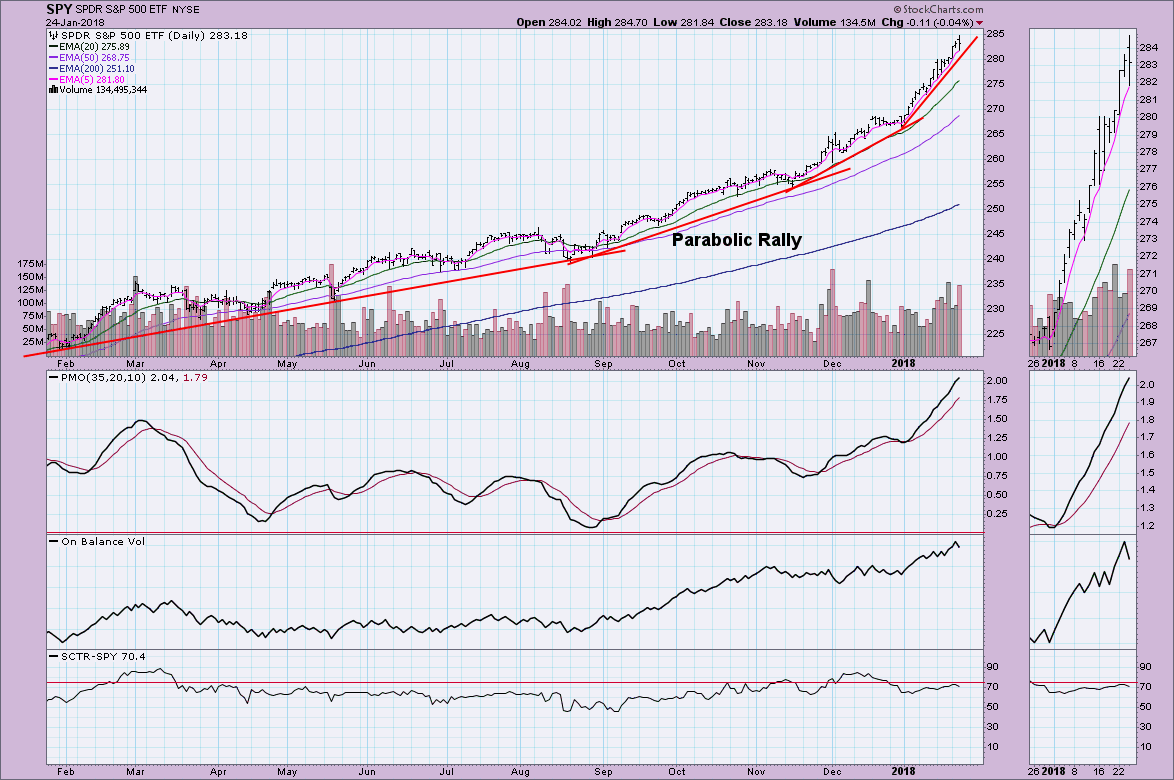
The parabolic rally continues, although we are seeing the current the rising bottoms trendline through January hasn't increased its angle of ascent. Normally I would say that maintaining this angle of ascent would be difficult, but its held up for almost a month now. The PMO is now officially "overbought" as the normal range is between +2 and -2. It has the ability to stretch in unusual market conditions and I would say this is one of those times.
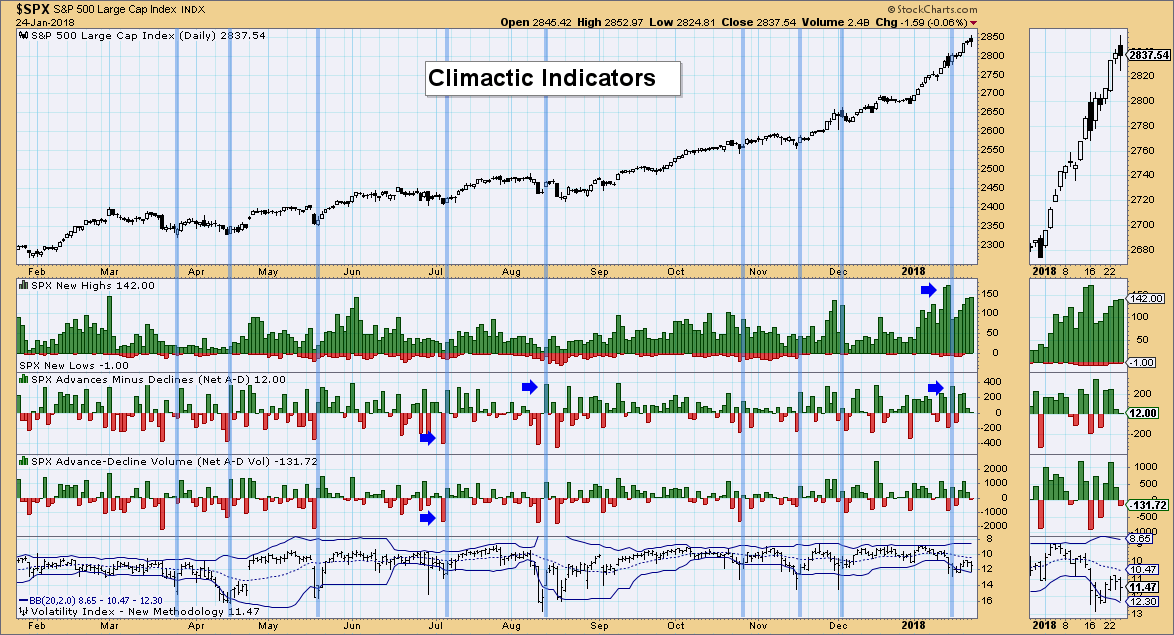
Climactic Indicators:
I noted at the end of the MarketWatchers LIVE broadcast that the VIX was reaching a high that would push it outside the Bollinger Band. The VIX stayed within the band and there are no accompanying spikes in breadth, so I would read this as somewhat bullish for the rest of the week.
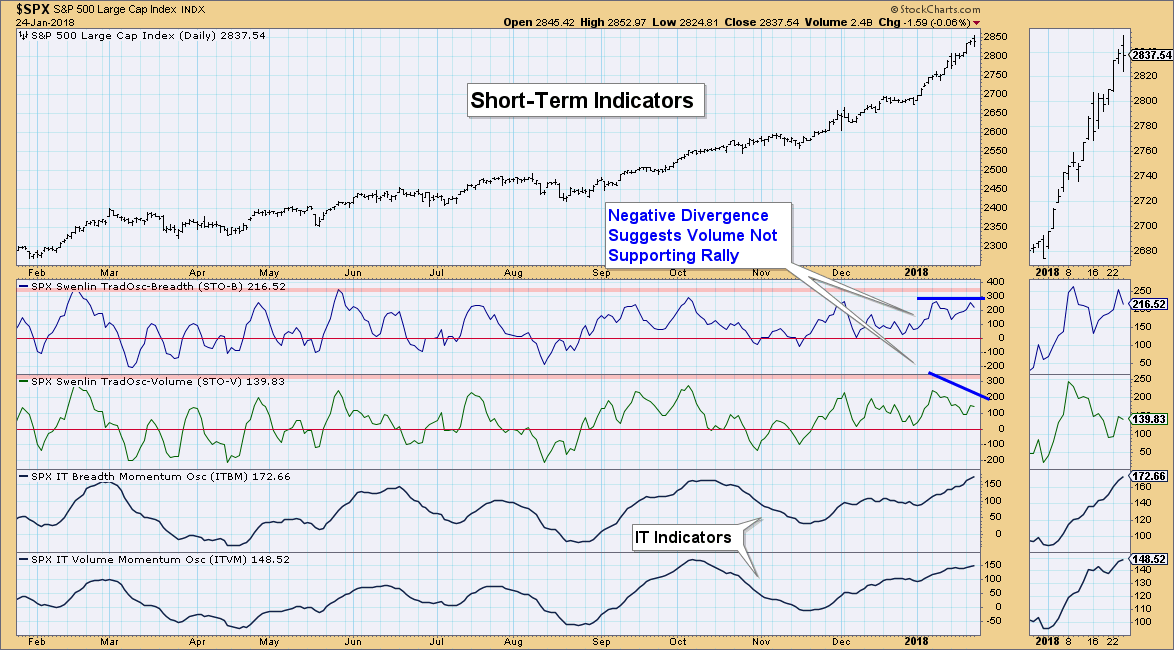
Short-Term Indicators:
I wrote about the near-term divergence I saw over the last week, but that has righted itself. However, with both of these indicators turning down today we have a negative divergence between the tops. The STO-B's latest top is about equal to its previous, but the STO-V is nowhere near its previous top. This tells us that volume may not be behind this current rally. Additionally, seeing them both turn down is bearish for the short term.
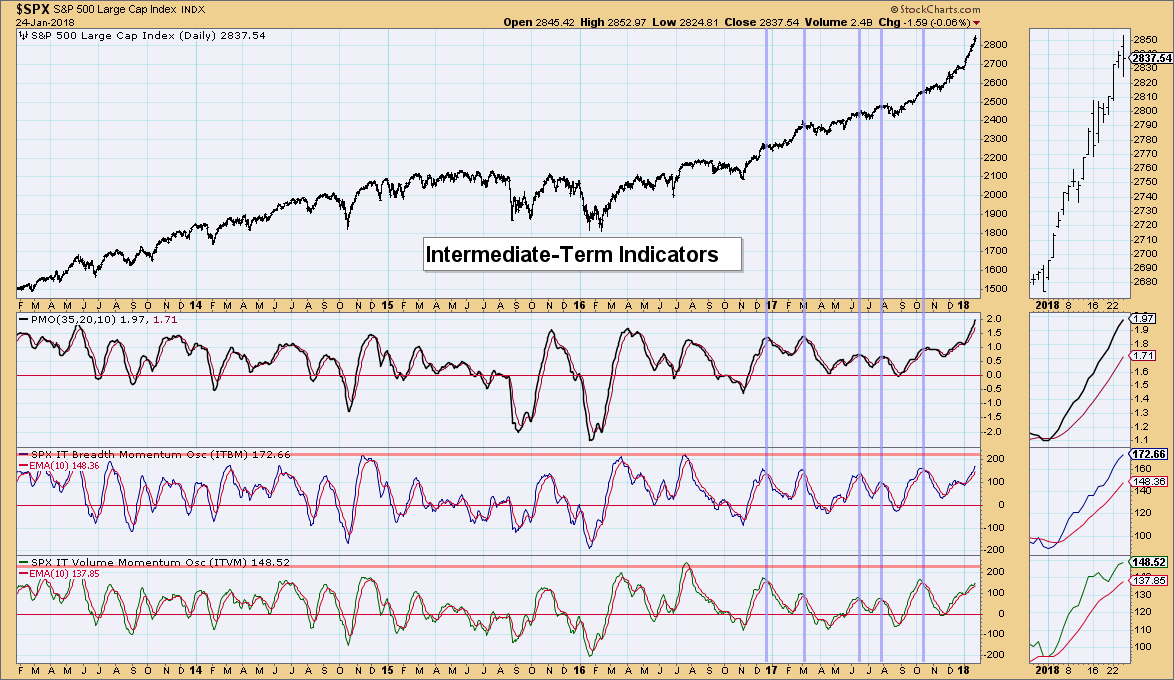
Intermediate-Term Indicators:
These indicators remain bullish albeit overbought. They haven't hit extremes for the year, but they're getting very close. For now I would say they are bullish in the intermediate term.
Conclusion:
Overall the market still looks healthy with all four Scoreboards filled with green and rising IT indicators. However, some caution is warranted given the negative divergence between the STOs and very overbought IT indicators. . .
 News
News  Market Data
  Discover