Whatever The Fed Does…It’s Bullish By: Lance Roberts | September 23, 2017
It’s Bullish…
On Wednesday, the Federal Reserve announced the latest decision by the Federal Open Market Committee with respect to monetary policy. That decision contained two primary components:
1. No rate hike currently, although, as expected, announcements of further rate hikes in the future, and; 2. The beginning of the process to cease reinvestment of the Fed’s balance sheet.
The announcement was notable for two reasons:
1. The Fed did NOT hike rates because the underlying economic data, and, in particular, the inflation data, suggests the economy is too weak to absorb a further increase currently, and; 2. The unwinding of the balance sheet is generally believed to be bullish for stocks.
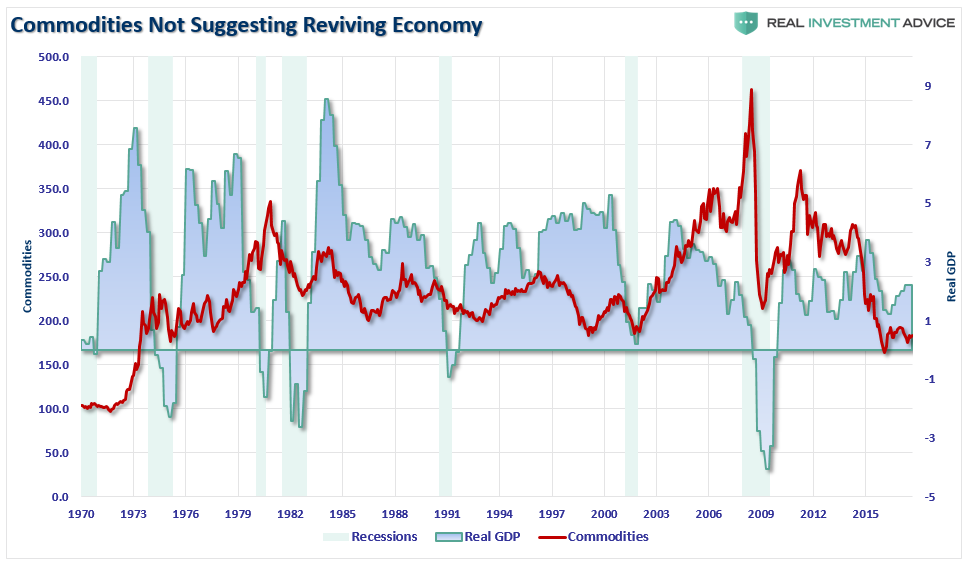
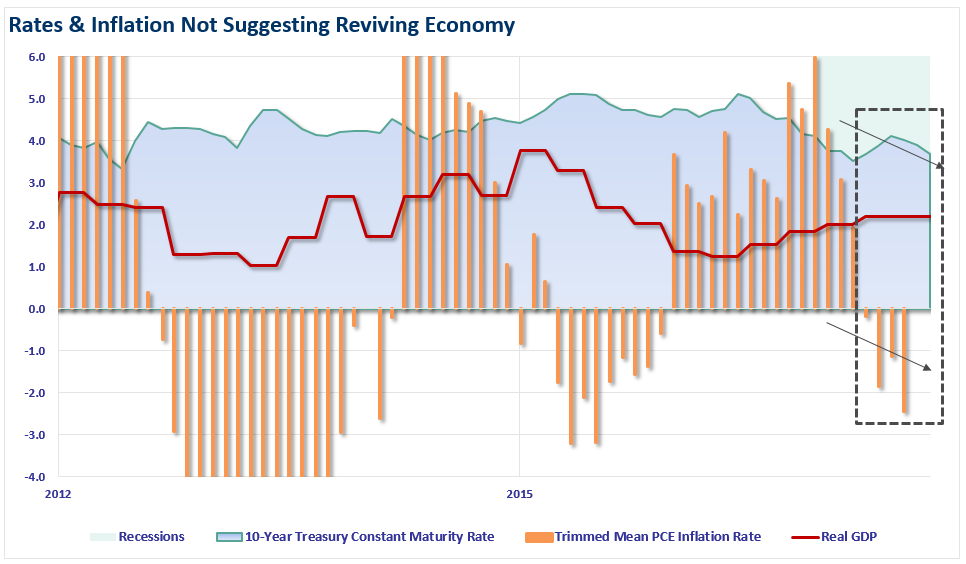
It is specifically the second point I want to address today, although, as shown below, commodities, PCE inflation, and interest rates currently suggests there is downside risk to current economic projections.
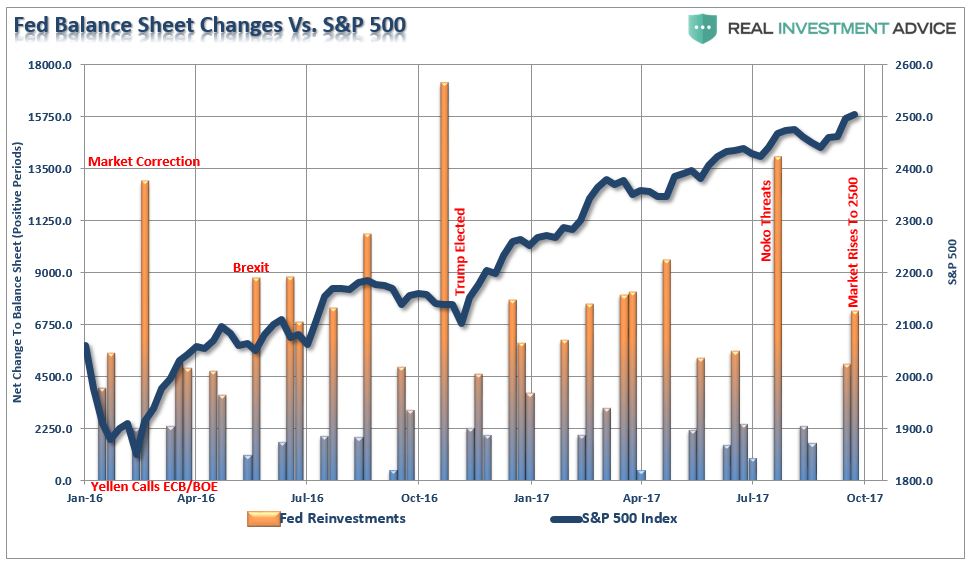
As I discussed on Friday, while the Fed talks a good game about a strengthening economy, improving jobs and rising asset prices, it is interesting to see the “coincident timing” of the Fed’s reinvestment of their balance sheet.
With that in mind here is the observation to consider.
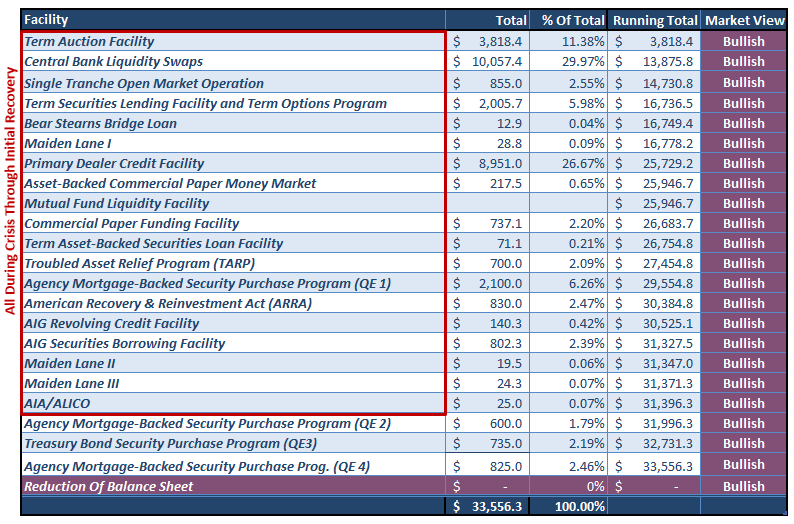
As shown in the table below, since 2009, there has been clear evidence that unbridled Central Bank interventions directly supported the market’s advance. All them considered “bullish” for asset prices.
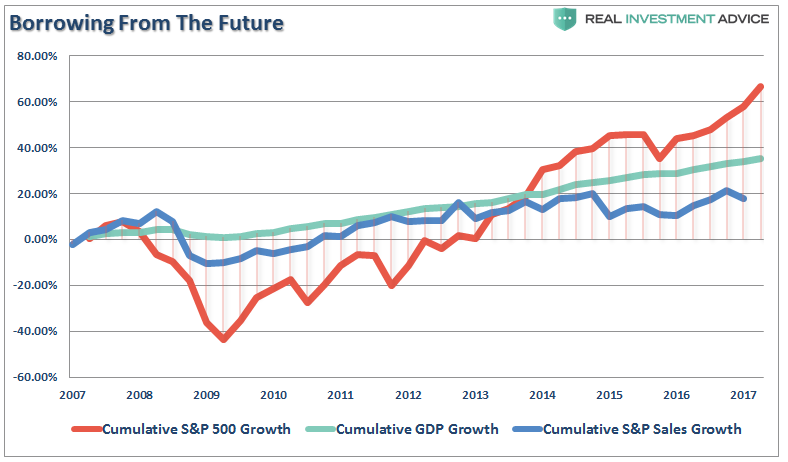
Of course, after $33 Trillion in liquidity injections, bailouts, and supports, it should not be surprising that asset prices have been elevated well beyond the underlying growth of the economy or corporate revenue.
Furthermore, the ROI on those investments have been poor at best with each $1 of injections yielding just a $0.063 return economically speaking.
Now, ironically, despite the clear evidence of the support for the markets provided by near zero-interest rate policy and trillions in monetary injection, it is believed that “unwinding” those supports will have “no effect” on the market.
Apparently, it doesn’t matter what the Fed does, it’s “bullish.”
But let’s be very clear about one thing.
The Fed does NOT honestly believe in the strength of the recovery, that inflationary pressures are present OR that employment is as strong as stated.
It’s actually quite the opposite.
IF they believed in the strength of the economic data, as they suggest following their regular meetings, they would have been increasing rates and reducing the balance sheet in 2010 as growth exploded from the recessionary lows. But they didn’t.
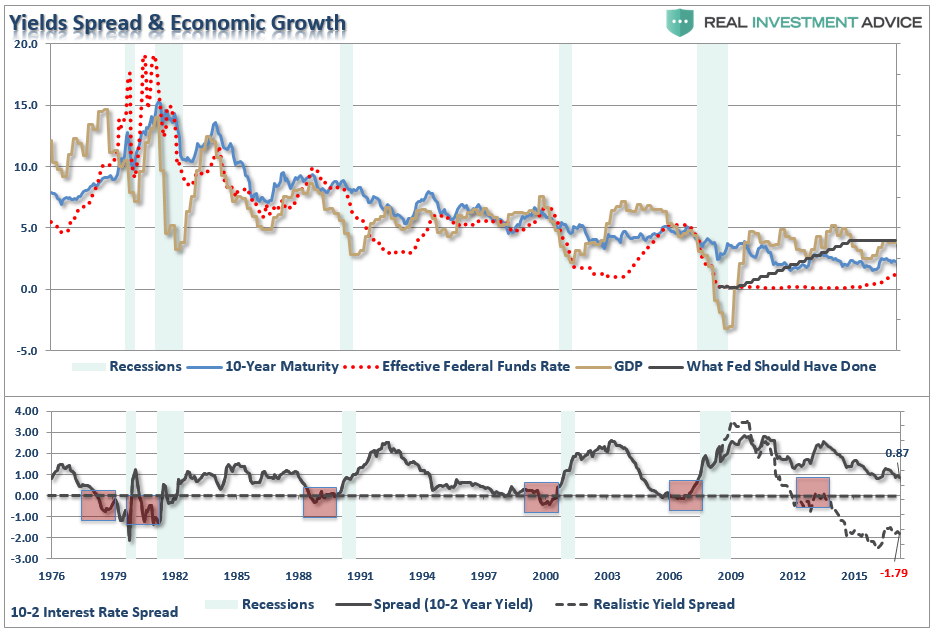
(The chart below shows 10-2 year rate spread and Fed Funds. Note, historically, when the Fed has started hiking rates, it was NOT the beginning of an economic expansion, but rather the end.)
Nor did they hike rates in conjunction with repeated liquidity injections from their ongoing balance sheet expansions. Such action s should have been the case as the liquidity flows would have offset the drag from higher borrowing costs.
But they didn’t.
The reason they are contracting the balance sheet now, and hiking rates, is due to the realization we are likely closer to the next recessionary period than not. The 10-2 year spread at just 0.87 as of the end of August (using monthly data) suggests the same.
As I stated previously:
“Unfortunately, what the Federal Reserve is quickly realizing is they have become trapped by their own ‘data-dependent’ analysis. Despite ongoing commentary of improving labor markets and economic growth, their own indicators have continued to suggest something very different.
Now they are simply considering abandoning those tools.
Is this a sign they have lost control of monetary policy?
Probably.
Will this ultimately lead to a policy misstep the disrupts the financial, and most importantly, the credit markets?
Definitely.
Why do I say that? Because there have been absolutely ZERO times in history that the Federal Reserve has begun an interest-rate hiking campaign that has not eventually led to a negative outcome.
While the Federal Reserve clearly should not raise rates further in the current environment, it is clear they will remain on their current path. This is because, I believe, the Fed understands that economic cycles do not last forever, and we are closer to the next recession than not. While raising rates will accelerate a potential recession and a significant market correction, from the Fed’s perspective it might be the ‘lesser of two evils.’ Being caught near the ‘zero bound’ at the onset of a recession leaves few options for the Federal Reserve to stabilize an economic decline.”
Reality Bites
The problem for the Fed, despite their jawboning, is their ability to actually accomplish the “Great Balance Sheet Unwinding Of 2018.”
The guys at Knowledge Leaders summed the problem up well:
“If the Fed starts shedding assets at $10 billion/month, ramping to $50 billion/month by 2019, can the private sector absorb these securities at the same the government budget deficit is set to widen by perhaps $100-$150 billion in the next couple years?
Not to state the obvious, but all else equal, if the fed started shedding assets at $30 billion a month (or $360 billion a year), they would exhaust the entire stock of private savings. This doesn’t allow for larger government deficits. Given the current savings level, it is mathematically impossible for the Fed to shed assets at $50 billion/month. By 2019, as we are farther out from peak net savings rates set in 2015, it is likely the stock of private savings is smaller still, and hence the ability for the Fed to shed assets at a rate of $50 billion/month is utterly impossible. Net savings have fallen in the last 2 years from a peak of just over $700 billion to the current $355 billion. Will savings halve again in the next two years? If so, there is no mathematical way in the world the Fed can shed assets at the rate it outlined yesterday.”
That bit of analysis supports the comments made by BofA on Friday:
“This point can be summarized simply as follows: there is $1 trillion in excess TSY supply coming down the line, and either yields will have to jump for the net issuance to be absorbed, or equities will have to plunge 30% for the incremental demand to appear.”
“An unwind of the Fed’s balance sheet also increases UST supply to the public. Ultimately, the Treasury needs to borrow from the public to pay back principal to the Fed resulting in an increase in marketable issuance. We estimate the Treasury’s borrowing needs will increase roughly by $1tn over the next five years due to the Fed roll offs. However, not all increases in UST supply are made equal. This will be the first time UST supply is projected to increase when EM reserve growth likely remains benign.
Our analysis suggests this would necessitate a significant rise in yields or a notable correction in equity markets to trigger the two largest remaining sources (pensions or mutual funds) to step up to meet the demand shortfall. Again, this is a slower moving trigger that tightens financial conditions either by necessitating higher yields or lower equities.”
Given that household savings as a percent of GDP, and interest rates, have a long history of correlation, the analysis above suggests that both interest rates and equities will be lower in the months ahead.
Potentially, substantially so.
This is particularly the case given that D.C. may be the “reality that bites” this market right in the @$$.
With John McCain confirming on Friday that he will NOT support the latest attempt to “repeal and replace” the Affordable Care Act (ACA), this leaves little chance for the bill to pass the Senate.
As I have repeatedly stated previously, the problem with the lack of repeal of the ACA is the $900 billion in taxes embedded in the legislation. This makes the passage of tax reform, on which the market is clinging to support earnings growth and valuations, nearly impossible to pass under the “reconciliation” process.
Furthermore, the inability to come to an agreement to repeal and replace the ACA just goes to show how problematic passing legislation, even in a majority controlled Administration, has become. Since tax reform legislation is even more complicated and contentious than health care, it is not surprising why it has been 30-years since the last reform was completed.
Given that Democrats will oppose any legislative agenda of the current President, and given there are a sufficient number of moderate Republicans who will vote against a more “nationalistic agenda,” the probability of aggressive tax cut/reform legislation getting passed in Washington this year has fallen to virtually zero.
What will likely wind up being passed are temporary tax cuts, no real substantive reforms, and a grab bag bull of temporary “gimmes” which will likely disappoint the market’s future “earnings growth hopes.”
Pay attention to the D.C. intrigue next week as we are likely to see the first release of the proposed tax reform legislation.
It could very well be a “buy the rumor, sell the news” scenario.
Market Clings To 2500
However, that is for another article down the road.
The short-term analysis of the market remains broadly positive with both the ongoing bullish trend and recent break above 2500 remaining intact through the close on Friday. As I noted last weekend:
“Since the election, there has been a concerted effort to push stocks higher on the hopes of tax reform, ACA repeal, and infrastructure building which would lead to strongly improving earnings for U.S. companies. Now, eleven months later, stocks have been breaching the psychologically important levels of 2200 in December, 2300 in February and finally 2400 in May. 2500 is the next target.
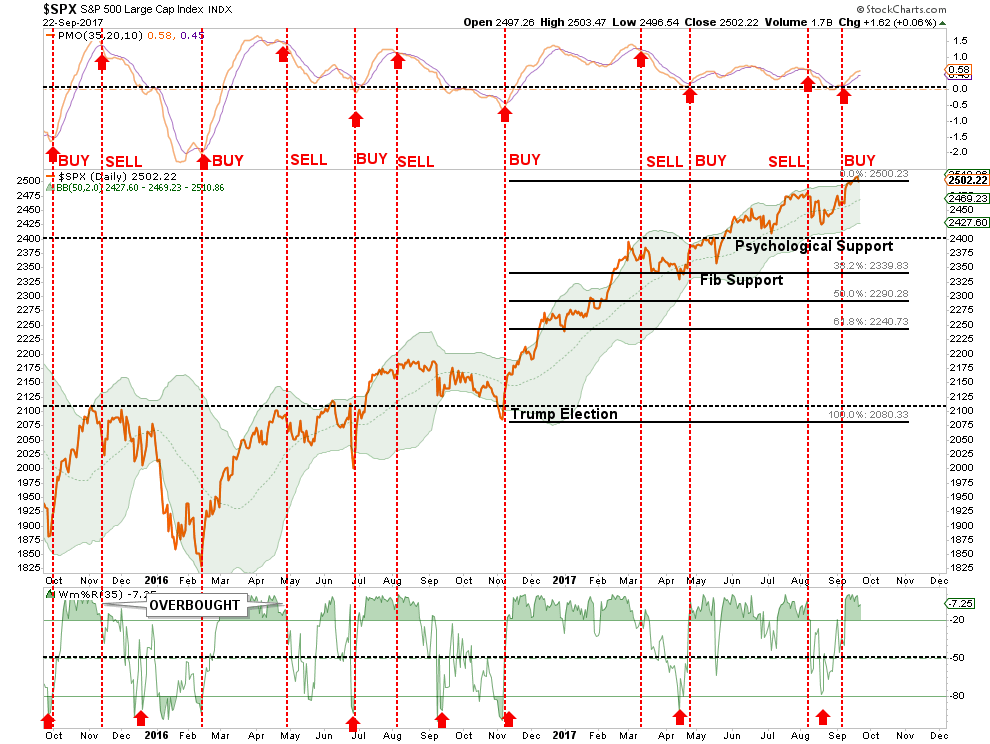
As shown below, the market is pushing a short-term “buy” signal. However, now at 2-standard deviations above the 75-dma, as seen previously, the market likely has limited upside from here.”
While the market does remain bullish in the short-term, keeping our portfolios tilted toward equities, we remain exceedingly cautious due to the chart below. (I know this is a little busy, but bear with me.)
The chart above looks a market complacency as it relates to market risk. When “complacency” has reached previous extremes, above the red bar, markets have often been close to a corrective process or have struggled to make further gains. With the volatility index back to historic lows, we are reticent to increase equity exposure at these levels further at this juncture.
More importantly, the blue dashed trend line has been solid SUPPORT for the bull market advance since the beginning of 2016. The recent violation of that trendline, has now turned that previous support into overhead resistance. That resistance is currently weighing on attempts for the market to advance solidly above 2500.
With complacency elevated, markets very overbought and sentiment excessively bullish, as discussed last week, we are already cautious. A failure next week to hold 2500 will turn us even more cautious. . .
 News
News  Market Data
  Discover