Breadth Charts - PnF Charts - Full Stochastic Scan By Greg Schnell | August 19, 2017
A big thank you to everyone who listened in on Fridays webinar. Hopefully you didn't find the charts too long-term without Tom Bowley. Erin Wood and Tom Bowley will be back on the Monday Market Watchers Live show.
Here is a link to the RECORDING! Yes, these are recorded now!
In this particular show, I started reviewing the Market using my breadth indicators, jumping into Point and Figure (PnF) charts for the second segment and then spending some time on the Alerts about 1:15.
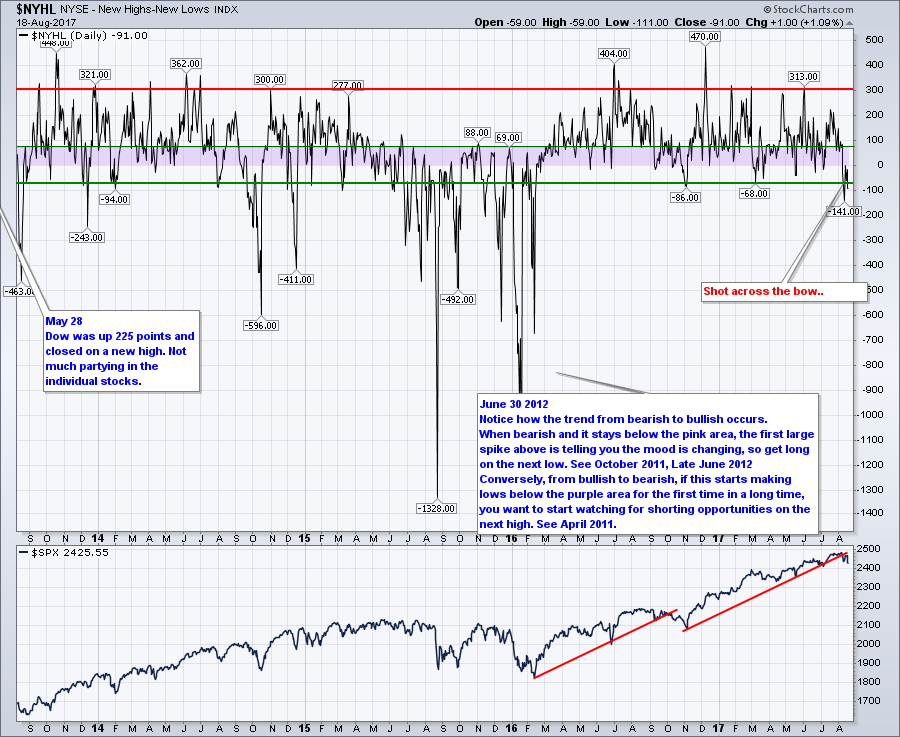
There were multiple requests for the $NYAD chart to be posted, so click on the chart below and you can save it. This chart is explained thoroughly in the webinar. The coverage of market breadth begins at 12:00. The Webinar recording explains how to save charts complete with annotations.
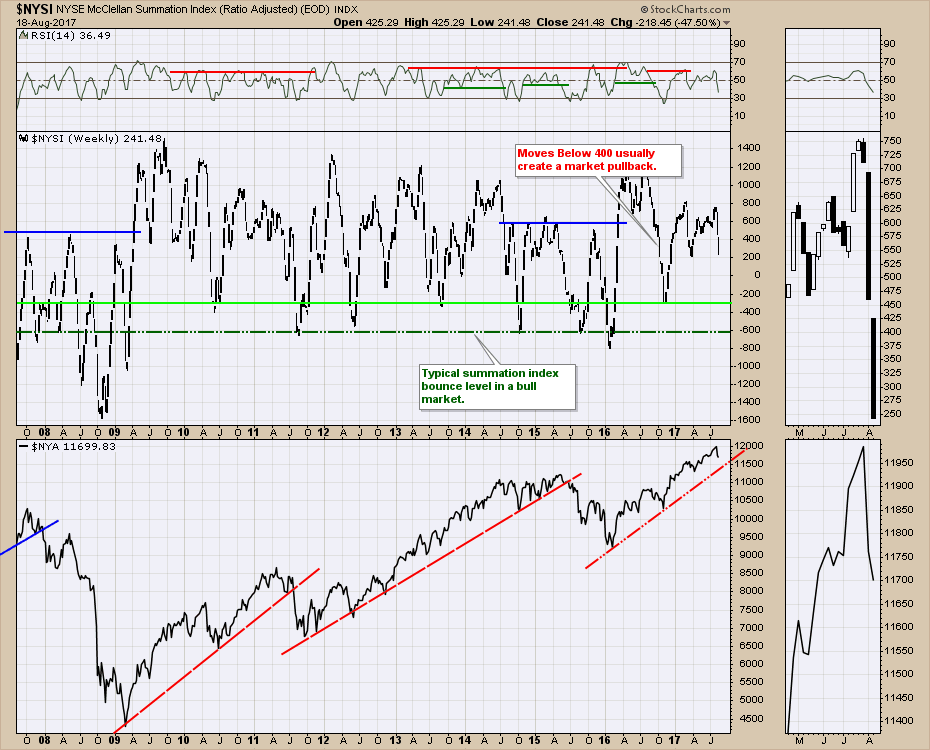
This is the McClellan Summation Index, $NYSI. Moves below 400, usually start a correction.
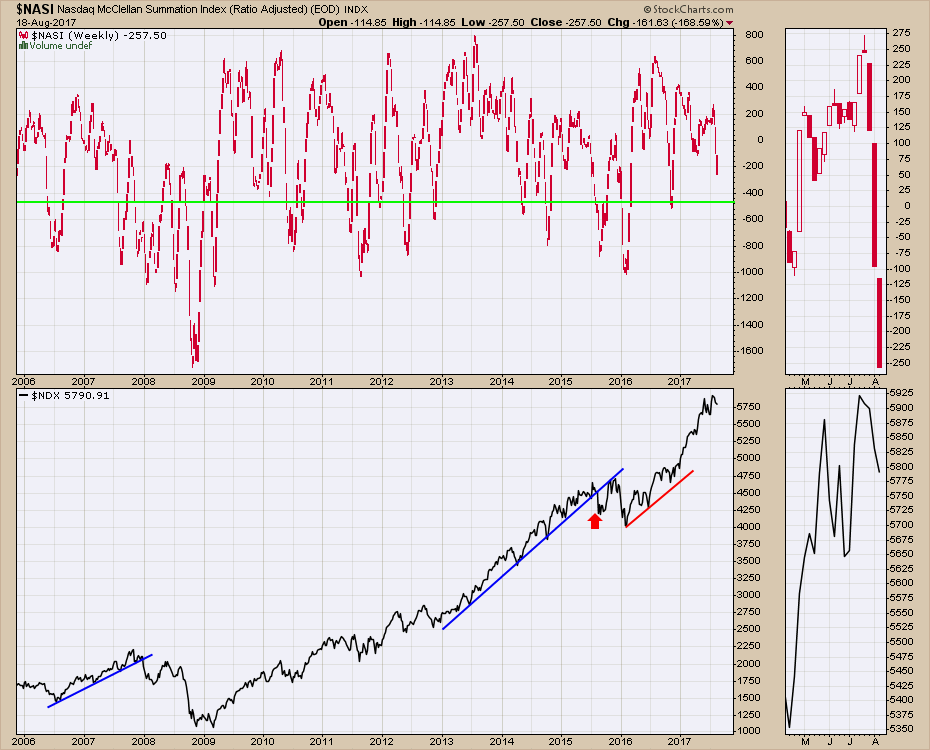
For the NASDAQ Summation Index ($NASI), the levels are different, but the concept is still the same.
 News
News  Market Data
  Discover