Weekend Reading • • • By Lance Roberts | July 28, 2017
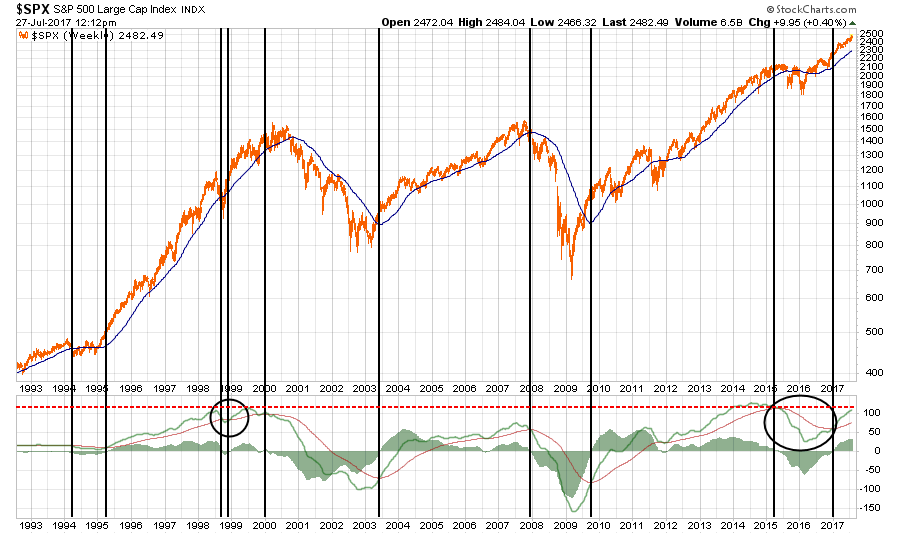
The chart below is the S&P 500 on a WEEKLY basis going back to 1992. While it is clear the bullish trend is currently intact, which suggests the markets could indeed rise further, the deviation from the 1-year moving average is pushing more historical extremes.
Furthermore, the two circles on the lower part of the chart show the longer-term “buy/sell” signals which have been historically accurate in adjusting risk in portfolios. As you will notice, just like in late 1998 and early 1999, there was a sell signal which was reversed WITHOUT the market dropping into a bear market. The subsequent rally pushed asset prices and valuations to extremes in early 2000.
I don’t need to remind you what happened next.
Currently, we see the same build up in exuberance, leverage, and speculation. The sell signal in 2015/2016 has been reversed following the Trump election. More importantly, just like in 1999, the indicators are running at historically very high levels.
I probably don’t need to remind you what will happen next.
It is just a function of time.
In the meantime, the bullish trend remains intact. So, we participate for now but we do so with a high level of caution and very tight stop losses.
So, with that said, this is what I will be reading on vacation.
 News
News  Market Data
  Discover