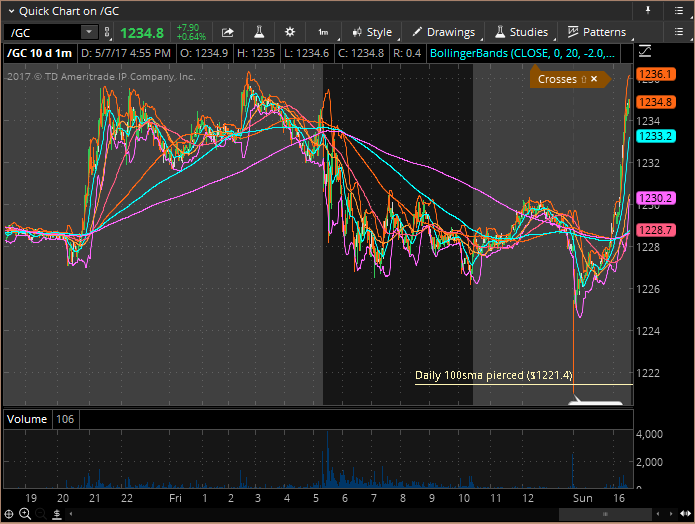
/gc crystal ball???? ... would love to see it unfold this way relief bounce from the daily 100sma 1221.4 to +/-1240 fall back to possible support yellow trend line +/-1212-15 depending on when it gets there possible spike down to daily 500sma currently 1208.9 bounce to test the daily 200sma 1248.8 and falling... wherever it is, when it is aultimately failing to launch over the 200sma and finding a new trading range under it for a while I'd love to see that 100sma tested in regular hrs trading and start swing trading ugld big if's, so... In a perfect world ;-)
 News
News  Market Data
  Discover