Buy:sell, daily shorts & pps 04/20 2017 EOD
The conventional TA items offer no hope for a near-term end to this down-leg other than a couple oversold oscillators and a volume rise sufficient to offer a hope that it was capitulation, but not sufficient to strongly suggest it. It's all relative.
My unconventional stuff is a bit more optimistic, but not much. The spread narrowed to a range suggestive of entering short-term consolidation, but that may also be a "Friday effect". The short percentage returned to a normal range. The larger trades percentage of day's volume moved a wee bit closer to normal, but is still high.
The potential optimism is offset by a still awful buy percentage and bad movements in the OLHC. Further, the intra-day behavior had the typical early higher prices followed by drop, flattish, drop, flattish, ... and no recovery until an obvious 15:58 manipulation to try and get a better close, pushing price from $0.76 to $0.78 on 5K. That failed to hold as 15:59 had 0 trades (highly unusual) and we got a close at $0.76 - right were the preceding 1.5 hours traded on extremely low/no-volume.
I've become convinced that the warrant holders are driving the current behavior and see my minimal chart's rising medium-term support (rising orange line - see new chart below) that I felt would hold if challenged now likely not to unless we see signs that the warrant holders are not present at the time of the challenge.
In summation, with the exception of sporadic hiccups, I thing the leg-down remains in place and we won't yet enter a short-term consolidation.
If the warrant holders exit that all changes! Was today the first signs of that or just a "Friday effect"? I don't know.
There were no pre-market trades.
B/a just before open was 500:500 $0.7701/$0.8179.
09:30-10:05 opened the day with a 507 sell for $0.7700 & $0.7701 x 100, $0.77 x 29, $0.78 x 51, $0.7701 x 4, x 100. B/a just after open was 500:800 $0.7701/$0.78. Then came 9:31's 800 $0.7717 (100)/01/00, 9:32's b/a 20K:3K $0.7700/97 (offers falling), 9:32's 355 $0.77, 9:33's 400 $0.7701/0, 9:34's 200 $0.77, 9:35's 300 $0.7701/0, 9:36's 300 $0.7701/0, 9:37's 500 $0.77, 9:38's b/a 16.1K:600 $0.77/1, 9:38's 15.7 $0.77, 9:39's 24.1K $0.7700 (21.3K)/$0.7630/13/05/02/40/21/22/40, 9:40's 800 $0.7609/15/12/15/16, 9:41's 100 $0.7617, 9:42's 1.9K $0.7617/11/17, 9:43's 2K $0.7621/22/27/49/50, 9:44's 400 $0.7605/6, 9:44's b/a 300:600 $0.7606/99, 9:45's 100 $0.7636, 9:47's 100 $0.7636, 9:48's 300 $0.7636/30/36, 9:49's 1.1K $0.7625/17/19, 9:50's 600 $0.7619/40/60/31, 9:51's 200 $0.7631/23, 9:52's 600 $0.7632/23/92/23, 9:53's 300 $0.7626/5, 9:54's 300 $0.7626/99/28, 9:55's 200 $0.7631/30, 9:56's b/a 2.2K;600 $0.7619/99, 9:56's 300 $0.7631/35/32, 9:57's 100 $0.7635, 9:58's 1.3K $0.7640/60/19, 9:59's 300 $0.7640/59, 10:00's 100 $0.7660, 10:01's $0.7666, 10:02's 1K $0.7680/99/80/99, 10:03's 200 $0.7707, 10:04's b/a 1.7K:400: $0.7701/51, 10:04's 1K $0.7750, and the period ended on 10:05's 400 $0.7711/07/11.
10:06-10:08 did a drop on 63.5K: $0.7711/03 (7K)/11 (1.4K)/07/11/07/50/07, $0.7750/31 (5.5K)/07/04/27/07/27/10/27/07/10/04 (9.6K)/05/03/10/03/10/01, $0.7701/00/01/00/01/00 (22.8K)/01/00 (1.2K)/$0.7660/22 (1.8K)/18 (4.1K)/17/19/20/19/18/19.
10:09-10:23 began extremely low/no-volume $0.7619/59 on 10:09's 1.3K $0.7619/44/18. B/a at 10:09 was 300:300 $0.7619/60. The period ended on 10:23's 3.2K $0.7658 (2.2K)/39/55/59/50.
10:24-11:19 began extremely low/no-volume $0.765/775, with highs beginning a slow fall at 10:35, on 10:24's 200 $0.765/$0.775. B/a at 10:40 was 4K:2K $0.7650/$0.7749, 11:03 2.5K:1.6K $0.7650/96, 11:17 1.4K:3.2K $0.7650/92. The period ended on 11:19's 100 $0.765.
11:20-11:59 began very variable-volume $0.76/7, with with rising lows, and slowly falling highs from 11:37 onward, on 11:20's 17.7K $0.7650/17 (4K)/00 (2.8K)/50/19/18/20/18/19/41/22/00/18/00 (3.1K)/01 (1.2K). B/a at 11:24 was 19.9K:600 $0.7600/66, 11:32 9.6K:2.5K $0.7600/71, 11:46 200:1.4K $0.7611/24, 12:01 701:800 $0.7670/92. The period ended on 11:59's 100 $0.7692.
12:00-13:45, after 12:00's 700 $0.7670 and 12:08's 100 $0.7673, began extremely low/no-volume $0.7650/5 on 12:15's 1.6K $0.7670/54. B/a at 12:17 was 200:700:$0.7654/61, 12:32 3.1K:600 $0.7650/1, 12:46 4.7K:800 $0.7650/1, 13:01 3.2K:1.1K $0.7650/1, 13:17 1.9K:1.2K $0.7650/1, 13:31 600:1.5K $0.7650/1. The period ended on 13:45's 200 $0.765.
13:46-13:51, after one no-trades minute, began a drop totaling ~50K, 12.43% of day's volume on 13:47's 21.2K $0.7650 (19.8K)/09/50/09/51/30/09/30/09. B/a at 13:47 was 200:1.5K $0.7650/1. The period ended on 13:51's 28.4K $0.7600 (9.4K)/$0.7590/$0.7600/0.7590 (13.1K)/0.7589 (4k)/99/75/99/50.
13:52-14:21 began an extremely low/no-volume recovery of the price just lost on 13:52's 400 $0.7570/84 and 13:53's 10.2K $0.7600 (2K)/$0.7594/95/$0.7600 (8K). 14:00's 200 hit $0.760/5. B/a at 14:02 was 16K:1,6K $0.7600/99. 14:09's 4.6K hit $0.7653/30 (1.5K)/38 (3K). The rest of the period went extremely low/no-volume $0.7620/5. B/a at 14:18 was 300:1.8K $0.7620/35 (offers falling). The period ended on 14:21's 100 $0.762.
14:22-15:58, after four no-trades minutes, began extremely low/no-volume $0.7600/06 after 14:26's 19K $0.7621/00 (18.6K)/20. B/a at 14:32 was 13.2K:1.4K $0.7600/06, 14:47 12K:2.1K $0.7600/1, 15:02 10.1K:1.3K $0.7600/1, 15:19 15.4K:1.3K $0.7600/1, 15:31 16K:2K $0.7600/1, 15:46 13.3K:1.3K $0.7600/1. The period ended on 15:58's 1.3K $0.7600/1.
15:59-16:00 ended the period and day on 15:59's 5.2K $0.7600/1 (100)/0/$0.77 (100), and 16:00's closing 329 share sell for $0.76.
There were no AH trades.
Excluding the opening and closing trades (didn't qualify), there were 17 larger trades (>=5K & 3 4K+) totaling 142,087, 35.35% of day's volume, with a $0.7660 VWAP. For the day's trade volume, the count seems reasonable. The percentage of day's volume is closer to normal than the last couple days but seems still high. The VWAP is above the day's $0.7646, but it's really close.
With the larger trades again being more evenly distributed, VWAP variation being minimal and the buy percentage again being in the crapper (see below for these three items), my TFH whispers that it's likely the warrant holders, aided and abetted by the MMs, of whom they are probably "good customers", are in the market dumping dirt-cheap shares. It's also possible that the ATM is in use, but recall that use was restricted by the agreement with the warrant holders.
Of course, I could be wrong about that. We could have regular old shorters seeing what I'm seeing and taking advantage, accounting for a great deal of this weakness. What argues against that is the consistency over the last few days of the elevated short percentage even when the larger trades are likely masking the true short percentage. If you look at the table below, you'll note the recent change in the short percentage - running much higher than both the prior average and the typical maximum values. If the percentage of day's volume in the larger trades was closer to "normal", say mid-20% range, the short percentages would likely be even higher.
All that is what seems to me to suggests something other than normal shorting activity. I think the warrant holders are shorting while price is high and then covering with the issued shares. Since they aren't doing covering buys, that keeps the buy percentage, as well as the VWAP, suppressed. Ending Period Period Period __Per. Trade_ Period_ % Day_ Per. End
Period Volume Low High _Dollar Val._ VWAP___ Volume Buy ~%
10:05 57837 $0.7602 $0.7750 $44,440.23 $0.7684 14.39% 12.66% Incl 09:38 $0.7700 4,400 5,000 09:39 5,000
10:08 63535 $0.7617 $0.7750 $48,899.18 $0.7696 15.81% 11.03% Incl 10:06 $0.7703 7,000 10:07 $0.7731 5,500
10:07 $0.7704 9,600 10:08 $0.7700 22,800
10:23 6720 $0.7618 $0.7659 $5,135.26 $0.7642 1.67% 13.35%
11:19 25714 $0.7650 $0.7750 $19,754.24 $0.7682 6.40% 13.32% Incl 11:15 $0.7700 8,014
11:59 77149 $0.7600 $0.7700 $58,902.51 $0.7635 19.20% 17.61% Incl 11:20 $0.7617 4,000 11:27 $0.7600 7,248
11:28 $0.7692 6,400
13:45 24901 $0.7632 $0.7673 $19,055.12 $0.7652 6.20% 20.21%
13:51 49970 $0.7550 $0.7651 $38,056.13 $0.7616 12.43% 29.07% Incl 13:47 $0.7650 19,300 13:51 $0.7590 4,528
13:51 $0.7590 5,752
14:21 17557 $0.7570 $0.7653 $13,363.89 $0.7612 4.37% 28.36%
15:58 71370 $0.7600 $0.7621 $54,246.25 $0.7601 17.76% 27.07% Incl 14:26 $0.7600 17,545 14:32 $0.7606 5,000
15:02 $0.7601 5,000
16:00 5545 $0.7600 $0.7700 $4,215.21 $0.7602 1.38% 29.75%
I can't today say that VWAP is disconnected from buy percentage as was the case the last couple days - the buy percentage movement were too small to be meaningful and VWAP movement likewise.
Do take note that the three minutes in the 10:08 period accounted for ~16% of the day's trade volume and had the highest VWAP of the day. This would be the one place where if asked who was buying ... Well, you know what I would think - retail investors with a time-horizon longer than 30 seconds and not belonging to a 2nd or 3rd tier financier organization, like our warrant holders are, IMO.
But, again, I could be all wrong.
On the traditional TA front, movements were: __Open_ ___Low_ __High_ _Close_ Volume_
Today -2.53% -1.95% -5.49% -1.81% 50.81%
Prior -2.95% 1.28% 0.61% -2.03% -22.80%
Well, this is certainly not a good sign - all the metrics going in the wrong direction now, especially the volume which says strength in the leg down is growing after spending some days suggesting the downward pressure was abating (see the table below).
Time for a new minimal chart. Pretend 4/21 is not there yet - I do. The last red bar on the right is what we're examining today.
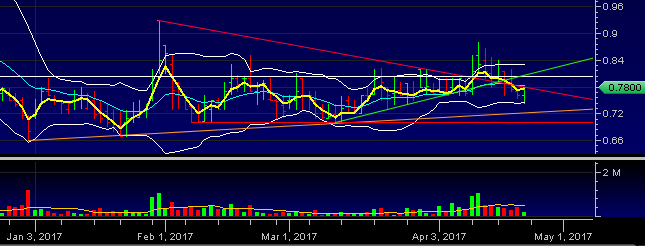
On my minimal chart, you want the bad news first or the bad news first?
First the trend is now so obvious I felt no need to add another trend line to delineate the highs and lows and behavior that is occurring. It would've just made more clutter and by the time anyone might get use from them they will be likely superseded by longer trend lines that will be more important. More on that in a minute.
After a couple days determining we actually did have a confirmed break below the two potential support lines, we got a big confirmation of it today as the downward move accelerated on much higher volume.
You may recall some time back I mentioned I thought that medium-term rising support (the rising orange line) would likely hold when we went down to challenge it. That was before our current spate of metrics made me think we might have the warrant holders dumping in the market. I now believe they are here and whether it holds or not will depend on if they have exhausted their supply of shares.
So, until I see signs this is the case, I believe that support will not hold!
The fast EMA crossed below the slow EMA and is $0.011 below.
Trade was completely below the Bollinger band mid-point of $0.7874.
On my one-year chart it looks like we are below the long-term descending support, but it's still difficult to be certain.
The 50-day SMA continued rising while the 10-day gave up the cost and declined today. If we hold here the 10-day will decline for 9 days (was 9) and the 50-day will rise 4 days (was 7) and decline 7 days as it continues the up/down waves predicted previously. The 20-day SMA continues a decline begun two days ago. If price holds here, it will decline 1 day (was rise 5), go flat 2 days (was decline 2) and decline 15 days (was begin flip-flopping). The 200-day SMA continues to decline.
Yesterday the oscillators I watch had weakening in every oscillator I watch. Only MFI (untrusted by me) was above neutral. All others were below neutral and Williams %R had entered oversold while full stochastic was barely above that range.
Today weakening occurred in accumulation/distribution (appx 7% decline) and every other oscillator except momentum, which strengthened. Everyone except MFI (untrusted by me) is below neutral and Williams %R and full stochastic are deep into oversold condition.
The experimental 13-period Bollinger limits, $0.7432 and $0.8316 ($0.7445 and $0.8311 yesterday), continued the divergence begun yesterday. The mid-point is no declining as the lower limit falls more quickly than the upper limit rises.
All in, the only hope offered for a cessation of the decline resides in the two deeply oversold oscillators and the volume rise being sufficiently large that it's possible we saw what's know as capitulation. I don't believe that latter item though.
Everything else I see suggests continued near-term weakening. Some of my unconventional items have convinced me that we have warrant holders selling heavily into the market. As long as they are present the chances for a stop in the downward movement seem minimal to me. When we get an intra-day breakdown that has some reasonable short and buy percentages with reasonable correlation between them and VWAP movements I will have leeway to have a more positive outlook.
For now I just see continued descent, with a hiccup or two along the way.
[chart][/chart]
Percentages for daily short sales and buys moved in the same direction for a change. The short percentage settled at the middle of my desired range (needs re-check) but the buy percentage remains at a severely depressed level. In aggregate, believe it or not, this may be a sign of improvement, especially the short percentage appearing somewhat normal. This may be a "Friday effect" though, so no handsprings yet.
The spread narrowed into a range that would suggest entering a short-term consolidation is likely but also may be a "Friday effect". That suggestion is supported by a return to normal correlation between short and buy percentages and return of short percentage to a normal range. That's not really strong support though without buy percentage being in a more normal range.
The VWAP's rolling average of the last twenty-four movements, after having improved to 11 negatives and 13 positives for one day, returned to 12 negatives and 12 positives, making three of the last four days with this reading. Change since 03/16 is $0.0128, 1.70%, and the averages of the rolling 24-day period seen in the last few days (latest first) are now 0.1106%, 0.3283%, 0.2923%, 0.5141%, 0.4794%, 0.4700% ,0.2025%, 0.1853%, 0.0928%, and 0.1136%.
All in, we are offered some hope that the down-leg may come to an end, at least temporarily. We have to consider that this may be a "Friday effect" though.
Bill
 News
News  Market Data
  Discover


