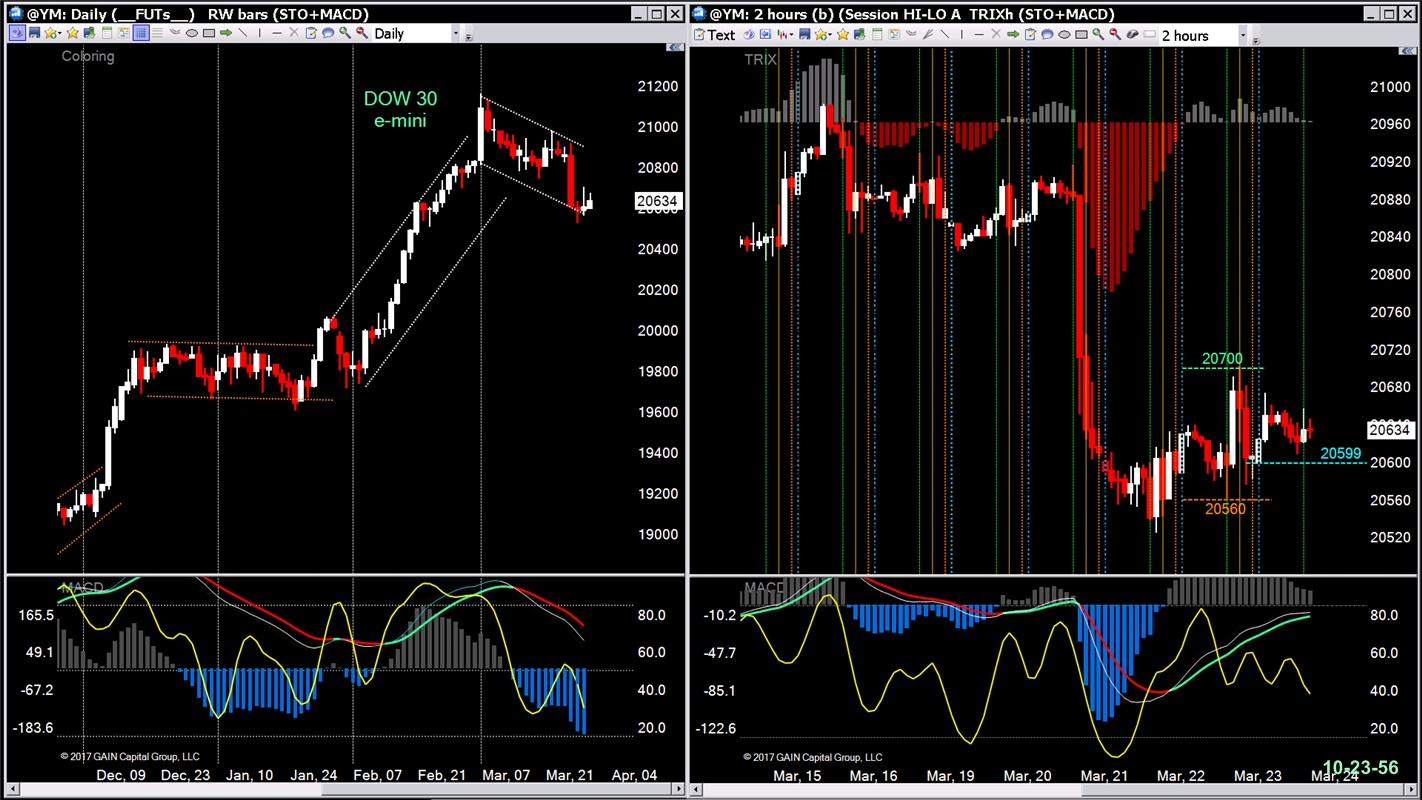
It helps to have multiple-monitors to spot opportunities 6 monitor chart layout: M 1 - Daily and 2 hour showing severals sessions or days: M 2 - 1 hour, 2-3 sessions and 30 minute showing part of yesterday and today's session so far: M 3 - 15 minute showing the major market current session from the open and 5 minute showing about 5 hours of the current session:
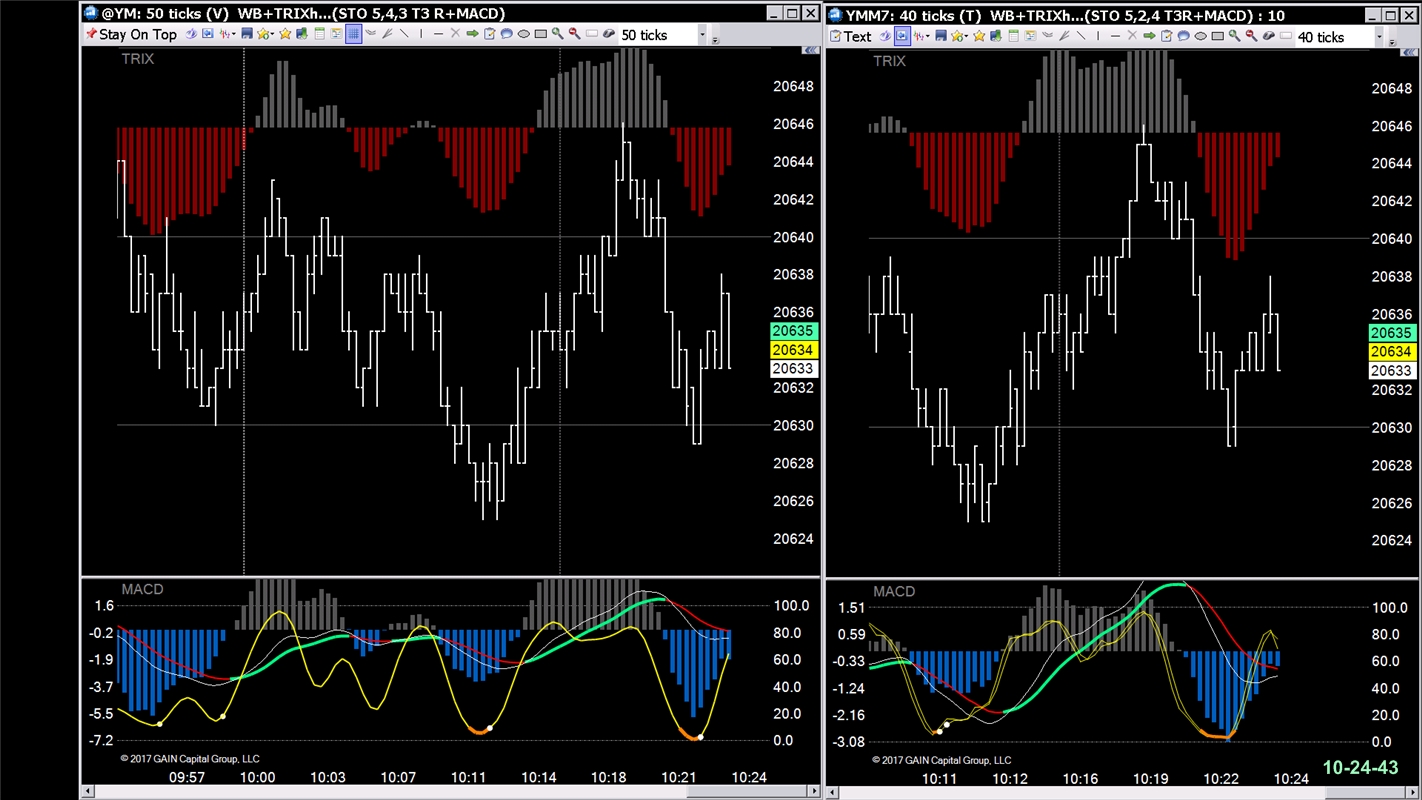
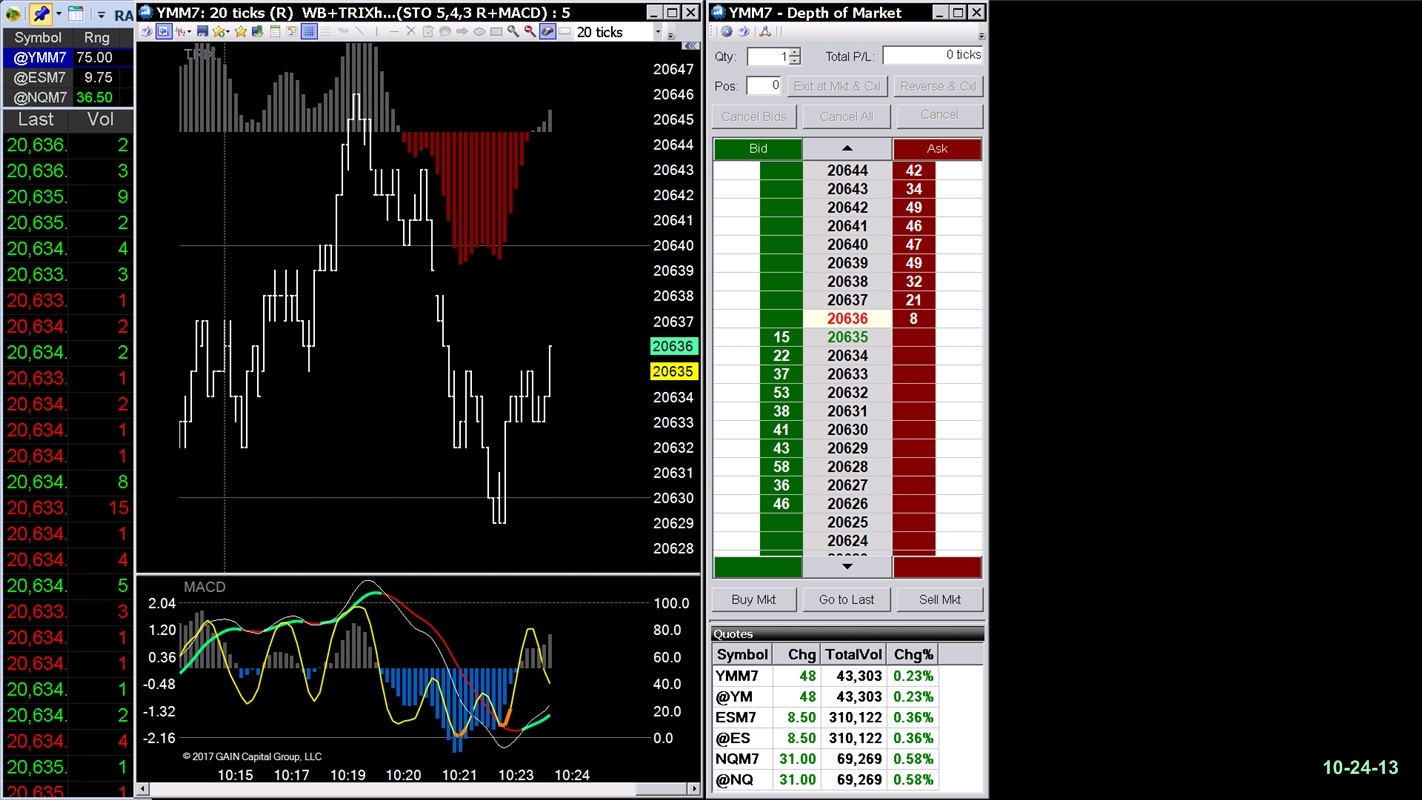
The lower monitors are for tick charts, each showing diminishing increments of the current session. The two right hand charts are what I call T-Mode, for order entry... M 4 - 60T M 5 - 50T and 40T M 6 - Time & Sales, 30T (primary T-Mode chart) and DOM
 News
News  Market Data
  Discover