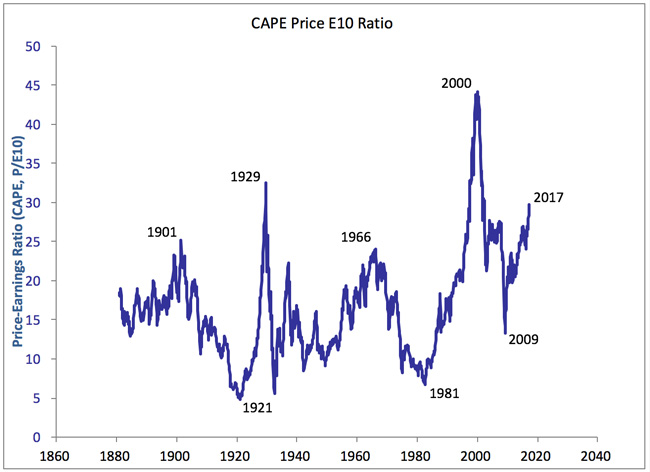
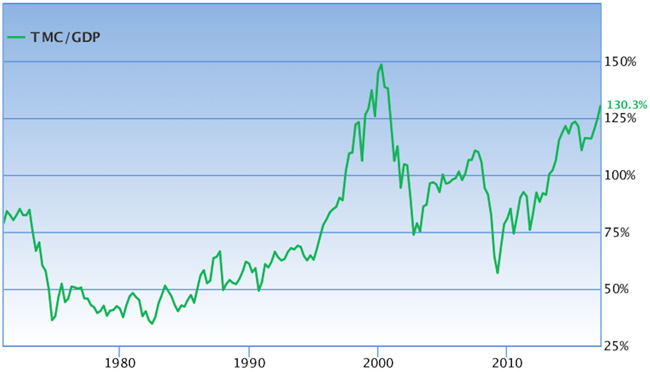
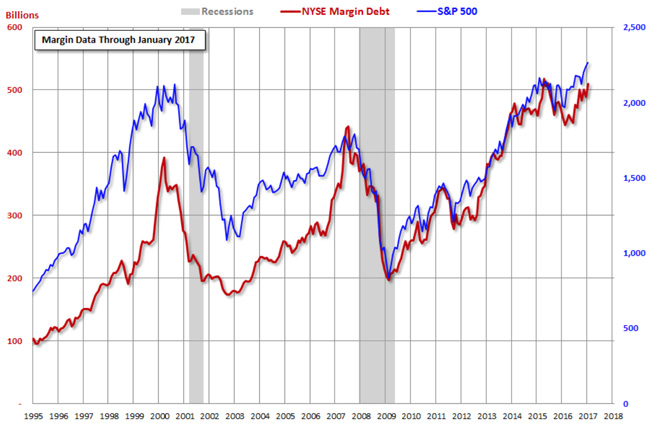
Bigworld, Looking closer at 3 of those 5 charts (see below), what strikes me is that in all 3 charts the current situation has not gone fully parabolic yet (not even close), as it had done during the previous market peaks (2007, 2000, 1929).
That suggests that despite the current overvaluations and relatively high readings, there is considerably more room to go before they reach the previously seen peaks, ie they need to replicate the hyperbolic steepness seen previously.
I remember Alan Greenspan's 'irrational exuberance' comment, which he made in late 1996, a full 3 years before the market made its actual peak. At 8 years, the current bull market is historically long, but since the Fed is so keen/desperate to normalize interest rates, and since they'll need a stable market to accomplish that, they will therefore be highly motivated to maintain a buoyant market. That's the theory anyway..
Bigworld, Here are some chart reversal patterns to look for when considering going short (see below). These patterns are seen during the transition period when an uptrend is reversing to become a downtrend.
With all of these you only short when the setup is complete and key support is broken. You can short then if you're aggressive, but after support is broken it will often come back up to re-test that support level (which is now resistance), and if you're conservative you short after that re-test fails.
If you only short during these chart patterns, your odds of a successful short are high. But the even higher percentage way to short, rather than during a trend reversal, is to short during an already existing ongoing downtrend. That's because a stock/index in an established trend (whether up or down), will tend to stay in that trend. So if you see an established downtrend, especially in a crappier stock, you can short it pretty safely, or short the rallies. However, if that stock begins to form a bottom reversal pattern (which looks like the patterns shown below but upside down), then you don't short.
These are the basic rules, but there are some other factors, like watching the trading volume at key points (for example high volume when support is broken). It's not that complicated or dangerous if you just 'follow the rules'.
I know the basic rules but have not actually put them into practice. Once you have real $$ on the line and add the emotional components of greed/fear into the equation, it makes it harder, but if the basic rules are followed then you should have a lot more winning trades than losing. But if the chart goes against you, you have to get out and take the small loss. Letting losses run, or doubling down on a bad trade, won't work percentage-wise and will likely result disastrous losses. You have fess up and get out of the bad trade and wait for another favorable chart setup -
Head + Shoulders Top -
Double Top -
Bump and Run Top -
Triple Top -
Established Uptrend - never short this unless/until it forms a reversal pattern -
Established Downtrend - this is a relatively safe way to short, especially if its a low quality stock. You can just stay short (or short the rallies) until a reversal pattern develops (which in this case is an inverse head + shoulders bottom), at which time you close out the short position and might start to consider going long (~Oct 2002) -
Anyway, just some of the basic concepts from the 'ChartSchool' at Stockcharts.com. I love this chart stuff because it brings a quasi-scientific element into the equation and removes some of the emotional aspect. What charts actually do is provide a way to quantify the collective behavior of millions of investors. So many people and institutional investors follow these chart rules that they become self-fulfilling, which makes 'the rules' even more predictive and effective -
 News
News  Market Data
  Discover