Following futures positions of non-commercials are as of February 21, 2017.
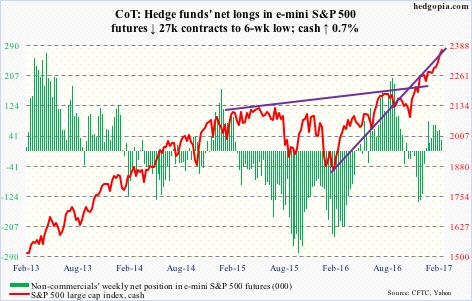
E-mini S&P 500: Flows continue to cooperate.
In the week ended Wednesday, U.S.-based equity funds took in another $2.7 billion. This was the fourth consecutive week of inflows during which $30.4 billion moved in. Since the November 8 election last year, these funds attracted $44.8 billion (courtesy of Lipper).
Flows into SPY, the SPDR S&P 500 ETF, have not been as uniform, with the last five weeks alternating between inflows and outflows. This week (through Wednesday), the ETF lost $1.5 billion. Although since the election, inflows have been to the tune of $16.8 billion (courtesy of ETF.com).
At a time when earnings continue to be lackluster, inflows, along with short squeeze, have been a big help, with the S&P 500 (cash) up nearly 11 percent post-election! As extended as the index is, reversal signs are yet to flash.
Currently net long 30.8k, down 27k.
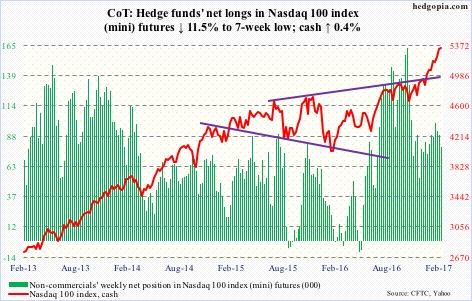
Nasdaq 100 index (mini): Thursday’s candle engulfed Wednesday’s on the cash. In normal circumstances, having come after a relentless rally, this would at least raise a yellow flag. Would this end up being the case this time around? Is momentum waning? Possibly, but not sure.
As things stand, for bears to get any traction, shorter-term averages (daily) need to begin a process of rolling over – they are still rising, as is the 50-day. The 10-day was defended Friday.
In the meantime, in the week ended Wednesday, QQQ, the PowerShares Nasdaq 100 ETF, attracted $438 million. This comes in the wake of outflows of $1.3 billion (courtesy of ETF.com).
Currently net long 79.4k, down 10.3k.
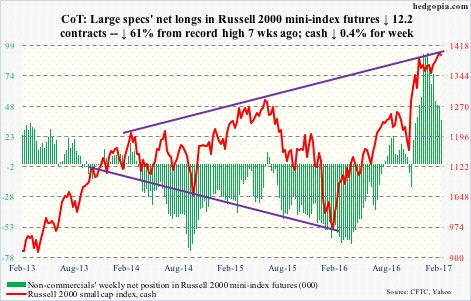
Russell 2000 mini-index: On February 13, the cash broke out of two-month resistance at 1390-ish, subsequently rallying to 1410.40 on the 21st. The index is struggling to build on that breakout, as pressure builds on daily indicators to unwind overbought conditions. The 50-day moving average is now flat. And the weekly chart in on the verge of a bearish MACD cross-under.
Bulls have their work cut out.
In the week ended Wednesday, IWM, the iShares Russell 2000 ETF, lost $521 million (courtesy of ETF.com).
Currently net long 36.5k, down 12.2k.
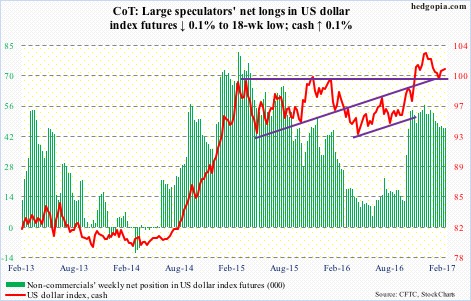
US Dollar Index: FOMC minutes for January 31-February 1 meeting were not hawkish enough for markets to aggressively price in a March hike. At least that is the message coming out of the currency market.
On Wednesday, the day those minutes were released, the cash lost 0.2 percent, as it was once again rejected at the 50-day moving average – and again on Thursday. Dollar bulls need to step up and defend still-rising 10- and 20-day. The latter was defended Friday. But the daily chart is itching to go lower.
Currently net long 45.8k, down 47.
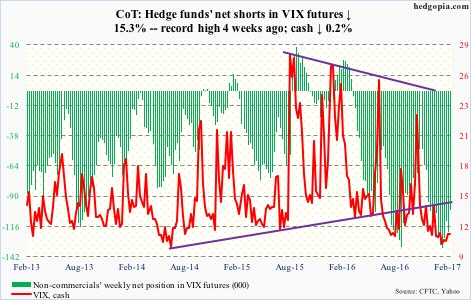
VIX: Through Friday, for six straight sessions, the cash intraday tried to conquer the 50-day moving average and failed. For volatility bulls’ consolation, the average is now flat, as are both 10- and 20-day. As well, on the monthly chart, February thus far is a doji.
In the meantime, the VIX-to-VXV ratio, after a rise to .84 last week, once again dipped back into the .70s. The ratio has now lingered there for seven of last eight weeks – and in 11 out of last 14.
Volatility compression continues. Even the best rubber band will only stretch so far.
 News
News  Market Data
  Discover