:::: S&P 500 DecisionPoint Weekly Wrap :::: By Carl Swenlin | April 14, 2017
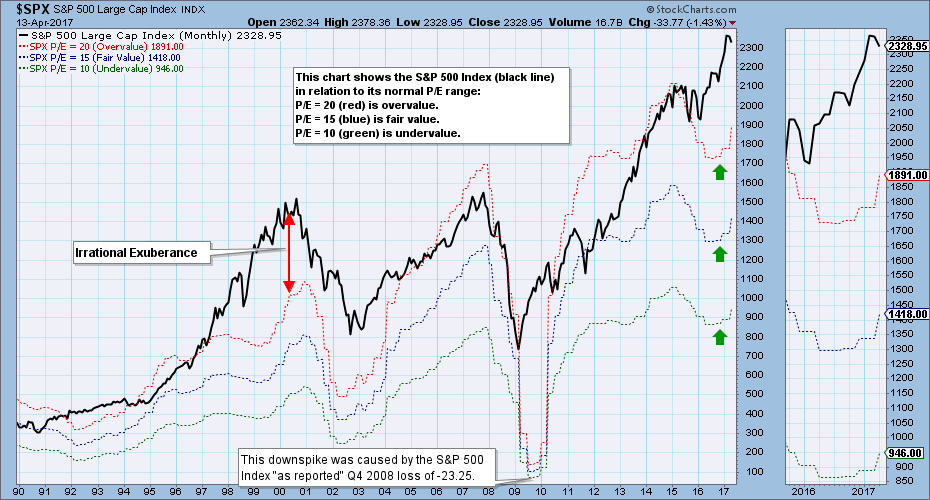
S&P 500 earnings results for 2016 Q4 are in, and the market is still grossly overvalued. The chart below shows the S&P 500 Index (black line) in relation to where it would be if it were undervalued (green line), fair value (blue line), or overvalued (red line). The current price is far above overvalue side of the range, because the S&P 500 has a P/E of 25. Earnings are expected to grow by +26% by the end of 2017 Q4, which would drop the P/E to 20, but only if price goes no higher. If the bull market advance continues, overvaluation will continue to be a problem.
The DecisionPoint Weekly Wrap presents an end-of-week assessment of the trend and condition of the stock market (S&P 500), the U.S. Dollar, Gold, Crude Oil, and Bonds.
STOCKS: Based upon a 11/15/2016 Intermediate-Term Trend Model BUY signal, our current intermediate-term market posture for the S&P 500 (SPY) is bullish. The Long-Term Trend Model, which informs our long-term outlook, is on a BUY signal as of 4/1/2016 so our long-term posture is bullish.
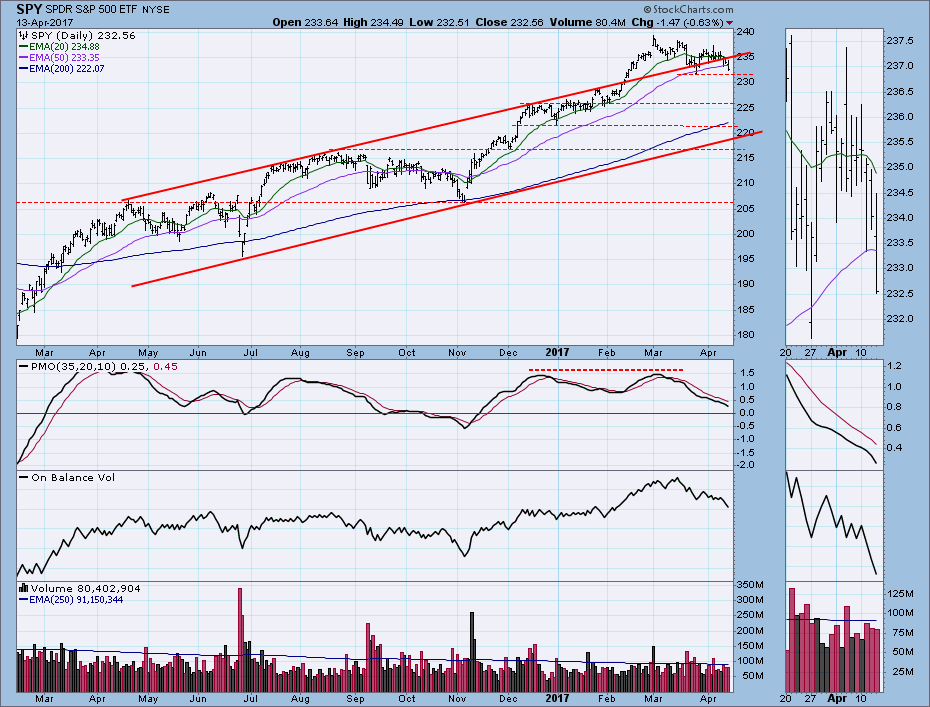
The correction continued to grind on into its seventh week. It is still possible for the bottom to fall out, but I don't expect that to happen barring any seriously adverse news.
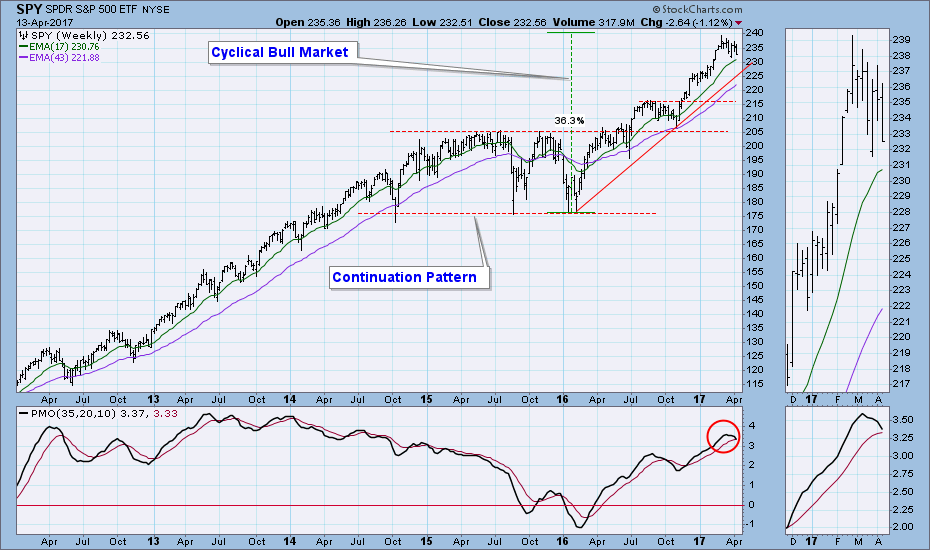
Even if the correction goes deeper than the first line of daily chart support, the weekly chart shows a lot of room before price reaches the rising trend line, which so far has defined the current cyclical bull market. As long as the trend line is not violated, I will not be concerned if the weekly PMO (Price Momentum Oscillator) crosses down through its signal line.
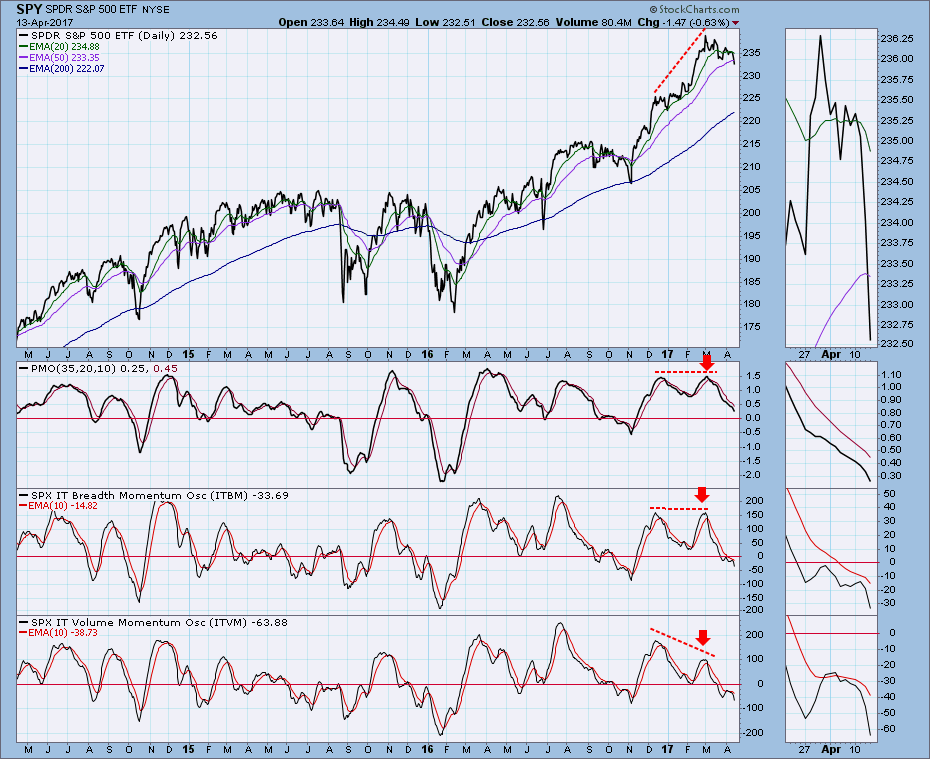
Short-Term Indicators: These indicators are not much use at this time because they have been squeezed into a narrow range, and we don't get the extreme overbought/oversold readings that really attract our attention.
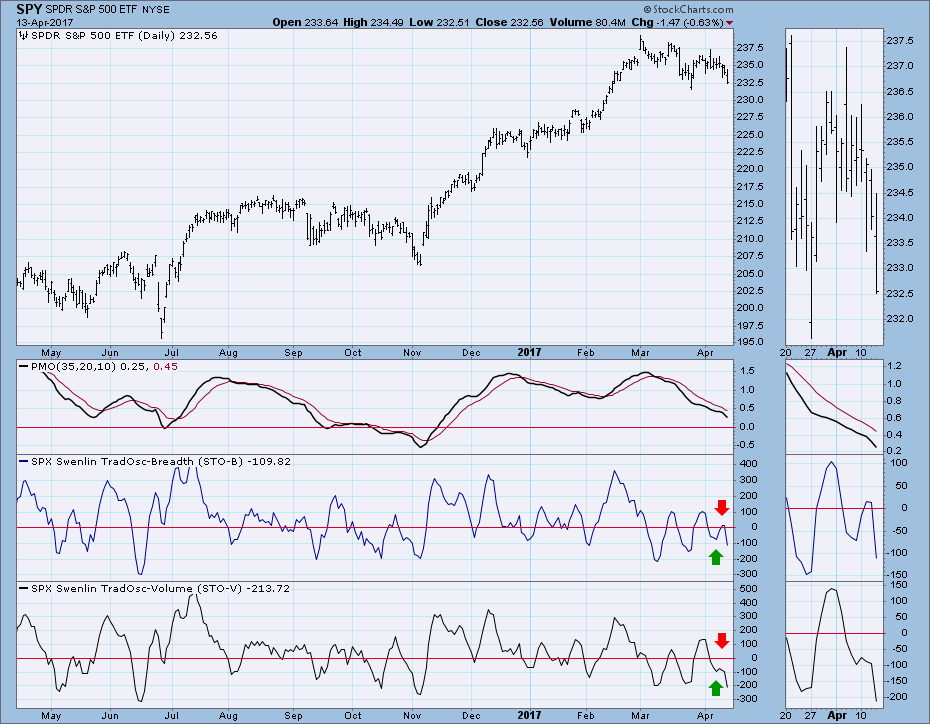
Intermediate-Term Indicators: In a bull market I don't normally expect to see readings very far below the zero line in this time frame. The current complex bottoms make me alert to the possibility of a new rally.
Conclusion: We are in a cyclical bull market within a longer-term secular bull market. The overvalued condition discussed above creates a fundamentally negative context, but it doesn't cry out for immediate remediation. The current correction has not done much price damage at all, with a price decline of only -3.3%. Intermediate-term indicators reveal sufficient internal correction to justify a new leg up. The first necessary signal that the correction is over would be for the daily PMO to turn up.
 News
News  Market Data
  Discover