InvestorsHub Logo

trader53

12/21/16 5:42 PM

#105099 RE: trueblue24 #105039

ICNB - Time & Sales

for Wednesday, December 21, 2016

Video - ClayTrader
http://investorshub.advfn.com/boards/read_msg.aspx?message_id=127347075


Date...Volume...Short Volume % of Vol Shorted

Dec 21...163,126,014...70,426,219 43.17%
Dec 20...131,309,793...39,804,094 30.31%


News / Targets

http://iconicbrandsusa.com/

http://www.allotcbb.com/quote.php?symbol=icnb

http://www.otcmarkets.com/stock/ICNB/profile

http://www.otcmarkets.com/stock/ICNB/news

http://www.otcmarkets.com/stock/ICNB/filings

Time & Sales / Historical Prices

http://www.investorpoint.com/stock/ICNB-Iconic+Brands+Inc./price-history/

http://www.investorpoint.com/stock/ICNB-Iconic+Brands+Inc./market-makers-level2/

Short Information

http://www.otcmarkets.com/stock/ICNB/short-sales

http://shortsqueeze.com/?symbol=icnb&submit=Short+Quote%99

http://otcshortreport.com/index.php?index=icnb&action=view#.Vm_UrOQo7cs

https://www.interactivebrokers.com/en/index.php?key=icnb&cntry=usa&tag=United+States&ib_entity=llc&ln=&asset=&f=4587&conf=am&amref=1


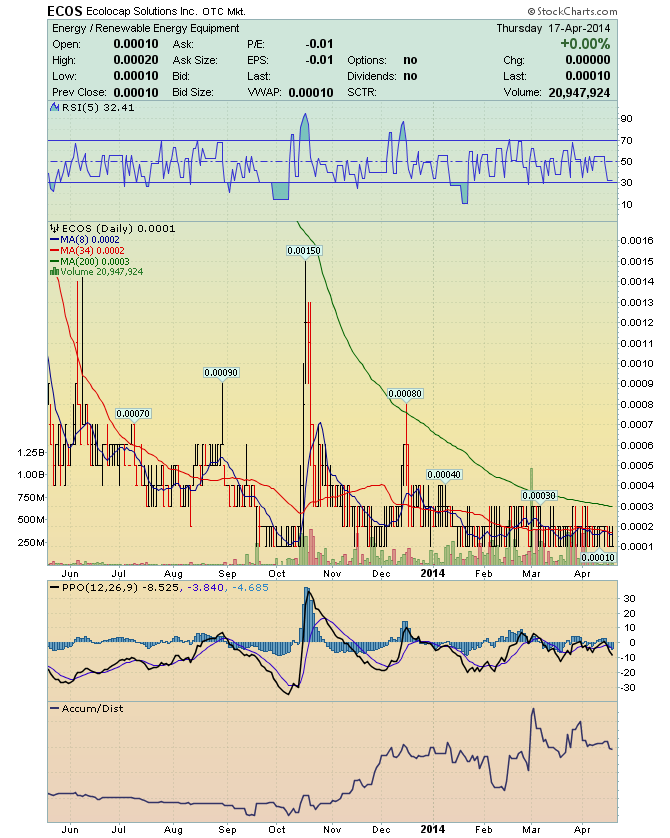
MARKET MAKER SIGNALS

Penny traders believe that Market Makers (MM)
will "signal" moves in advance buy using
small amounts of buys or sells as "signals".

The "signals" are such a small amount of shares
(worth no more than 5 or 10 dollars) that
no trader would have paid a commission that
costs more than the amount of shares bought.

The "signals" are from one MM to another.

100 - I need shares.
200 - I need shares badly, but do not take the stock down.
300 - Take the price down so I can load shares
400 - Keep trading it sideways.
500 - Gap the stock.
This gap can be either up or down,
depending on the direction of the 500 signal.
911 - Pending News

Understanding the Form T-Trade:

If a market maker wants to accumulate
a large amount of a stock in one trading day,

that market maker may actually not report
any of the trades that occurred
until the trading day has ended
so as not to alert the market to the collection.

http://investorshub.advfn.com/boards/read_msg.aspx?message_id=120820833&txt2find=understanding


Time & Sales

$0.0016 0.0007 (+77.78%) Volume: 163.13m

3:59 PM EST Dec 21, 2016


Price Size Mkt Time

$0.0016 1,000 OTO 15:59:53
$0.0016 343,750 OTO 15:56:43
$0.0016 80,000 OTO 15:55:13
$0.0016 22,935 OTO 15:54:18
$0.0015 10,000 OTO 15:52:33
$0.0015 25,000 OTO 15:52:24
$0.0015 10,000 OTO 15:52:12
$0.0015 20,000 OTO 15:52:07
$0.0015 200,000 OTO 15:43:18
$0.0015 235,603 OTO 15:43:00
$0.0016 20,000 OTO 15:42:23
$0.0015 140,016 OTO 15:42:15
$0.0015 375,619 OTO 15:42:12
$0.0015 2,000,000 OTO 15:42:03
$0.0015 2,000,000 OTO 15:42:01
$0.0015 600,000 OTO 15:41:04
$0.0016 2,500,000 OTO 15:41:00
$0.0015 2,700,000 OTO 15:40:05
$0.0016 175,000 OTO 15:39:28
$0.0016 25,000 OTO 15:37:47
$0.0016 600,000 OTO 15:32:33
$0.0016 200,000 OTO 15:31:41
$0.0015 112,962 OTO 15:31:26
$0.0015 564,200 OTO 15:31:04
$0.0015 335,800 OTO 15:31:04
$0.0016 300,000 OTO 15:27:32
$0.0016 450,000 OTO 15:26:55
$0.0016 75,000 OTO 15:26:52
$0.0016 225,000 OTO 15:18:42


Live! Charts


trader53

12/23/16 5:02 AM

#105207 RE: trueblue24 #105039

ICNB - PVSP

* From 0.0001 to 0.0034

PVSP
* From 0.0005 to 0.0034 - in 13 days

ICNB
* From 0.0005 to 0.0034 - in 5 days

* From 0.0001 to 0.0011


* From 0.0001 to 0.0034

PVSP
* From 0.0005 to 0.0034 - in 13 days

ICNB
* From 0.0005 to 0.0034 - in 5 days

* From 0.0001 to 0.0011


* From 0.0001 to 0.0034

PVSP
* From 0.0005 to 0.0034 - in 13 days

ICNB
* From 0.0005 to 0.0034 - in 5 days

* From 0.0001 to 0.0011


trader53

12/23/16 5:44 AM

#105210 RE: trueblue24 #105039

ICNB - The Euphoria Stage !


* Point of Maximum Financial Risk

* Euphoria

* Thrill

* Excitement

_____________________________________________________________


* Trading OTC stock is simple

* Buy some before the breakout starts.
Sell before the retrace starts.
* Be glad to sell at some higher level
than what you bought at.
* Move on to the next one !


_____________________________________________________________


Trader53's - Investment Philosophy

* You can't know where you're going, unless you know where you've been !
* Buy on Capitulation, Sell on the CELEBRATION !
* Buy the Dump, Sell on the PUMP !
* Buy on Rumor, Sell on NEWS !
* Buy on Fear, Sell on the CHEER !
* Trade well, trade often !


____________________________________________________________


http://iconicbrandsusa.com/

http://www.bellissimaprosecco.com/#/

http://www.otcmarkets.com/stock/ICNB/profile

http://otcshortreport.com/index.php?index=icnb&action=view#.Vm_UrOQo7cs

http://www.investorpoint.com/stock/ICNB-Iconic+Brands+Inc./price-history/

http://www.investorpoint.com/stock/ICNB-Iconic+Brands+Inc./market-makers-level2/

trader53

12/23/16 2:58 PM

#105248 RE: trueblue24 #105039

PMEA Alerted at 0.0001 - Climbs to 0.0004

I'll Alert you of stocks to Buy,
before the Run Happens !


Wealth Strategy: Hit the 0.0002's
http://investorshub.advfn.com/boards/read_msg.aspx?message_id=125580980

Educational Post: Trading All OTC stocks
http://investorshub.advfn.com/boards/read_msg.aspx?message_id=125559651


OTC Pink Current Information

Alternative Reporting

PMEA Security Details
Share Structure

Market Value1..........$2,785,400 a/o Dec 22, 2016
Authorized Shares..17,000,000,000 a/o Sep 30, 2016
Outstanding Shares 13,927,000,000 a/o Sep 30, 2016
Float.................912,000,000 a/o Sep 30, 2016
Par Value 0.001


http://www.otcmarkets.com/stock/PMEA/profile

http://www.allotcbb.com/quote.php?symbol=pmea

http://otcshortreport.com/?index=PMEA&action=view

http://www.investorpoint.com/stock/PMEA-Pm+E+Inc/price-history/

http://www.investorpoint.com/stock/PMEA-Pm+E+Inc/market-makers-level2/


Alerted
Saturday, 11/19/16
PMEA 0.0001 - BUY

http://investorshub.advfn.com/boards/read_msg.aspx?message_id=126681562&txt2find=pmea


Live! Chart


trader53

12/23/16 3:00 PM

#105249 RE: trueblue24 #105039

trader53

12/25/16 11:15 AM

#105320 RE: trueblue24 #105039

ICNB - SFOR - Elliott 5 Wave Sequence Up

Elliott Wave Basics
http://stockcharts.com/school/doku.php?id=chart_school:market_analysis:elliott_wave_theory

This stock has been going down,
and starts to trade sideways,
forming a base.

The sellers who once had the upper hand,
begin to lose their power,
because the buyers are starting to get more aggressive.

The stock just drifts sideways without a clear trend.

Everyone hates this stock!
This is the time to be Loading the Boat !!


http://investorshub.advfn.com/boards/read_msg.aspx?message_id=81775516


Impulse Wave 1 - The Accumulation Stage
the Wave right after a prolonged downtrend.


Wave 1

The stock makes its initial move upwards.
This is usually caused
by a relatively small number of people
that all of the sudden
(for a variety of reasons, real or imagined)
feel that the price of the stock is cheap
so it’s a perfect time to buy.
This causes the price to rise.


Wave 2 - Stock Declines

At this point,
enough people who were in the original wave
consider the stock overvalued and take profits.
This causes the stock to go down.
However, the stock will not make it to its previous lows
before the stock is considered a bargain again.


Wave 3

This is usually the longest and strongest wave.
The stock has caught the attention of the mass public.
More people find out about the stock and want to buy it.
This causes the stock’s price to go higher and higher.
This wave usually exceeds the high created at the end of Wave 1.


Wave 4

Traders take profits
because the stock is considered expensive again
.

This Wave tends to be weak
because there are usually more people
that are still bullish on the stock
and are waiting to “buy on the dips.”


Wave 5

This is the point that most people get in on the stock,
and is mostly driven by hysteria.

You usually start seeing the CEO of the company
on the front page of major magazines
as the Person of the Year.
Traders and investors start coming up with
ridiculous reasons to buy the stock
and try to choke you when you disagree with them.

This is when the stock becomes the most overpriced.
Contrarians start shorting the stock
which starts the ABC pattern.


trader53

12/25/16 11:17 AM

#105322 RE: trueblue24 #105039

ICNB - SFOR - Elliott 5th Wave Completed

Wave 5

This is the point that most people get in on the stock,
and is mostly driven by hysteria.

You usually start seeing the CEO of the company
on the front page of major magazines
as the Person of the Year.
Traders and investors start coming up with
ridiculous reasons to buy the stock
and try to choke you when you disagree with them.

This is when the stock becomes the most overpriced.
Contrarians start shorting the stock
which starts the ABC pattern.


Elliott Wave Basics
http://stockcharts.com/school/doku.php?id=chart_school:market_analysis:elliott_wave_theory

This stock has been going down,
and starts to trade sideways,
forming a base.

The sellers who once had the upper hand,
begin to lose their power,
because the buyers are starting to get more aggressive.

The stock just drifts sideways without a clear trend.

Everyone hates this stock!
This is the time to be Loading the Boat !!


http://investorshub.advfn.com/boards/read_msg.aspx?message_id=81775516


Impulse Wave 1 - The Accumulation Stage
the Wave right after a prolonged downtrend.


Wave 1

The stock makes its initial move upwards.
This is usually caused
by a relatively small number of people
that all of the sudden
(for a variety of reasons, real or imagined)
feel that the price of the stock is cheap
so it’s a perfect time to buy.
This causes the price to rise.


Wave 2 - Stock Declines

At this point,
enough people who were in the original wave
consider the stock overvalued and take profits.
This causes the stock to go down.
However, the stock will not make it to its previous lows
before the stock is considered a bargain again.


Wave 3

This is usually the longest and strongest wave.
The stock has caught the attention of the mass public.
More people find out about the stock and want to buy it.
This causes the stock’s price to go higher and higher.
This wave usually exceeds the high created at the end of Wave 1.


Wave 4

Traders take profits
because the stock is considered expensive again
.

This Wave tends to be weak
because there are usually more people
that are still bullish on the stock
and are waiting to “buy on the dips.”


Wave 5

This is the point that most people get in on the stock,
and is mostly driven by hysteria.

You usually start seeing the CEO of the company
on the front page of major magazines
as the Person of the Year.
Traders and investors start coming up with
ridiculous reasons to buy the stock
and try to choke you when you disagree with them.

This is when the stock becomes the most overpriced.
Contrarians start shorting the stock
which starts the ABC pattern.


trader53

12/25/16 9:00 PM

#105325 RE: trueblue24 #105039

ICNB - Elliott 5th Wave Completed

Elliott Wave Basics
http://stockcharts.com/school/doku.php?id=chart_school:market_analysis:elliott_wave_theory


http://iconicbrandsusa.com/

http://www.bellissimaprosecco.com/#/

http://www.otcmarkets.com/stock/ICNB/profile

http://otcshortreport.com/index.php?index=icnb&action=view#.Vm_UrOQo7cs

http://www.investorpoint.com/stock/ICNB-Iconic+Brands+Inc./price-history/

http://www.investorpoint.com/stock/ICNB-Iconic+Brands+Inc./market-


_________________________________________________________________


This stock has been going down,
and starts to trade sideways,
forming a base.

The sellers who once had the upper hand,
begin to lose their power,
because the buyers are starting to get more aggressive.

The stock just drifts sideways without a clear trend.

Everyone hates this stock!
This is the time to be Loading the Boat !!


Impulse Wave 1 - The Accumulation Stage
the Wave right after a prolonged downtrend.

http://investorshub.advfn.com/boards/read_msg.aspx?message_id=81775516


Wave 1

The stock makes its initial move upwards.
This is usually caused
by a relatively small number of people
that all of the sudden
(for a variety of reasons, real or imagined)
feel that the price of the stock is cheap
so it’s a perfect time to buy.
This causes the price to rise.


Wave 2 - Stock Declines

At this point,
enough people who were in the original wave
consider the stock overvalued and take profits.
This causes the stock to go down.
However, the stock will not make it to its previous lows
before the stock is considered a bargain again.


Wave 3

This is usually the longest and strongest wave.
The stock has caught the attention of the mass public.
More people find out about the stock and want to buy it.
This causes the stock’s price to go higher and higher.
This wave usually exceeds the high created at the end of Wave 1.


Wave 4

Traders take profits
because the stock is considered expensive again
.

This Wave tends to be weak
because there are usually more people
that are still bullish on the stock
and are waiting to “buy on the dips.”


Wave 5

This is the point that most people get in on the stock,
and is mostly driven by hysteria.

You usually start seeing the CEO of the company
on the front page of major magazines
as the Person of the Year.
Traders and investors start coming up with
ridiculous reasons to buy the stock
and try to choke you when you disagree with them.

This is when the stock becomes the most overpriced.
Contrarians start shorting the stock
which starts the ABC pattern.


Wave 4

Traders take profits
because the stock is considered expensive again
.

This Wave tends to be weak
because there are usually more people
that are still bullish on the stock
and are waiting to “buy on the dips.”


Wave 3

This is usually the longest and strongest wave.
The stock has caught the attention of the mass public.
More people find out about the stock and want to buy it.
This causes the stock’s price to go higher and higher.
This wave usually exceeds the high created at the end of Wave 1.


Wave 2 - Stock Declines

At this point,
enough people who were in the original wave
consider the stock overvalued and take profits.
This causes the stock to go down.
However, the stock will not make it to its previous lows
before the stock is considered a bargain again.


Impulse Wave 1 - The Accumulation Stage
the Wave right after a prolonged downtrend.

http://investorshub.advfn.com/boards/read_msg.aspx?message_id=81775516


Wave 1

The stock makes its initial move upwards.
This is usually caused
by a relatively small number of people
that all of the sudden
(for a variety of reasons, real or imagined)
feel that the price of the stock is cheap
so it’s a perfect time to buy.
This causes the price to rise.


This stock has been going down,
and starts to trade sideways,
forming a base.

The sellers who once had the upper hand,
begin to lose their power,
because the buyers are starting to get more aggressive.

The stock just drifts sideways without a clear trend.

Everyone hates this stock!
This is the time to be Loading the Boat !!


http://investorshub.advfn.com/boards/read_msg.aspx?message_id=81775516


trader53

12/29/16 8:56 AM

#105483 RE: trueblue24 #105039

ICNB - The Euphoria Stage !

* Point of Maximum Financial Risk

http://investorshub.advfn.com/boards/read_msg.aspx?message_id=127383665

BostonRon

01/02/17 11:11 AM

#105700 RE: trueblue24 #105039

What happened to $LEAS?